
Trade The World
Top 3 Price Prediction: Bitcoin, Ethereum, Ripple – BTC, ETH and XRP struggle as selling pressure mounts
作者 Manish Chhetri
發布日期: 20 Oct 2025 | 修改日期: 20 Oct 2025


POPULAR ARTICLES

Bitcoin (BTC) struggles to regain bullish momentum, hovering around $107,800 on Monday after a 5.49% drop last week. Ethereum (ETH) slips below the key $4,000 level, hinting at further downside risks, while Ripple (XRP) also trades under pressure as momentum continues to weaken.
- Bitcoin price hovers around $107,800 on Monday after falling 5.49% in the previous week.
- Ethereum slips below the $4,000 mark, pointing to potential for a deeper correction.
- XRP trades at $2.38, with momentum indicators suggesting possible further downside.
Bitcoin (BTC) struggles to regain bullish momentum, hovering around $107,800 on Monday after a 5.49% drop last week. Ethereum (ETH) slips below the key $4,000 level, hinting at further downside risks, while Ripple (XRP) also trades under pressure as momentum continues to weaken.
Bitcoin could correct toward $102,000 if it closes below key support
Bitcoin price faced rejection from the 50-day Exponential Moving Average (EMA) at $113,950 on Tuesday and declined 7.36% by Friday. However, BTC found support around the 61.8% Fibonacci retracement at $106,453 on Saturday and recovered by 2.22% the next day. At the time of writing on Monday, BTC hovers at around $108,700.
If BTC continues its price correction and closes below the $106,453 support, it could extend the decline toward the October 10 low of $102,000.
The Relative Strength Index (RSI) on the daily chart reads 40, below the neutral level of 50, indicating bearish momentum gaining traction. Moreover, the Moving Average Convergence Divergence (MACD) also showed a bearish crossover on October 11, which remains in effect, further supporting the bearish view.
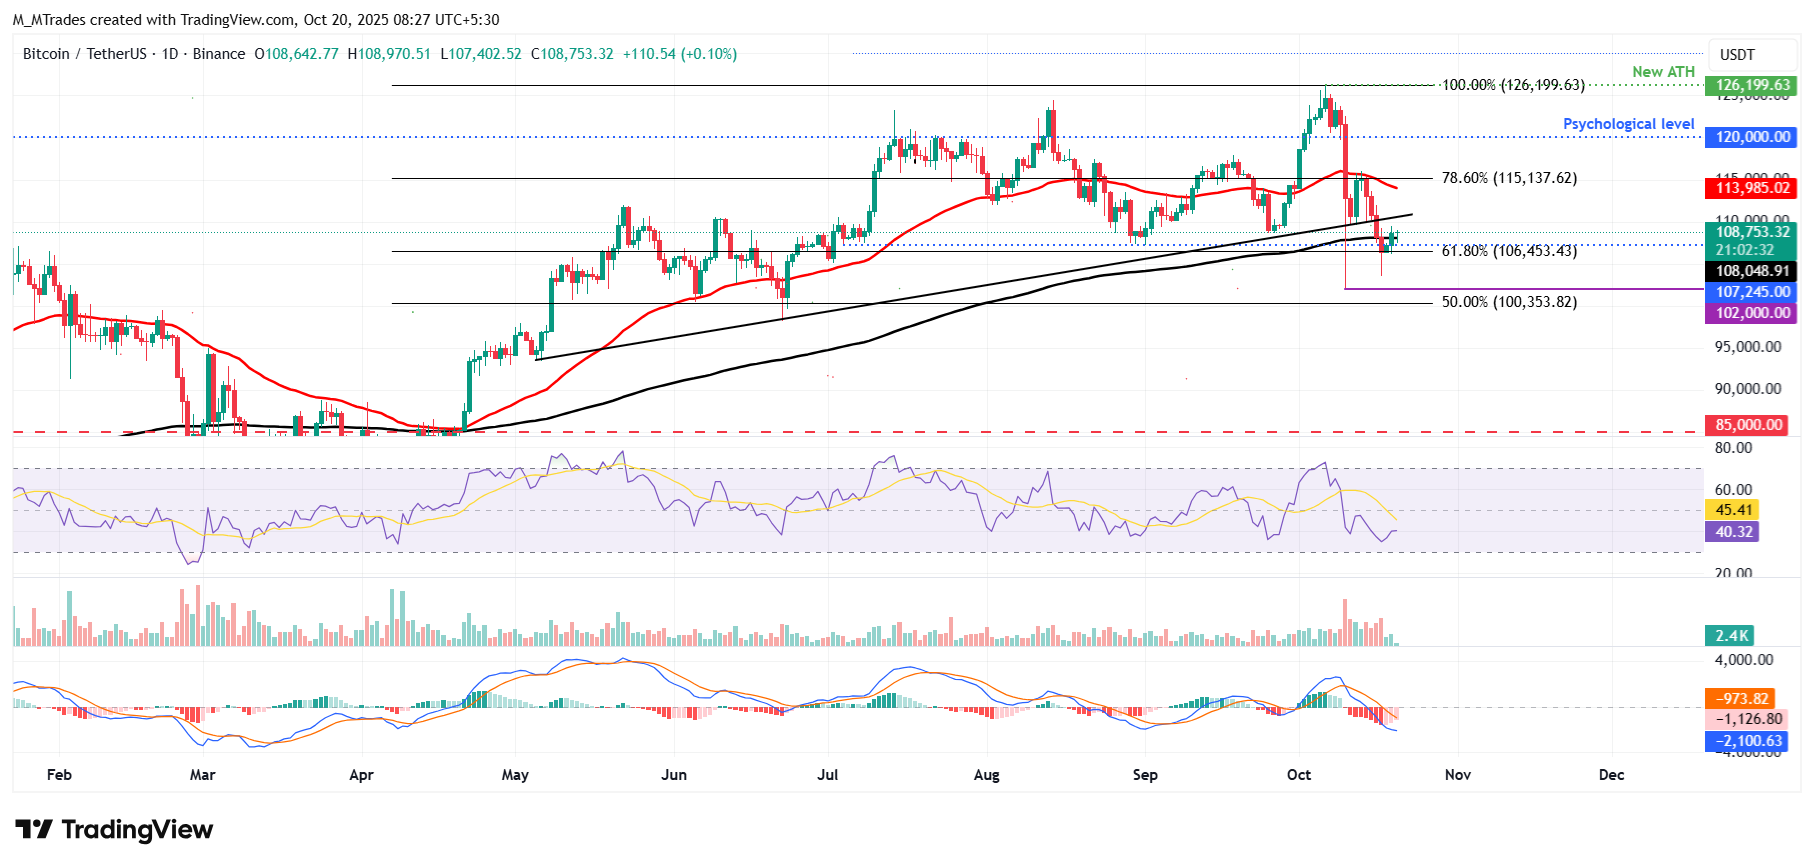
BTC/USDT daily chart
However, if BTC recovers, it could extend the recovery toward the previously broken trendline at around $110,000.
Ethereum shows weakness in momentum
Ethereum price corrected over 4% last week after facing rejection from the daily resistance at $4,232. At the start of this week on Monday, it hovers at around $3,953.
If ETH continues its downward momentum, it could extend the decline toward the 61.8% Fibonacci retracement level at $3,593, which coincides with the 200-day EMA.
Like Bitcoin, Ethereum’s RSI and MACD indicators also support the bearish view.
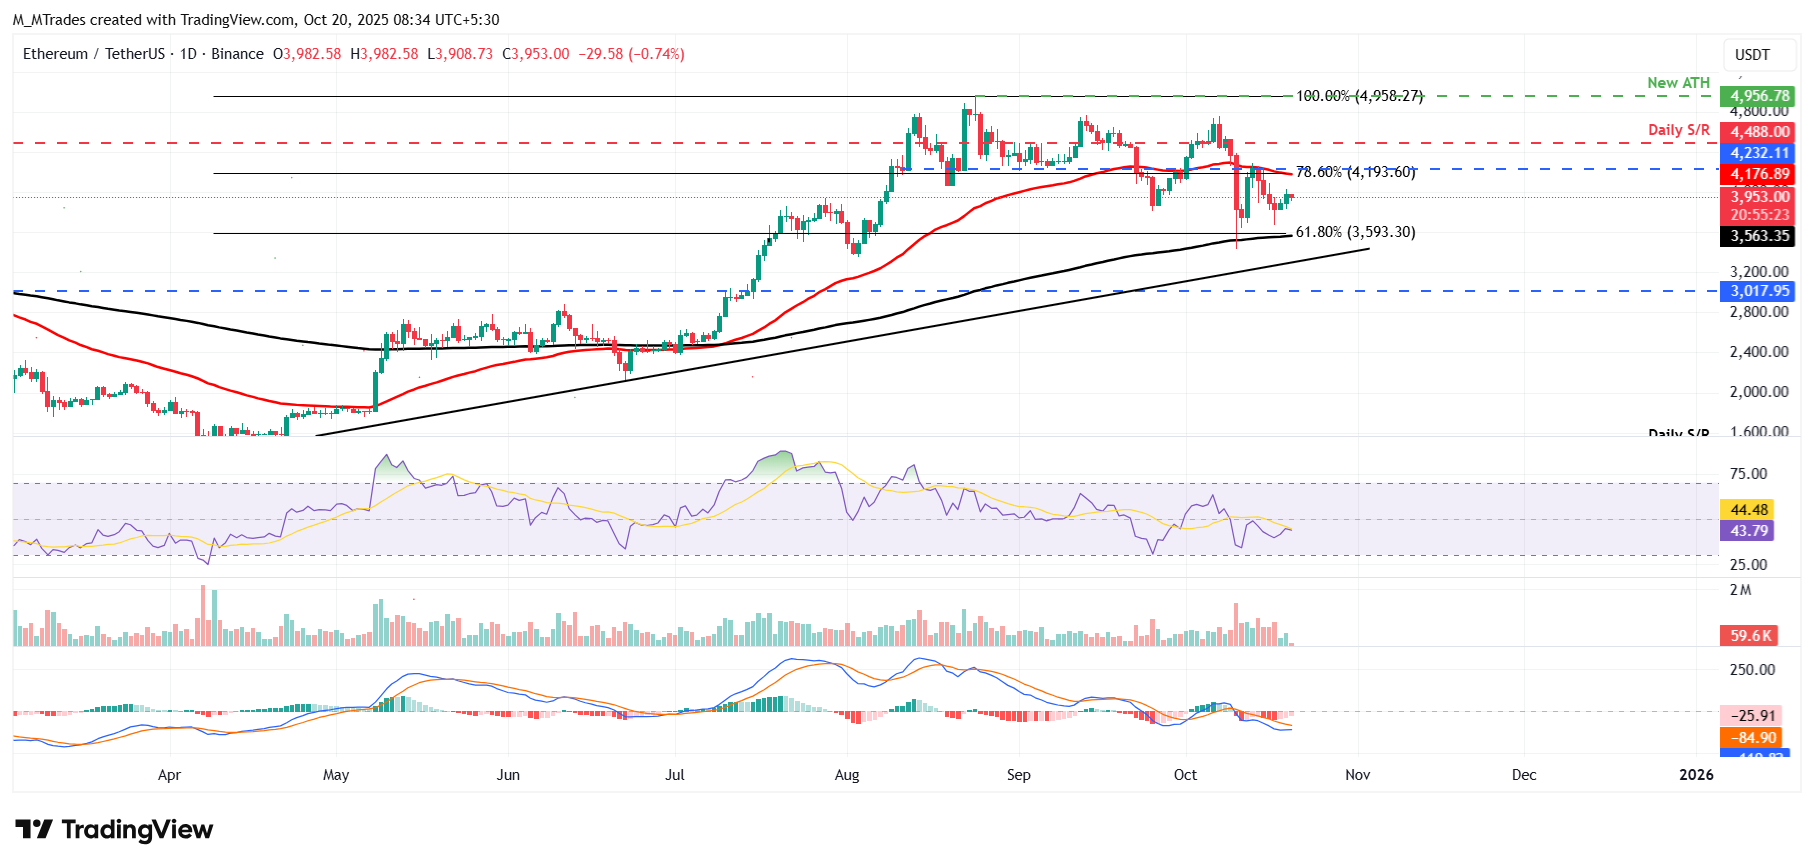
ETH/USDT daily chart
However, if ETH recovers, it could extend the recovery to retest its daily resistance level at $4,232.
XRP bears are in control of the momentum
XRP price corrected more than 5% last week after facing resistance around the lower trendline of a falling wedge pattern. At the time of writing on Monday, it hovers at around $2.38.
If XRP continues its downward trend, it could extend the decline toward the next daily support at $1.96.
Like Bitcoin and Ethereum, XRP’s momentum indicators, RSI and MACD, also support the bearish view.
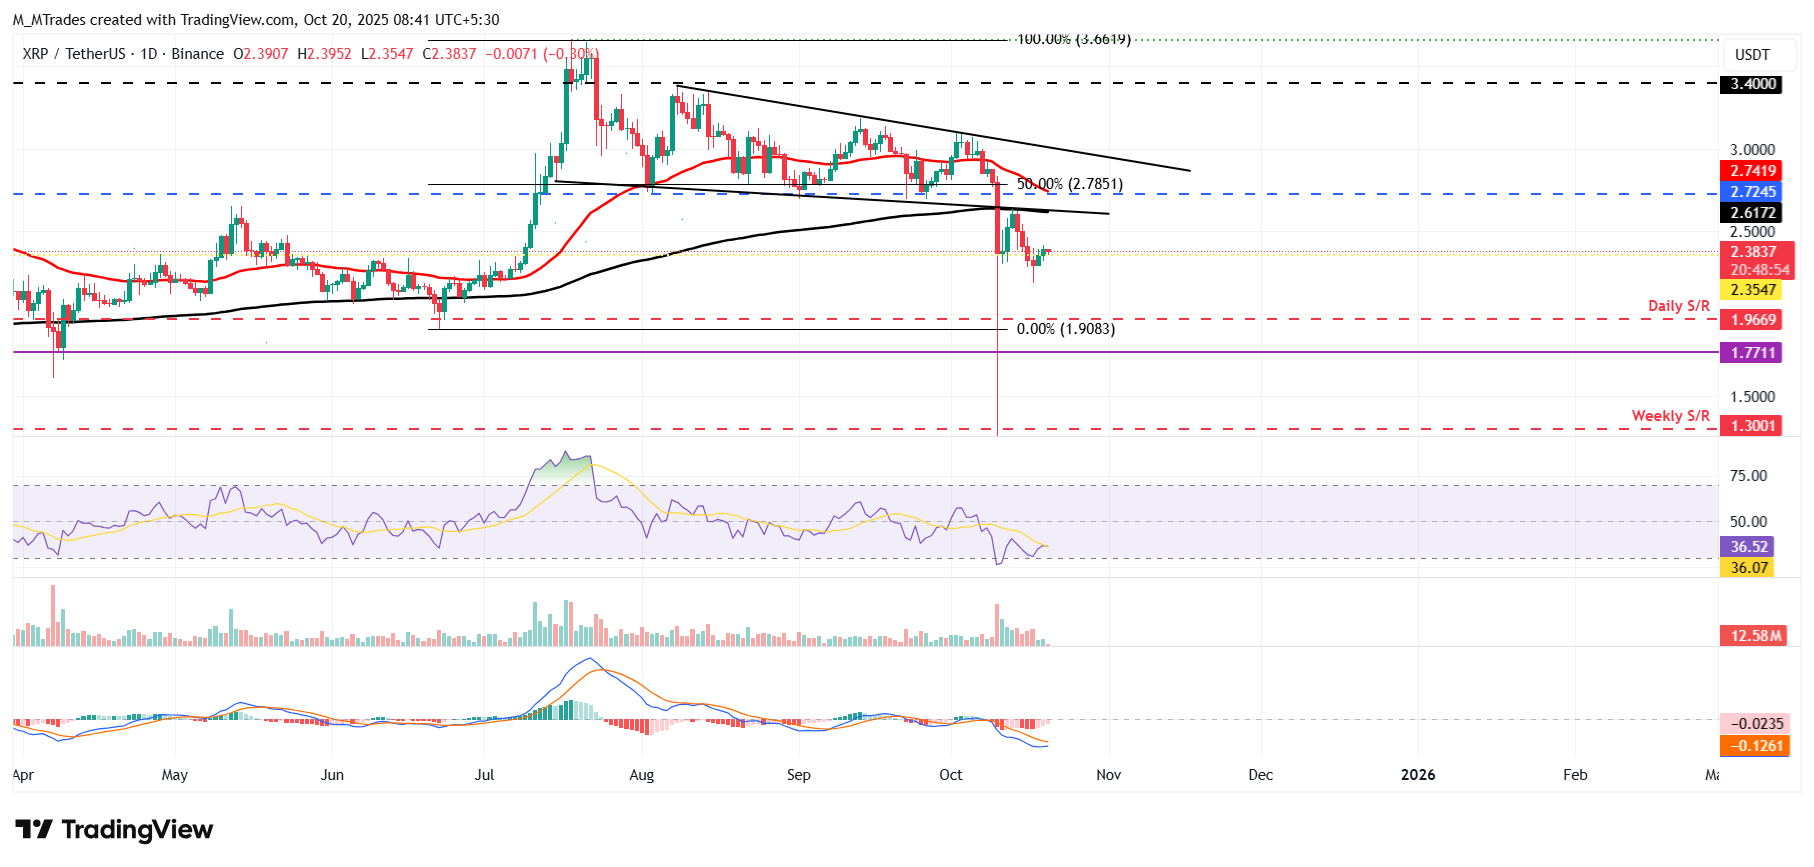
XRP/USDT daily chart
On the other hand, if XRP recovers, it could extend the recovery toward the 200-day EMA at $2.61.
Cryptocurrency metrics FAQs
The developer or creator of each cryptocurrency decides on the total number of tokens that can be minted or issued. Only a certain number of these assets can be minted by mining, staking or other mechanisms. This is defined by the algorithm of the underlying blockchain technology. On the other hand, circulating supply can also be decreased via actions such as burning tokens, or mistakenly sending assets to addresses of other incompatible blockchains.
Market capitalization is the result of multiplying the circulating supply of a certain asset by the asset’s current market value.
Trading volume refers to the total number of tokens for a specific asset that has been transacted or exchanged between buyers and sellers within set trading hours, for example, 24 hours. It is used to gauge market sentiment, this metric combines all volumes on centralized exchanges and decentralized exchanges. Increasing trading volume often denotes the demand for a certain asset as more people are buying and selling the cryptocurrency.
Funding rates are a concept designed to encourage traders to take positions and ensure perpetual contract prices match spot markets. It defines a mechanism by exchanges to ensure that future prices and index prices periodic payments regularly converge. When the funding rate is positive, the price of the perpetual contract is higher than the mark price. This means traders who are bullish and have opened long positions pay traders who are in short positions. On the other hand, a negative funding rate means perpetual prices are below the mark price, and hence traders with short positions pay traders who have opened long positions.

Acuity Trading
Acuity Trading 是一家成立於 2013 年、總部位於倫敦的金融科技公司,專注於 AI 驅動的另類數據與情緒分析,用於交易與投資。他們以可視化新聞與情緒工具革新線上交易體驗,並持續以最新 AI 研究與技術提供可產生阿爾法的另類數據與高度互動的交易工具。
Read More


