
Trade The World
US Dollar Index Price Forecast: DXY eases from two-week high, dips to 97.75/38.2% Fibo.
作者 Haresh Menghani
發布日期: 25 Sep 2025 | 修改日期: 25 Sep 2025


POPULAR ARTICLES

The US Dollar Index (DXY), which tracks the Greenback against a basket of currencies, edges lower during the Asian session on Thursday and erodes a part of the previous day's strong move up to the 98.00 neighborhood, or a two-week high.
- The USD struggles to capitalize on the previous day's strong move up to a two-week high.
- Fed Chair Powell's cautious remarks on rate cuts could act as a tailwind for the Greenback.
- The technical setup favors the USD bulls and backs the case for the emergence of dip-buying.
The US Dollar Index (DXY), which tracks the Greenback against a basket of currencies, edges lower during the Asian session on Thursday and erodes a part of the previous day's strong move up to the 98.00 neighborhood, or a two-week high. The index is currently placed around the 97.75 region, down 0.10% for the day, though the lack of follow-through selling warrants caution for bearish traders.
The growing acceptance that the US Federal Reserve (Fed) will lower borrowing costs again in October and December, following a 25 basis points rate cut earlier this month, turns out to be a key factor acting as a headwind for the USD. However, Fed Chair Jerome Powell's cautious remarks on potential interest rate cuts hold back the USD bears from placing aggressive bets and should help limit deeper losses.
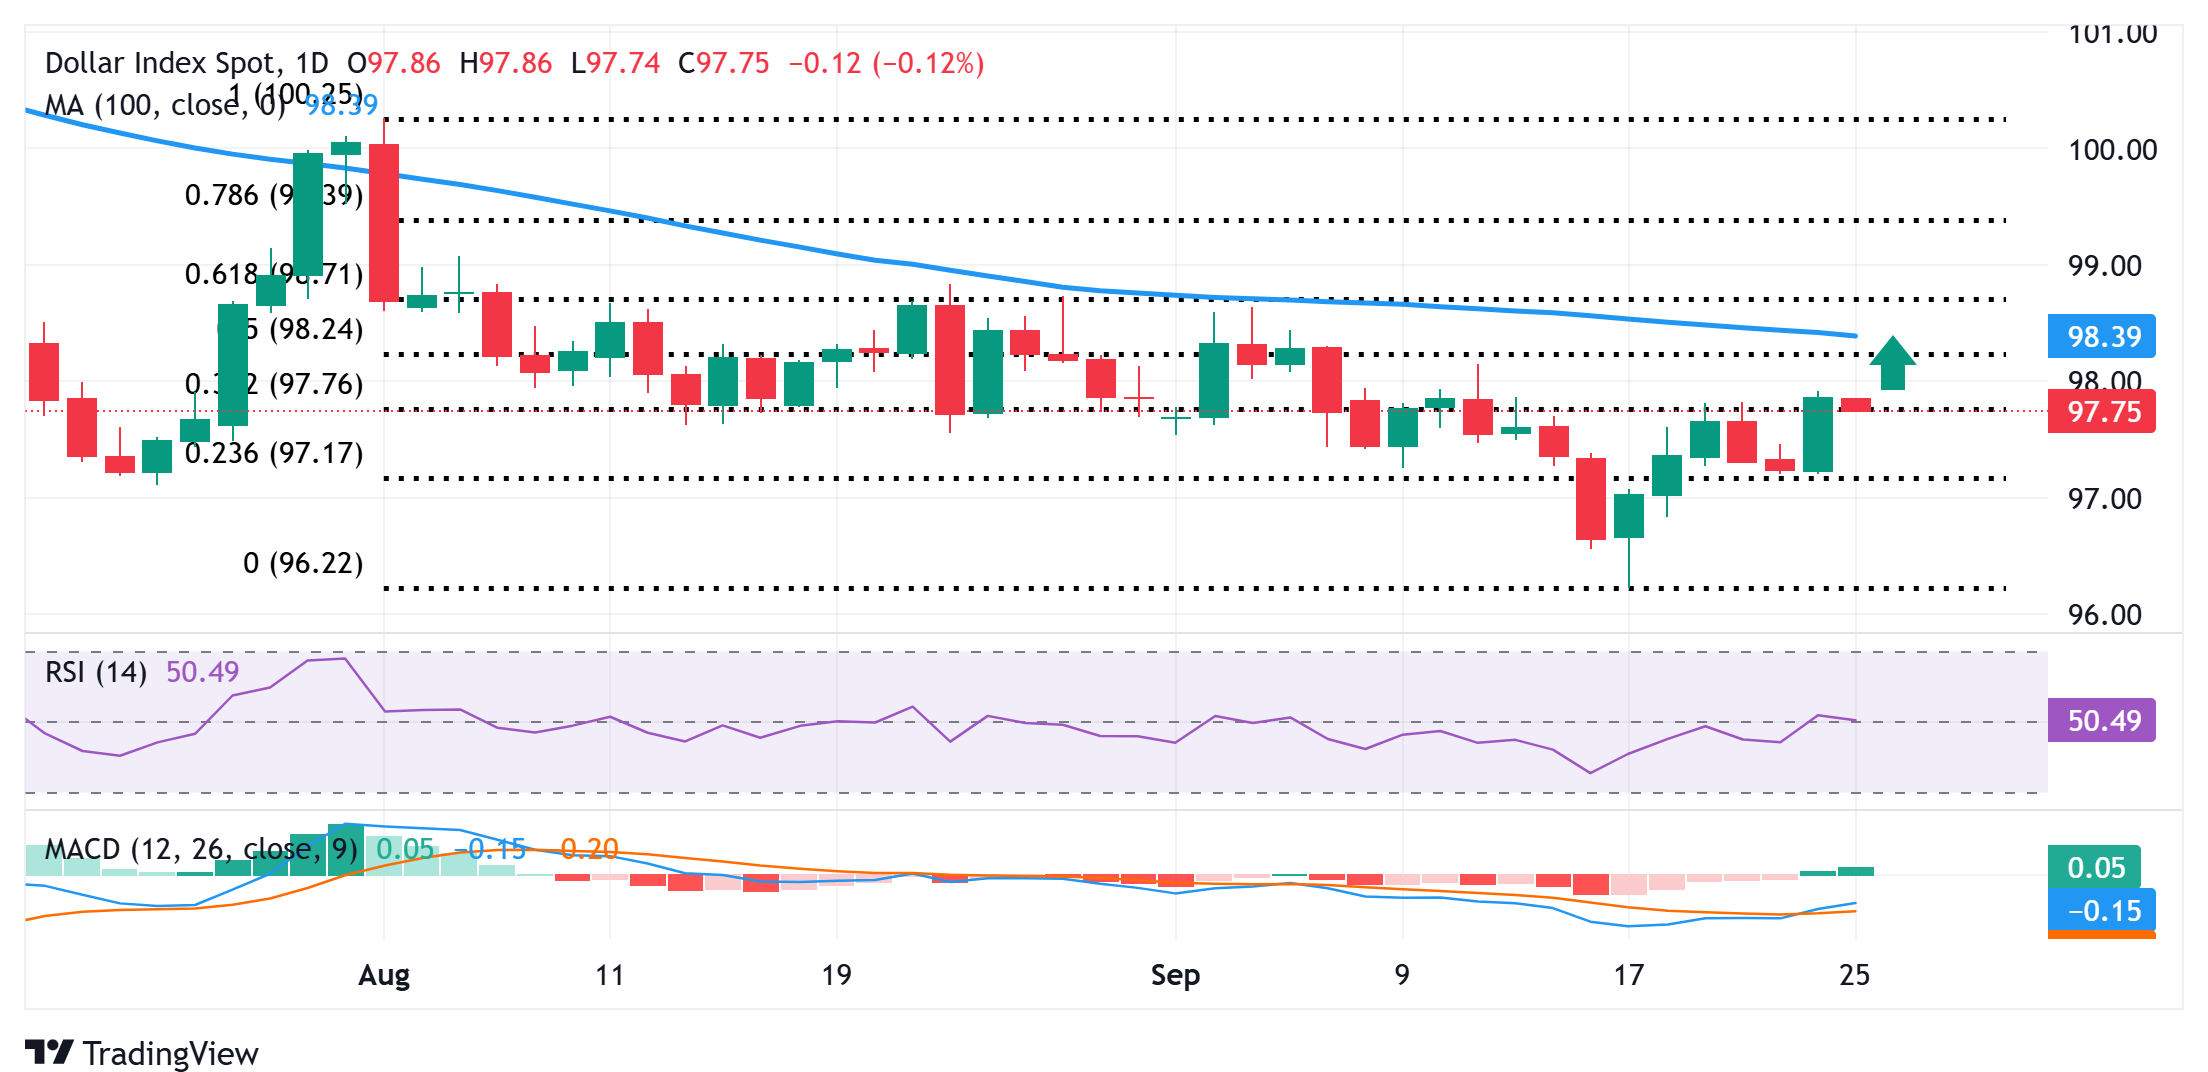
From a technical perspective, the overnight close above the 38.2% Fibonacci retracement level of the August-September downfall could be seen as a key trigger for the USD bulls. Moreover, oscillators on the daily chart have just started moving into positive territory and back the case for the emergence of dip-buying near the 97.50 area, which is followed by the 97.25 region, or the 23.6% Fibo. retracement level.
A convincing break below the latter might prompt some technical selling and make the DXY vulnerable to weaken further below the 97.00 round figure, towards the next relevant support near the 96.65 region. The downward trajectory could extend further towards the 96.25-96.20 area, or the lowest level since July 2022, touched in reaction to the US central bank's first rate cut since December last Wednesday.
On the flip side, bulls might now wait for a move beyond the 98.00 mark before positioning for any further gains towards the 98.25 zone, or the 50% Fibo. retracement level, en route to the 100-day Simple Moving Average (SMA), near the 96.40 region. This is followed by the 61.8% Fibo. retracement level, around the 96.70 area, which, if cleared, will suggest that the USD Index has bottomed out and set the stage for further gains.
US Dollar Index daily chart
US Dollar FAQs
The US Dollar (USD) is the official currency of the United States of America, and the ‘de facto’ currency of a significant number of other countries where it is found in circulation alongside local notes. It is the most heavily traded currency in the world, accounting for over 88% of all global foreign exchange turnover, or an average of $6.6 trillion in transactions per day, according to data from 2022. Following the second world war, the USD took over from the British Pound as the world’s reserve currency. For most of its history, the US Dollar was backed by Gold, until the Bretton Woods Agreement in 1971 when the Gold Standard went away.
The most important single factor impacting on the value of the US Dollar is monetary policy, which is shaped by the Federal Reserve (Fed). The Fed has two mandates: to achieve price stability (control inflation) and foster full employment. Its primary tool to achieve these two goals is by adjusting interest rates. When prices are rising too quickly and inflation is above the Fed’s 2% target, the Fed will raise rates, which helps the USD value. When inflation falls below 2% or the Unemployment Rate is too high, the Fed may lower interest rates, which weighs on the Greenback.
In extreme situations, the Federal Reserve can also print more Dollars and enact quantitative easing (QE). QE is the process by which the Fed substantially increases the flow of credit in a stuck financial system. It is a non-standard policy measure used when credit has dried up because banks will not lend to each other (out of the fear of counterparty default). It is a last resort when simply lowering interest rates is unlikely to achieve the necessary result. It was the Fed’s weapon of choice to combat the credit crunch that occurred during the Great Financial Crisis in 2008. It involves the Fed printing more Dollars and using them to buy US government bonds predominantly from financial institutions. QE usually leads to a weaker US Dollar.
Quantitative tightening (QT) is the reverse process whereby the Federal Reserve stops buying bonds from financial institutions and does not reinvest the principal from the bonds it holds maturing in new purchases. It is usually positive for the US Dollar.

Acuity Trading
Acuity Trading 是一家成立於 2013 年、總部位於倫敦的金融科技公司,專注於 AI 驅動的另類數據與情緒分析,用於交易與投資。他們以可視化新聞與情緒工具革新線上交易體驗,並持續以最新 AI 研究與技術提供可產生阿爾法的另類數據與高度互動的交易工具。
Read More


