
Aave Price Forecast: AAVE surges as capital flows return to DeFi
作者 Manish Chhetri
更新: 25 Jun 2026


熱門文章

Aave (AAVE) extends its rally, trading above $81 on Thursday after closing above its key resistance and surging more than 10% the previous day. The bullish move is supported by improving on-chain metrics, with USDT deposits flowing back into the protocol and strengthening its lending ecosystem.
- Aave extends its gains on Thursday after closing above the 50-day EMA and surging over 10% in the previous day.
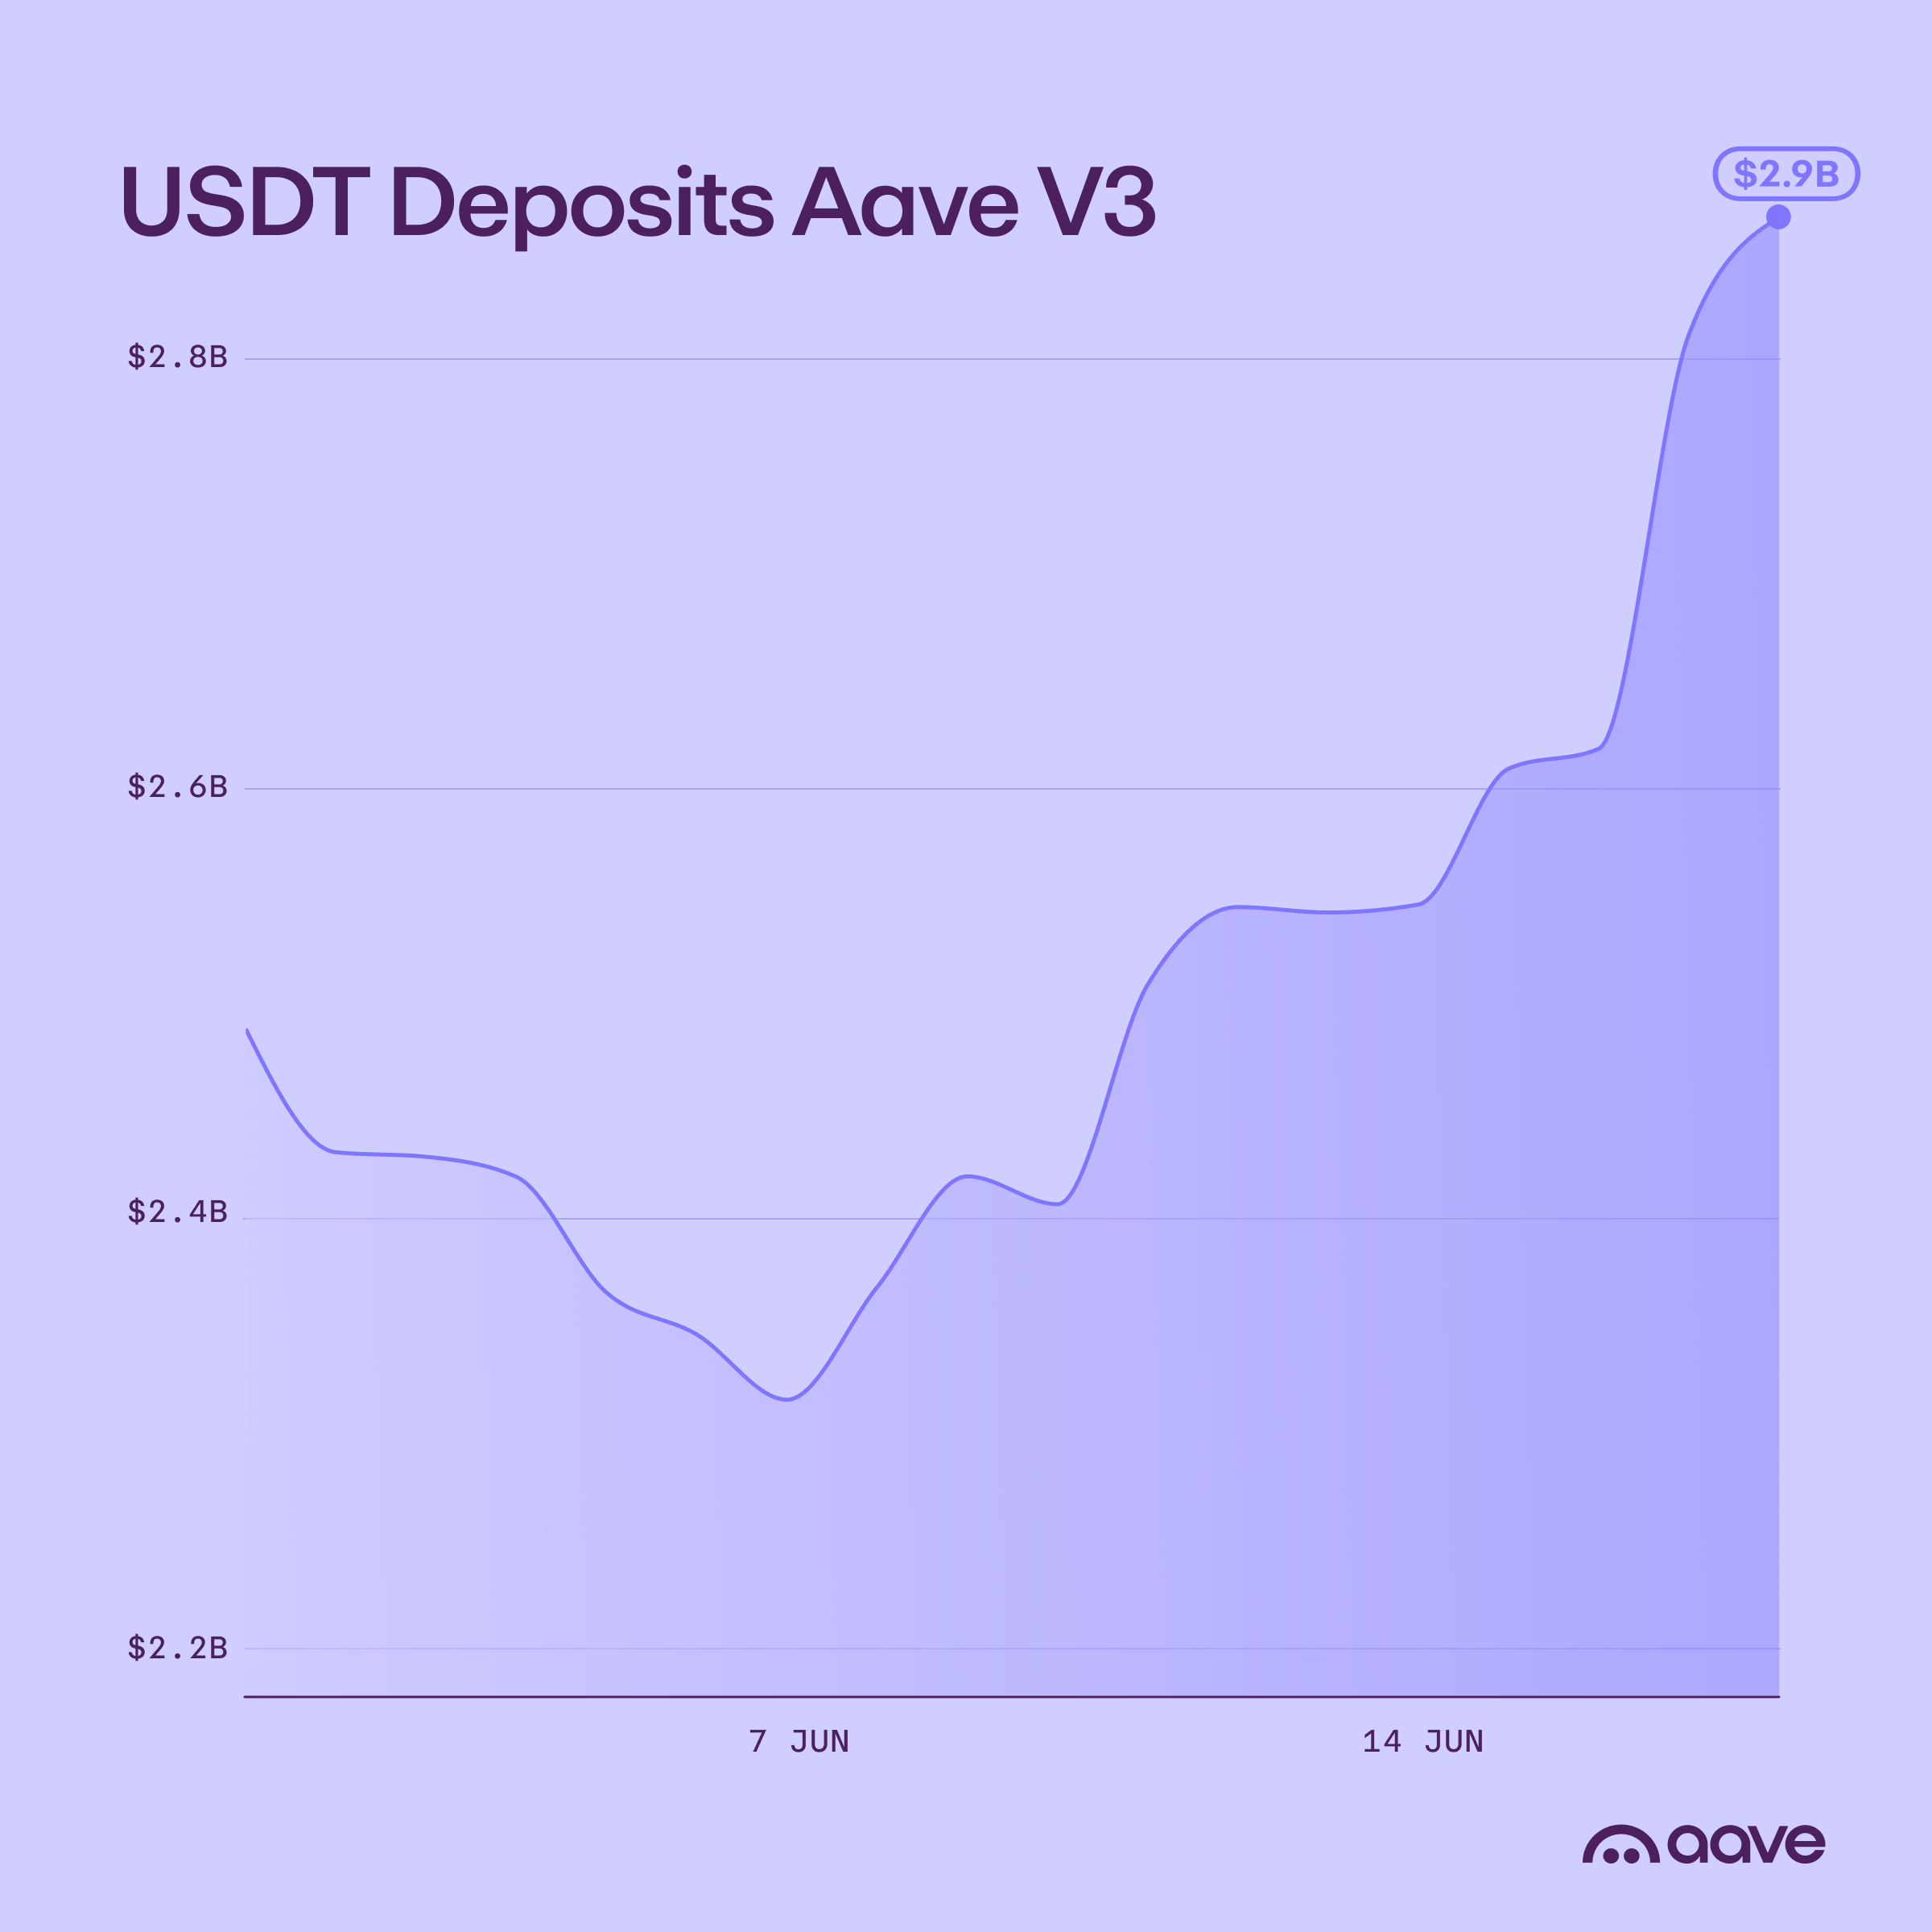
- On-chain data shows that USDT deposits are flowing back into Aave, bolstering its borrowing capacity and yield opportunities.
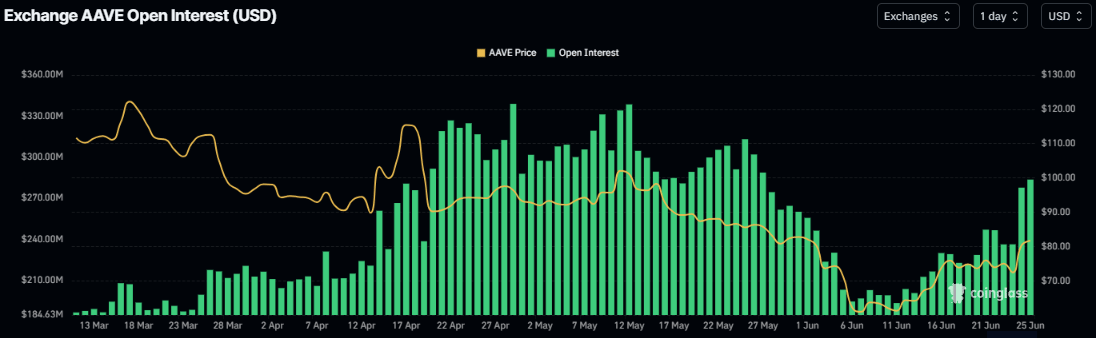
- Derivatives metrics support a bullish picture with rising open interest and positive funding rates.
Aave (AAVE) extends its rally, trading above $81 on Thursday after closing above its key resistance and surging more than 10% the previous day. The bullish move is supported by improving on-chain metrics, with USDT deposits flowing back into the protocol and strengthening its lending ecosystem. In addition, rising Open Interest (OI) and positive funding rates in the derivatives market suggest traders are increasingly positioning for further upside.
Strengthening the lending ecosystem
Stani Kulechov, Aave's founder, posted on X on Wednesday that USDT deposits are flowing back to the protocol, with the Ethereum V3 Core market approaching $3 billion in deposits, a sharp rise since mid-June. This increase in USDT liquidity signals a bullish outlook for the Aave ecosystem and its native token, AAVE, as it strengthens the lending ecosystem, increases the protocol's borrowing capacity, and offers yield opportunities.
Derivatives metrics show bullish bias
On the derivatives side, metrics support a positive outlook. Aave’s futures OI rises to $283.33 million on Thursday from $193 million on June 11 and has been continuously rising since mid-June. Increasing OI indicates new or additional money entering the market and new buying, suggesting a bullish trend.
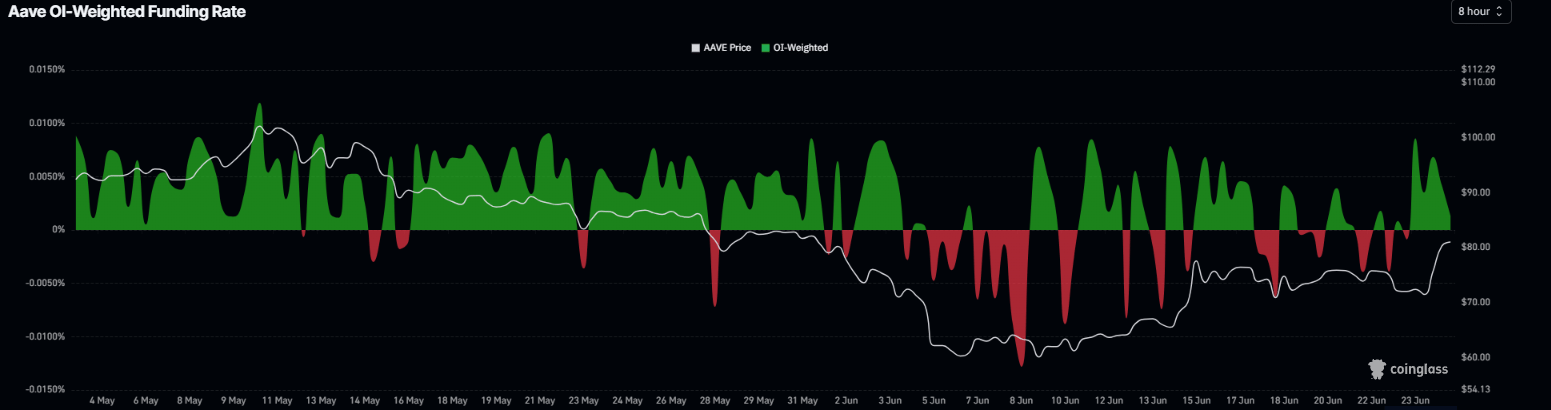
In addition, the funding rate turns positive on Tuesday, reading 0.0014% on Thursday, indicating that longs are paying shorts and suggesting bullish sentiment.
Aave Price Forecast: AAVE could extend gains if the 50-day EMA holds
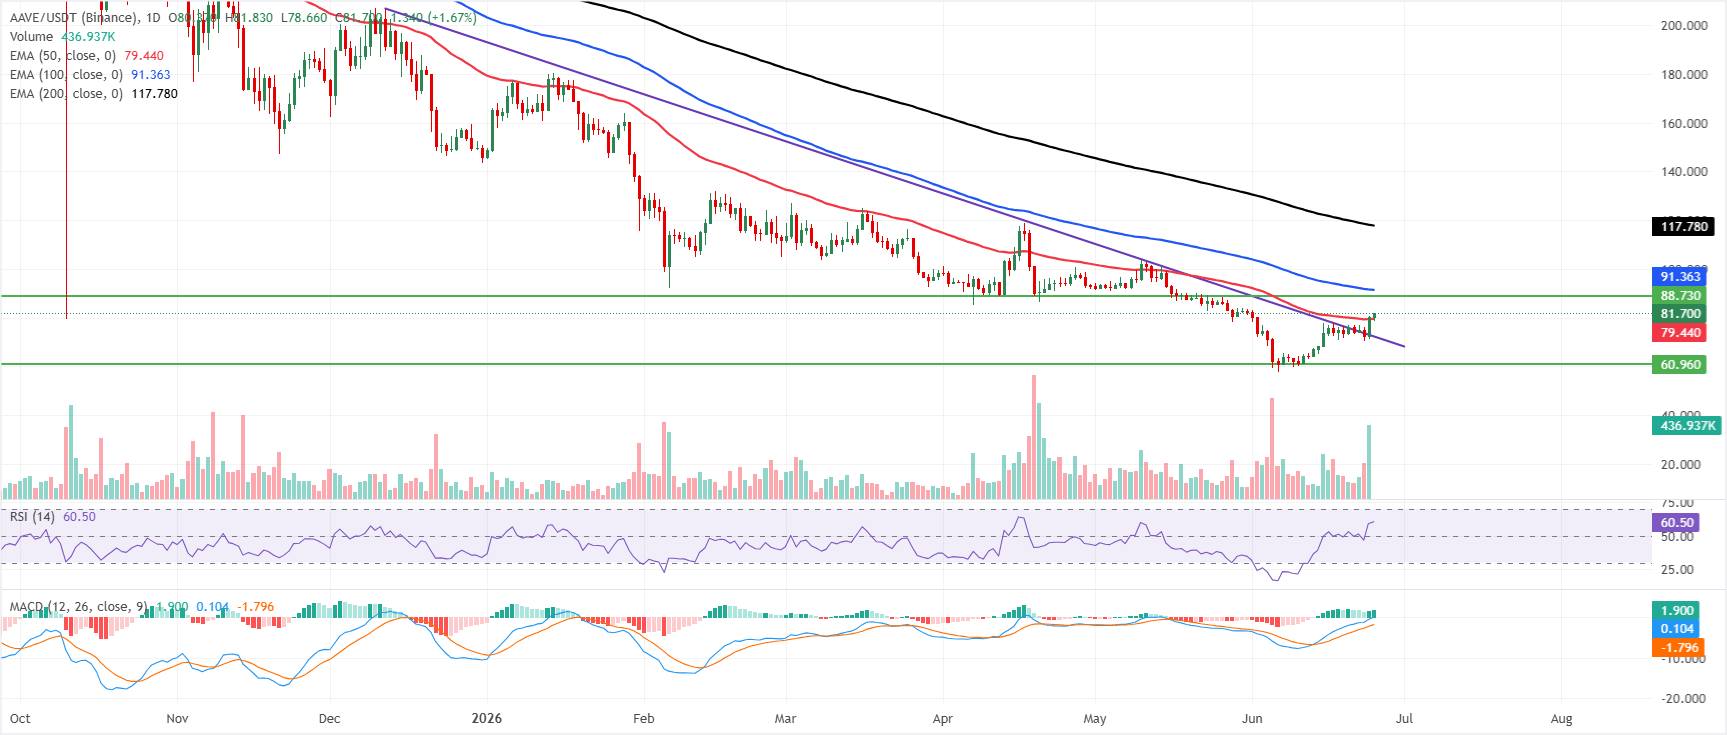
AAVE trades at $81.70 on Thursday, extending a constructive near-term bias as price holds above the 50-day Exponential Moving Average (EMA) at $79.44 and has reclaimed the former downtrend resistance line, which now offers support near $72.23.
Momentum remains favorable, with the Relative Strength Index (RSI) hovering in bullish territory around 61 and the Moving Average Convergence Divergence (MACD) line holding above its signal and zero, which suggests buyers still retain control despite significant overhead levels.
On the topside, initial resistance is at the horizontal cap near $88.73, followed by the 100-day EMA near $91.36 and then the more important 200-day EMA near $117.78, where the broader bearish structure would be challenged.
On the downside, immediate support is seen at the 50-day EMA at $79.44, ahead of the reclaimed downtrend line around $72.23 and the prior horizontal floor near $60.96, a loss of which would seriously weaken the current bullish recovery phase.
(The technical analysis of this story was written with the help of an AI tool.)

超過一百萬用戶依賴 FXStreet 獲取即時市場數據、圖表工具、專家洞見與外匯新聞。其全面的經濟日曆與教育網路研討會協助交易者保持資訊領先、做出審慎決策。FXStreet 擁有約 60 人的團隊,分布於巴塞隆納總部及全球各地。
閱讀更多


