
AUD/USD Price Forecast: Stuck between key SMAs, RSI turns bearish
作者 Christian Borjon Valencia
更新: 22 May 2026


熱門文章

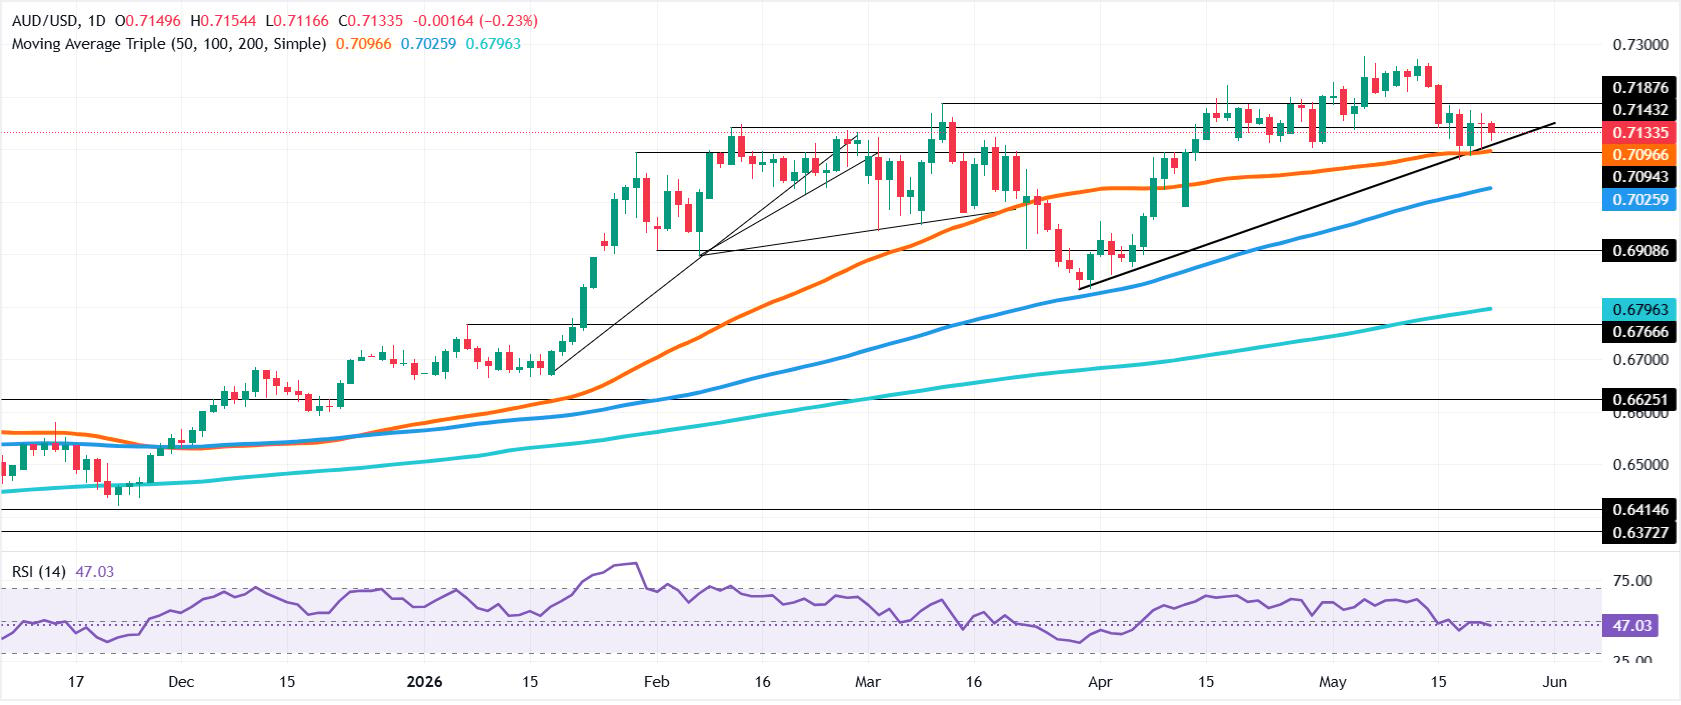
The AUD/USD edges lower during the North American session, poised to remain sideways within key technical support and resistance levels, with the 20-day Simple Moving Average (SMA) at 0.7187 and the 50-day SMA at 0.7095. At the time of writing, the pair is trading around 0.7137, down 0.17%.
- AUD/USD trades sideways between 20- and 50-day SMA levels.
- RSI falls below 50, signaling sellers are gaining momentum.
- Break below 0.7099 exposes 0.7024 and 0.7000 supports.
The AUD/USD edges lower during the North American session, poised to remain sideways within key technical support and resistance levels, with the 20-day Simple Moving Average (SMA) at 0.7187 and the 50-day SMA at 0.7095. At the time of writing, the pair is trading around 0.7137, down 0.17%.
AUD/USD Price Forecast: Technical outlook
From a technical perspective, the AUD/USD market structure suggests further downside if the pair falls below the April 29 swing low at 0.7101, reaching a 4-week low at 0.7079 on May 19.
The Relative Strength Index (RSI) turned bearish, signaling that sellers are gaining momentum, as it fell below its 50-neutral level.
For a bearish resumption, the AUD/USD must clear the May 21 low at 0.7099, so traders can test the 50-day SMA. On further weakness, the 100-day SMA at 0.7024 becomes the next support level, followed by 0.7000.
On the upside, a break above the 20-day SMA will expose the 0.7200 milestone. Above this area, the next resistance is the year-to-date (YTD) peak at 0.7264.
AUD/USD Price Chart – Daily
Australian Dollar Price This week
The table below shows the percentage change of Australian Dollar (AUD) against listed major currencies this week. Australian Dollar was the strongest against the Canadian Dollar.
| USD | EUR | GBP | JPY | CAD | AUD | NZD | CHF | |
|---|---|---|---|---|---|---|---|---|
| USD | 0.14% | -0.87% | 0.25% | 0.46% | 0.28% | -0.15% | -0.23% | |
| EUR | -0.14% | -1.03% | 0.17% | 0.30% | 0.12% | -0.22% | -0.39% | |
| GBP | 0.87% | 1.03% | 1.16% | 1.33% | 1.17% | 0.81% | 0.61% | |
| JPY | -0.25% | -0.17% | -1.16% | 0.15% | -0.05% | -0.45% | -0.52% | |
| CAD | -0.46% | -0.30% | -1.33% | -0.15% | -0.20% | -0.60% | -0.72% | |
| AUD | -0.28% | -0.12% | -1.17% | 0.05% | 0.20% | -0.34% | -0.43% | |
| NZD | 0.15% | 0.22% | -0.81% | 0.45% | 0.60% | 0.34% | -0.20% | |
| CHF | 0.23% | 0.39% | -0.61% | 0.52% | 0.72% | 0.43% | 0.20% |
The heat map shows percentage changes of major currencies against each other. The base currency is picked from the left column, while the quote currency is picked from the top row. For example, if you pick the Australian Dollar from the left column and move along the horizontal line to the US Dollar, the percentage change displayed in the box will represent AUD (base)/USD (quote).

超過一百萬用戶依賴 FXStreet 獲取即時市場數據、圖表工具、專家洞見與外匯新聞。其全面的經濟日曆與教育網路研討會協助交易者保持資訊領先、做出審慎決策。FXStreet 擁有約 60 人的團隊,分布於巴塞隆納總部及全球各地。
閱讀更多


