
Bitcoin could risk $50,000 amid the US-Iran war, mirroring the Russia-Ukraine war losses
作者 Vishal Dixit
發布日期: 3 Mar 2026 | 修改日期: 3 Mar 2026


熱門文章

Bitcoin (BTC) remains at downside risk amid escalation in the Middle East war, as Iran retaliates against the US, Israel, and its neighbouring countries. Drawing parallels to the early days of the Russia-Ukraine war, Bitcoin could extend losses below $60,000.
- Bitcoin remains below $70,000 amid the ongoing US-Iran war, while the 2022 price action during the Russia-Ukraine crisis warns deeper correction.
- Geopolitical tensions stemming from the Strait of Hormuz blockage parallel the 2022-2023 collapse of Terra Luna and the US banking crisis.
- Insights from 21Shares suggest steady institutional demand could cap the downside to $56,000.
Bitcoin (BTC) remains at downside risk amid escalation in the Middle East war, as Iran retaliates against the US, Israel, and its neighbouring countries. Drawing parallels to the early days of the Russia-Ukraine war, Bitcoin could extend losses below $60,000. Geopolitical tensions in the Middle East, the Strait of Hormuz blockage weighing on global Oil supply, and falling Asian markets could act as bearish catalysts, similar to the 2022-2023 banking crisis, due to the US Federal Reserve's (Fed) quickly hiked interest rates to fight inflation, and the collapse of Terra Luna.
21Shares' insights focus on institutional demand to avoid a similar correction and cap the downside around $56,000.
Bitcoin risks mirroring wartime history
Bitcoin drops to $67,000 at press time on Tuesday, retracing lower within a sideways consolidation zone defined by the February 5 price action, with alowof $62,909 and a high of $73,165. The US-Israel war on Iran is adding geopolitical pressure on Bitcoin’s price, resulting in a 3% loss so far today.
Comparing recent Bitcoin price movements with the 2022 Russia-Ukraine wartime experience, a striking similarity suggests a significant downside risk.
Russia first attacked Ukraine on February 24, 2022, when Bitcoin was down roughly 46% from its then record high of $69,000. During the recent US-Israel strikes on Iran on Saturday (February 28), Bitcoin was down roughly 48% from its new record high of $126,199, reached on October 6.
Following the Russian attack, Bitcoin maintained a sideways trend above $36,000 before collapsing in May, triggering a downtrend driven by breakdowns of multiple short-term ranges. This downward trend resulted in a 77% decline to $15,476, nearly testing the 1.618 Fibonacci extension level at $14,550, measured from the November 10, 2021, high at $69,000, to the March 28, 2022, high at $48,189.
The ongoing consolidation in Bitcoin holds above the 100% trend-based Fibonacci retracement tool at $62,541, measured from the October 6 high of $126,199 to the January 14 high of $97,924. On the downside, the tool highlights the 1.618 Fibonacci extension level at $47,405, roughly 30% down from the current market price.
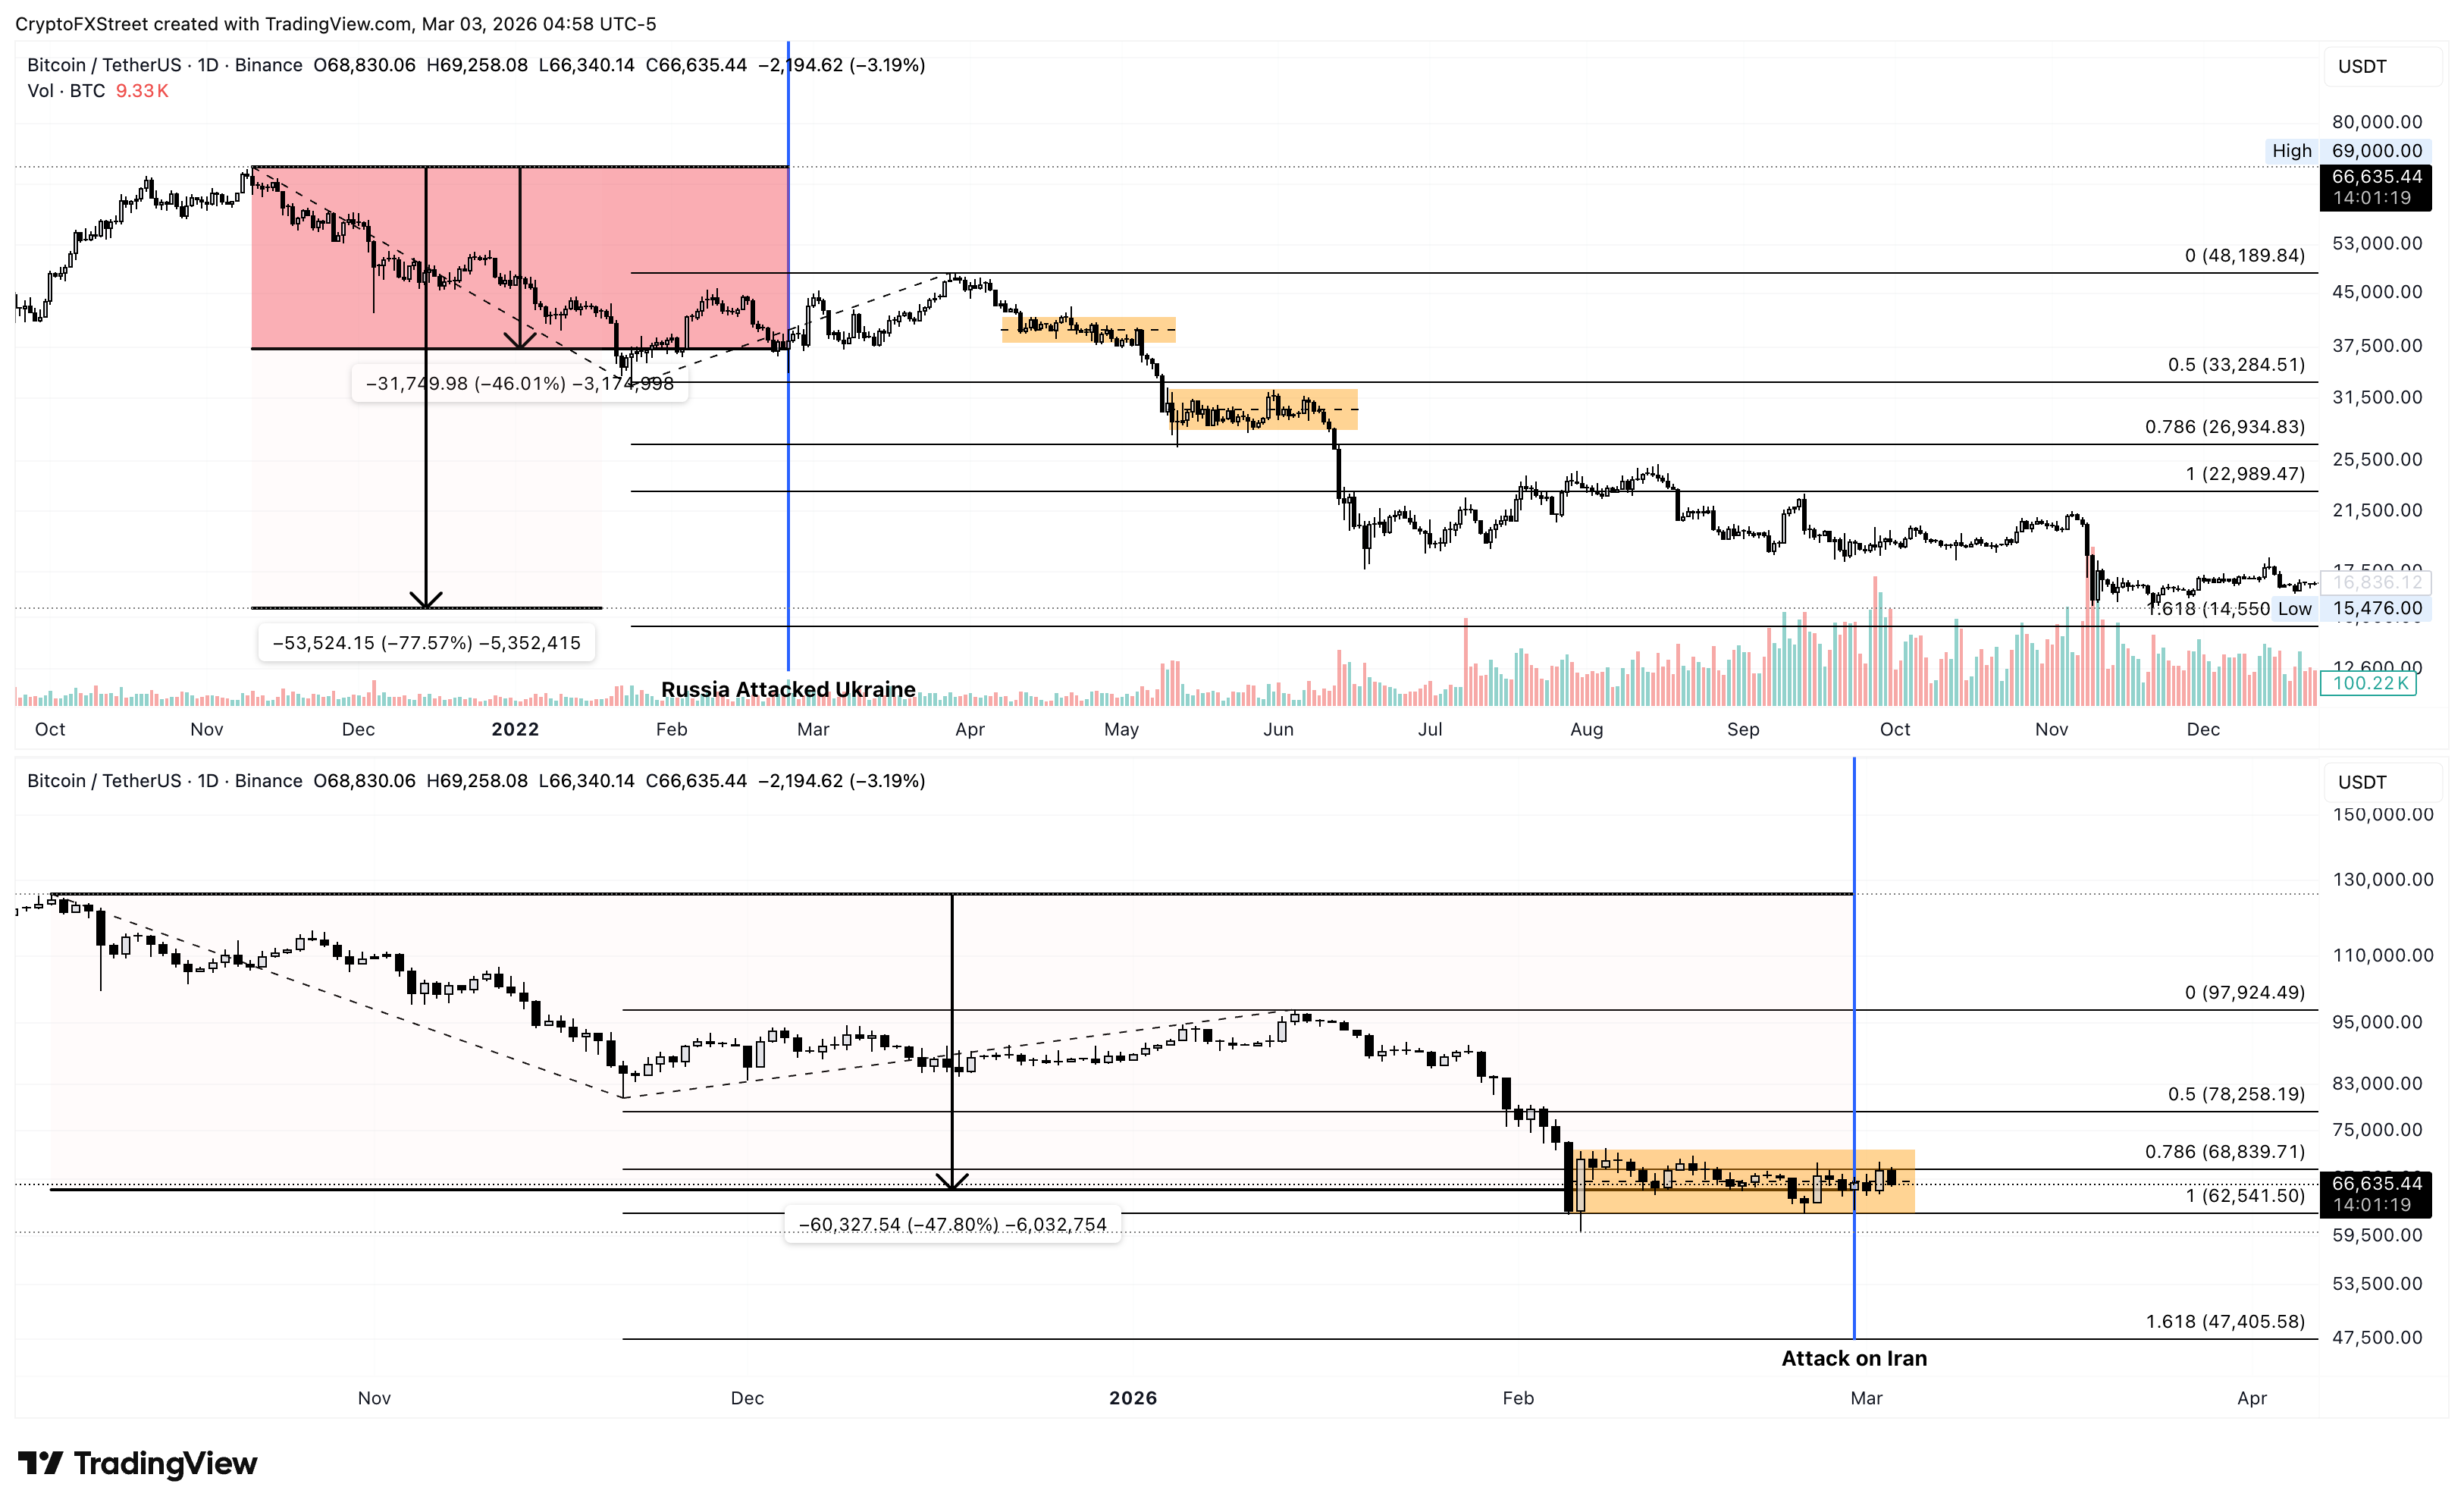
Still, as long as Bitcoin consolidates, the upside potential remains on the table, marked by the 50% Fibonacci retracement level at $78,258.
According to a 21Shares report, key support for Bitcoin lies near $56,000 if it drops below $60,000. On the upside, $74,000 could serve as a resistance zone if BTC clears above $70,000.
Bearish fundamentals weigh down on Bitcoin
After the Russia-Ukraine war in 2022, the cryptocurrency market saw the collapse of the Terra Luna ecosystem, and the US Fed's quantitative tightening led to rate hikes after near-zero interest rates during the 2020 pandemic. This led to multiple bank-level defaults, including those of Silvergate and Silicon Valley Bank.
In 2026, the geopolitical tensions could replace the banking crises as the bearish catalyst. Amid the ongoing war, Iran has shut down transports from the Strait of Hormuz, a canal through which 20% of global Oil and Gas is shipped.
Meanwhile, Asian markets are under pressure, as they are heavily dependent on this canal's energy transport. At the time of writing on Tuesday, South Korea’s stock market index is down 7%, Japan’s is down 6%, while India’s and the UK’s are down 3%. This reflects a risk-off sentiment in the global economy, and a bearish day in the US stock market could confirm the thesis.
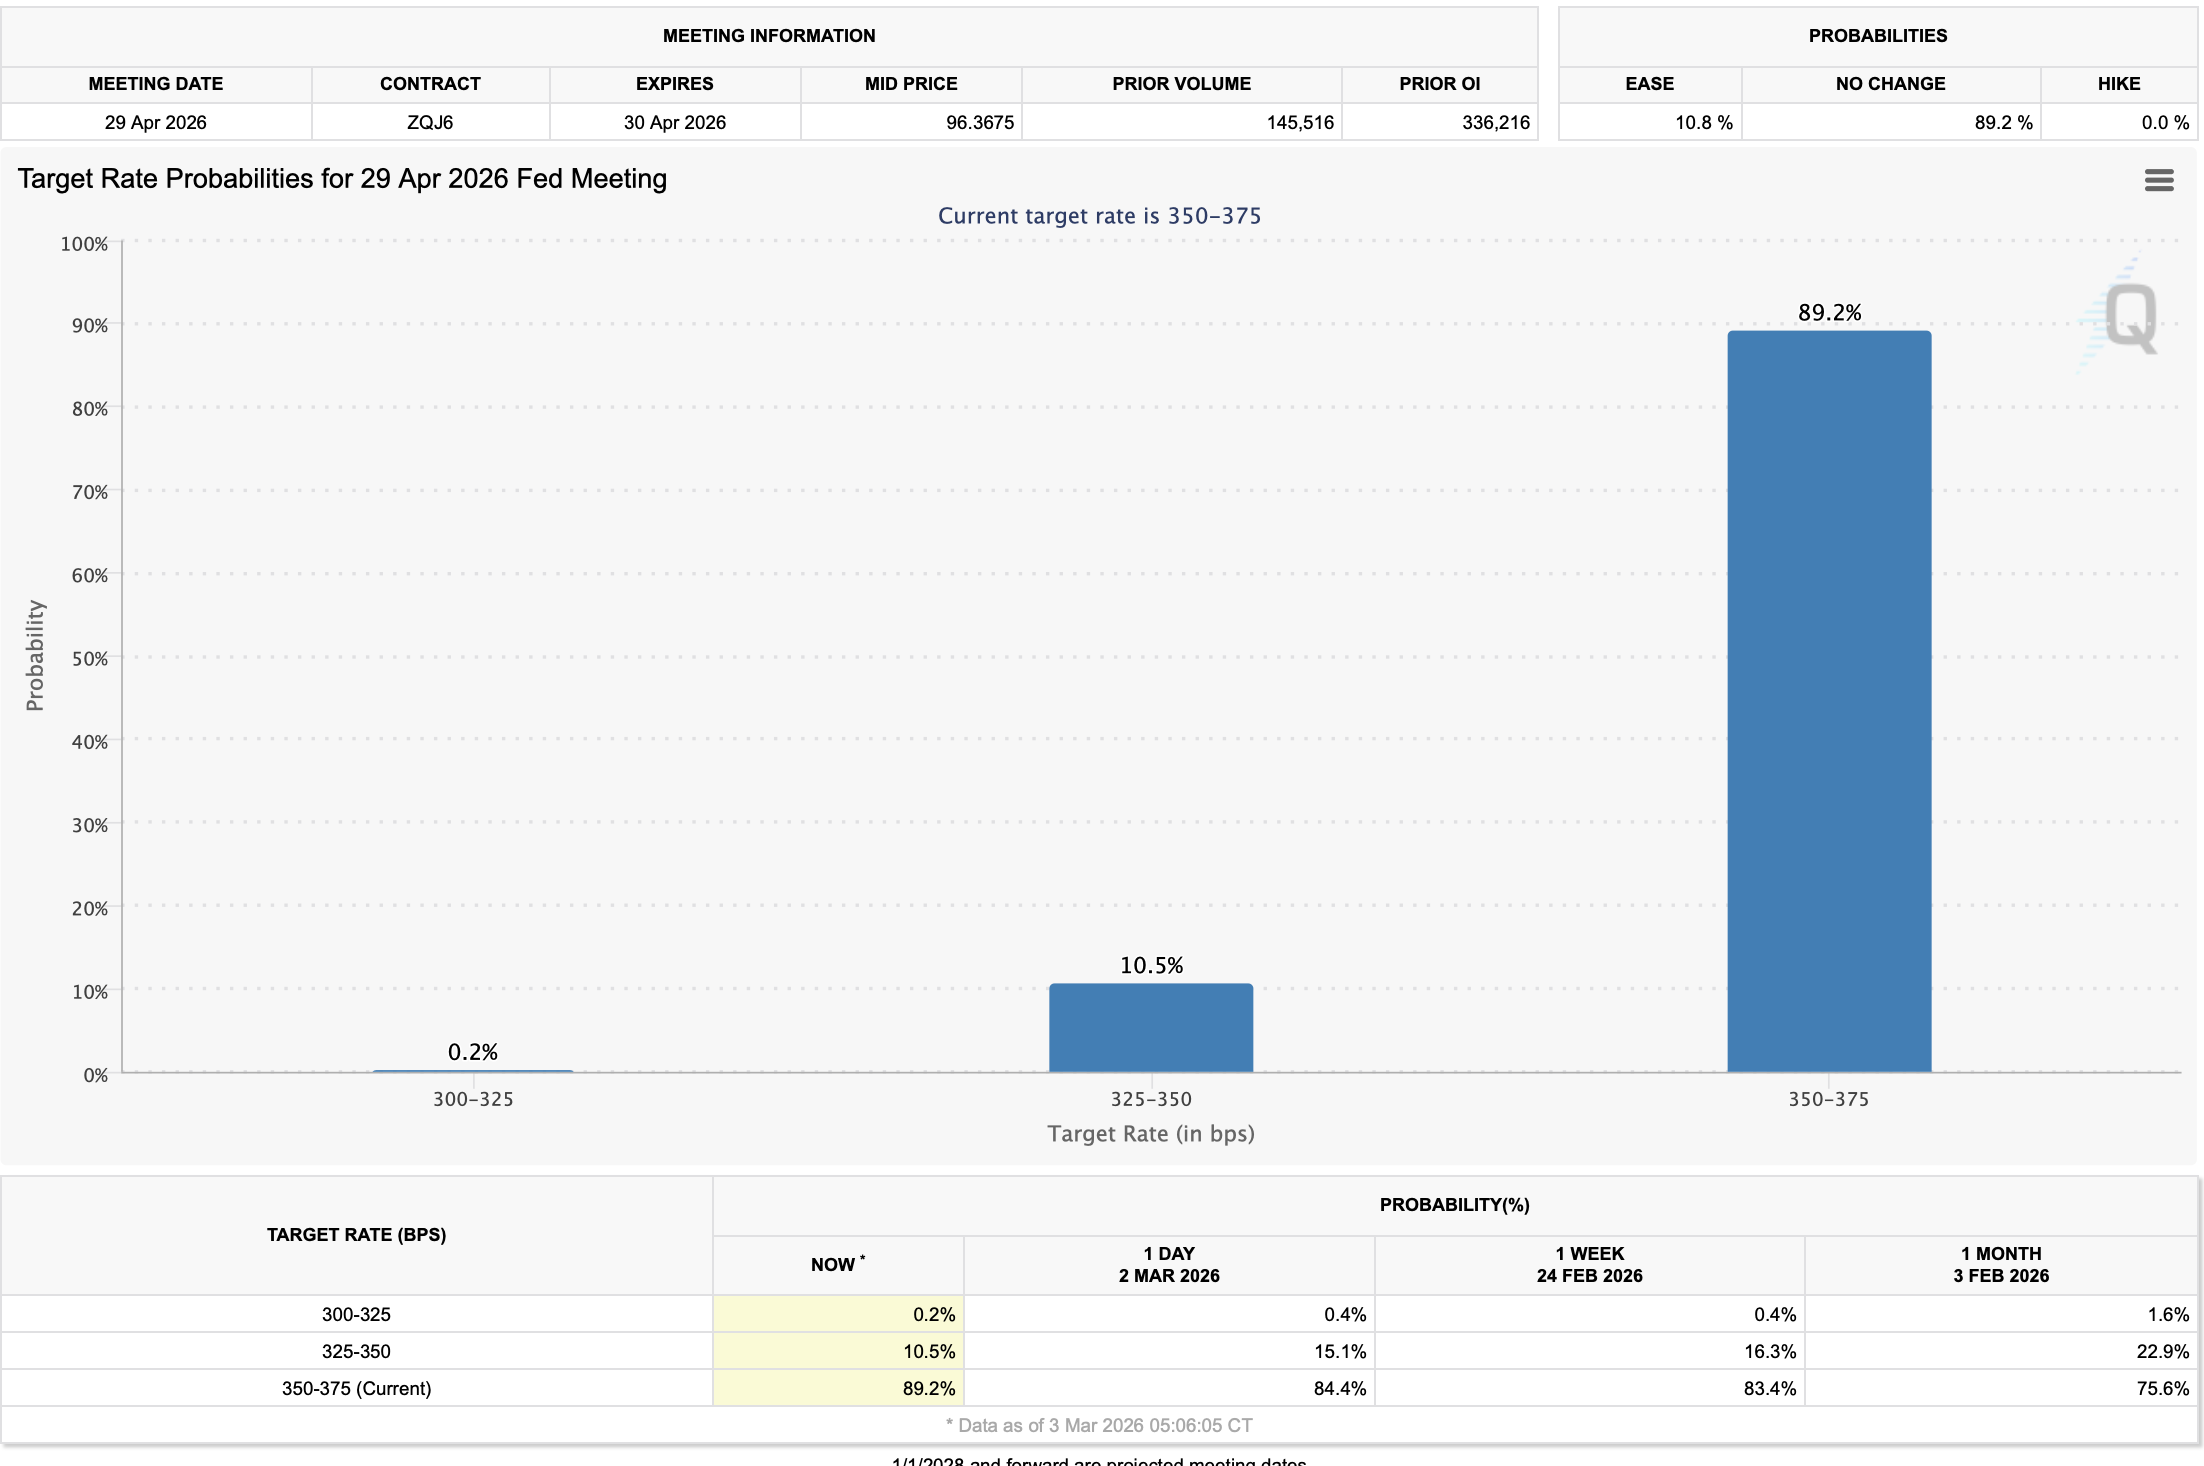
Additionally, traders are pricing in increased market risk and lowering expectations for a rate cut by the US Fed. According to the FedWatch tool, the market estimates a 89% chance of the Fed keeping rates unchanged at the 3.50%-3.75% range at the April 29 meeting. The lack of rate-cut headwinds could cap Bitcoin's upside as Gold remains the market’s preferred safe haven.
However, to limit downside risk, a 21Shares report suggests that institutional demand remains crucial. The US spot Bitcoin Exchange Traded Funds (ETFs) continue to expand holdings despite the price correction, totaling 1.27 million BTC as of Monday. Consistent and increased inflows from ETFs, alongside corporate treasuries such as Strategy and Metaplanet, could absorb the supply pressure.

超過一百萬用戶依賴 FXStreet 獲取即時市場數據、圖表工具、專家洞見與外匯新聞。其全面的經濟日曆與教育網路研討會協助交易者保持資訊領先、做出審慎決策。FXStreet 擁有約 60 人的團隊,分布於巴塞隆納總部及全球各地。
閱讀更多


