
Bitcoin Price Forecast: BTC advances with caution as uncertainty around Iran war weighs on demand
作者 Manish Chhetri
更新: 31 Mar 2026


熱門文章

Bitcoin (BTC) price is trading near $67,000 at the time of writing on Tuesday, extending its recovery after rebounding from a key technical level the previous day. Institutional demand supports a mild improvement as spot Exchange Traded Funds (ETFs) show modest flow.
- Bitcoin extends recovery cautiously on Tuesday after finding support around a key technical level the previous day.
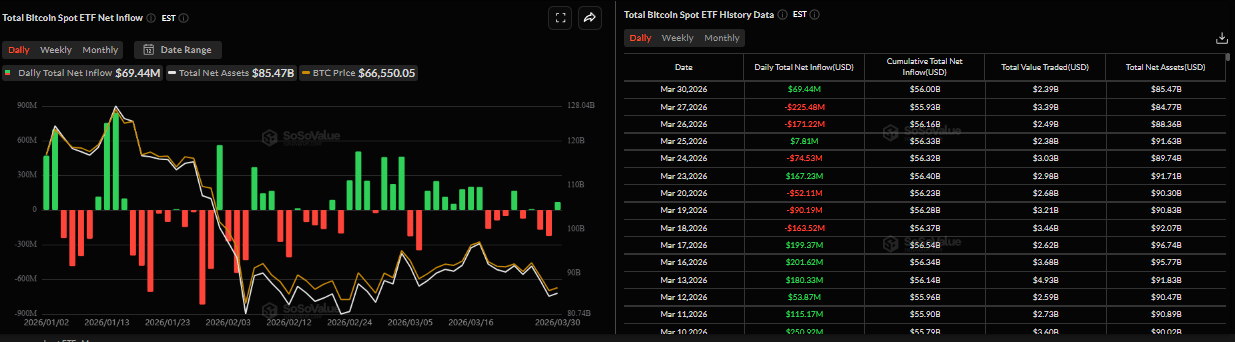
- US-listed spot ETFs recorded a mild inflow of $69.44 million on Monday, breaking the streak of outflows seen late last week.
- The groundwork for a potential recovery in Bitcoin is forming, though stronger demand is still required to confirm a sustained shift, analysts say.
Bitcoin (BTC) price is trading near $67,000 at the time of writing on Tuesday, extending its recovery after rebounding from a key technical level the previous day. Institutional demand supports a mild improvement as spot Exchange Traded Funds (ETFs) show modest flow. The broader market structure suggests a potential recovery in Crypto King is forming, though stronger demand is still required to confirm a sustained shift.
The Middle East war remains uncertain
On Tuesday, the news came in that the US President Donald Trump is willing to end the war with Iran despite the Strait of Hormuz remaining closed, as Washington doesn’t intend to stretch the military mission beyond his timeline of four to six weeks. Trump said that he will pursue a diplomatic way to reopen waterways.
However, market sentiment remains cautious, with investors still gripped by fears of persistently high Oil prices. West Texas Intermediate (WTI) hit a daily high of $103.41 during the early Asian session before a mild pullback in the European trading session.
Despite some optimism about a potential resolution to the month-long Middle East war, concerns about inflationary pressures continue to weigh on risk appetite across markets, with BTC trading around $67,000 on Tuesday.
Traders should be cautious, as uncertainty surrounding a peace deal persists, and any negative developments or further escalation would add upward pressure on global inflation, potentially leading to tighter monetary conditions and risk aversion, which does not bode well for Bitcoin’s price.
Institutional demand shows modest inflow
Institutional demand started the week on a slight positive note. SoSoValue data shows that Bitcoin spot ETFs recorded a mild inflow of $69.44 million on Monday after two straight days of withdrawals last week. Traders should remain vigilant, as these inflows are modest and not strong enough to fuel the BTC recovery, which suggests investors are not willing to increase their exposure to BTC amid the ongoing war. For the recovery to be sustained, the institutional demands must continue and intensify.
Bitcoin recovery builds, but conviction lacks
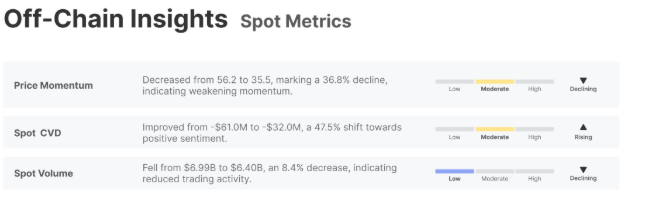
Glassnode’s weekly report on Monday highlighted that the current market appears to be transitioning from active distribution towards a more neutral footing.
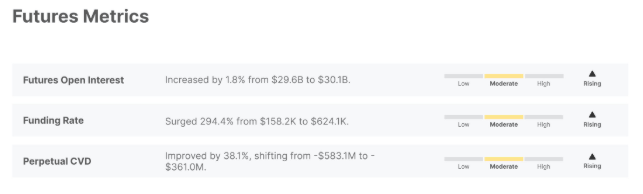
The report further explains that spot markets reflect this cooling tone, with trading volume declining and activity remaining subdued. On the derivatives side, positioning points to a more balanced but cautious backdrop. Futures Open Interest (OI) edged higher, while funding rates firmed, indicating a tilt towards long exposure, as shown in the chart below.
“While conditions remain fragile, easing sell-side pressure and stabilising flows suggest the groundwork for a potential recovery is forming, though stronger demand is still required to confirm a sustained shift,” concluded Glassnode’s analyst.
Bitcoin Price Forecast: BTC finds support at key level
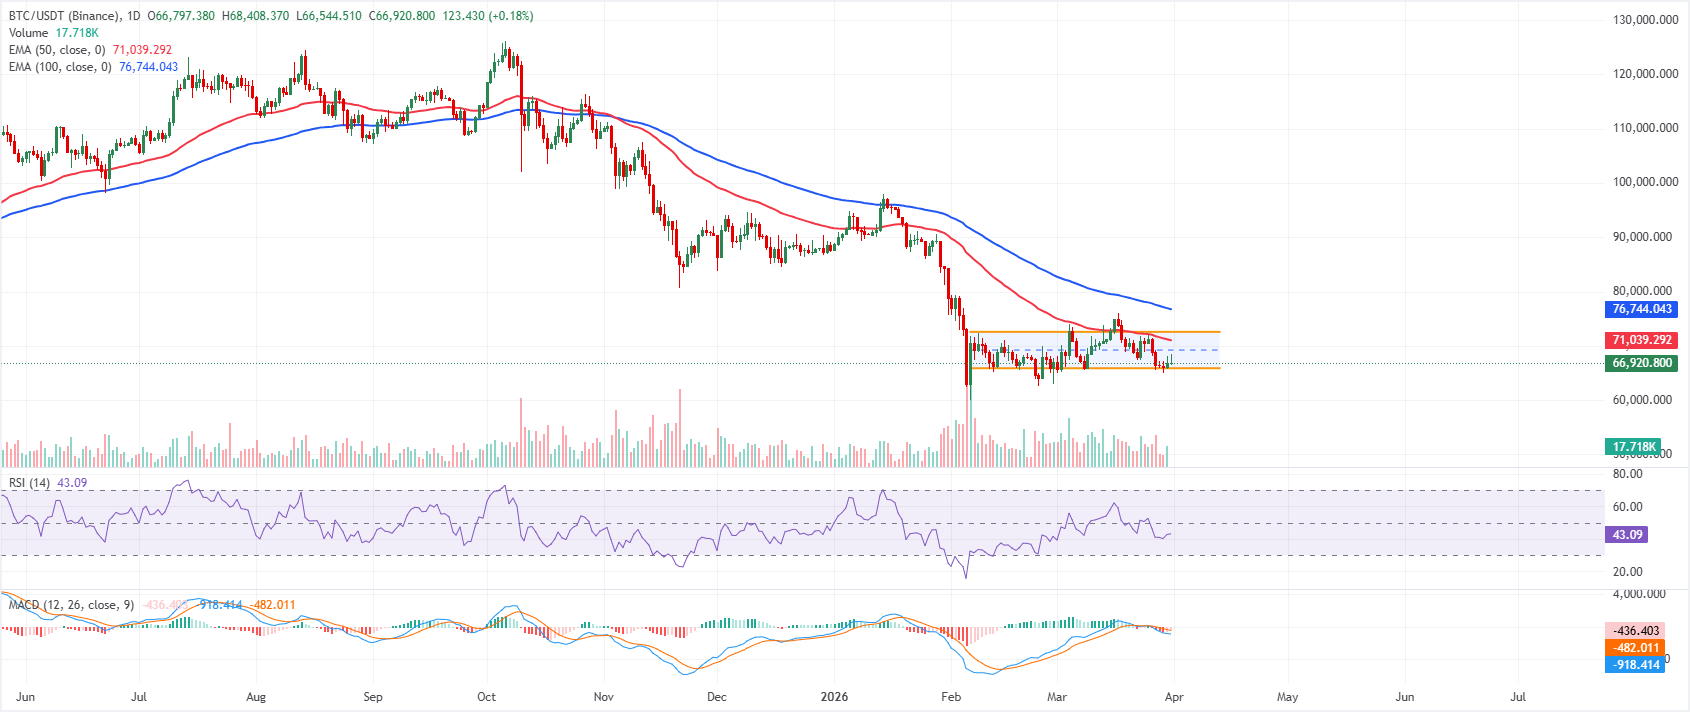
Bitcoin price is trading near $67,000 on Tuesday after a slight recovery, retesting the lower boundary of a horizontal channel near $65,900 the previous day. The near-term bias is mildly bearish as price holds within a parallel channel and trades near the lower boundary, keeping downside pressure in focus. The 50-day and 100-day Exponential Moving Averages around $71,000 and $76,700, respectively, remain well above spot, underscoring a corrective phase within a broader uptrend.
Momentum also leans negative, with the Relative Strength Index (RSI) at 43 drifting below the 50 midline on the daily chart, while the Moving Average Convergence Divergence (MACD) indicator stays below the signal line and has slipped into negative territory, suggesting persistent selling pressure.
Immediate support emerges at the channel floor close to $65,900, and a clear break below this area would open the way toward secondary downside levels around $64,000.
On the upside, resistance emerges near the mid-point of the channel around $69,200, where recent rebounds have stalled, followed by the $71,000 region in line with the 50-day EMA.
A daily close above $71,000 would be needed to challenge the horizontal channel structure and expose the channel top around $72,600 as the next resistance band. Until such a recovery develops, rallies toward $69,000–$71,000 are exposed to renewed supply within the prevailing channel.
(The technical analysis of this story was written with the help of an AI tool.)
Bitcoin, altcoins, stablecoins FAQs
Bitcoin is the largest cryptocurrency by market capitalization, a virtual currency designed to serve as money. This form of payment cannot be controlled by any one person, group, or entity, which eliminates the need for third-party participation during financial transactions.
Altcoins are any cryptocurrency apart from Bitcoin, but some also regard Ethereum as a non-altcoin because it is from these two cryptocurrencies that forking happens. If this is true, then Litecoin is the first altcoin, forked from the Bitcoin protocol and, therefore, an “improved” version of it.
Stablecoins are cryptocurrencies designed to have a stable price, with their value backed by a reserve of the asset it represents. To achieve this, the value of any one stablecoin is pegged to a commodity or financial instrument, such as the US Dollar (USD), with its supply regulated by an algorithm or demand. The main goal of stablecoins is to provide an on/off-ramp for investors willing to trade and invest in cryptocurrencies. Stablecoins also allow investors to store value since cryptocurrencies, in general, are subject to volatility.
Bitcoin dominance is the ratio of Bitcoin's market capitalization to the total market capitalization of all cryptocurrencies combined. It provides a clear picture of Bitcoin’s interest among investors. A high BTC dominance typically happens before and during a bull run, in which investors resort to investing in relatively stable and high market capitalization cryptocurrency like Bitcoin. A drop in BTC dominance usually means that investors are moving their capital and/or profits to altcoins in a quest for higher returns, which usually triggers an explosion of altcoin rallies.

超過一百萬用戶依賴 FXStreet 獲取即時市場數據、圖表工具、專家洞見與外匯新聞。其全面的經濟日曆與教育網路研討會協助交易者保持資訊領先、做出審慎決策。FXStreet 擁有約 60 人的團隊,分布於巴塞隆納總部及全球各地。
閱讀更多


