

Bitcoin Price Forecast: BTC approaches technical pivot as soft US CPI aids recovery
- Bitcoin trades near the 50-day EMA at $65,160 on Wednesday, a key technical level that, if cleared, could further support gains.
- Lower-than-expected US CPI data for June supports BTC's recovery as traders price out immediate Fed interest-rate hikes.
- Institutional demand remains mixed, with spot ETFs recording shifts in flows so far this week.
Bitcoin (BTC) is near the key technical resistance zone around $65,160 on Wednesday as softer-than-expected US inflation data improves risk sentiment across the crypto market. The June Consumer Price Index (CPI) report on Tuesday reinforced expectations that the Federal Reserve (Fed) is unlikely to resume interest-rate hikes in the near term, providing support for the Crypto King. However, institutional demand remains mixed, with spot Bitcoin Exchange Traded Funds (ETFs) continuing to see fluctuating flows, leaving the 50-day Exponential Moving Average (EMA) as the next key technical hurdle for BTC.

Soft US CPI supports BTC recovery
The US Bureau of Labor Statistics reported on Tuesday that the headline CPI declined 0.4% in June, marking the largest one-month decrease since April 2020 and missing expectations of a 0.1% fall. Furthermore, the core gauge, which strips out volatile food and energy prices, was flat in June, compared to a 0.2% consensus estimate. On a yearly basis, the headline and the core CPI decelerated to 3.5% and 2.6%, respectively, also missing forecasts.
The data prompted traders to trim expectations of Fed rate hikes and dragged the US Dollar (USD), while supporting risky assets such as BTC, which closed Tuesday with a 4.35% gain.
However, the initial positive market reaction faded following comments by Fed Chair Kevin Warsh that the central bank had no tolerance for persistently high inflation, while also touting the strength of the US economy.
"If we get policy right - and we will- the inflation surge of the last five years will be a thing of the past," Warsh added.
Meanwhile, traders should remain cautious, as the recent rise in crude Oil prices, driven by renewed tensions between the US and Iran and the closure of the Strait of Hormuz, poses a direct inflation risk and supports the case for further Fed tightening, which could weigh on BTC.
As of Wednesday, BTC investors await the US Producer Price Index (PPI) data for June, which could offer additional clues about the Fed's monetary policy path and trigger fresh volatility across risk-sensitive assets.
Mixed flows sign indecision among insitutions
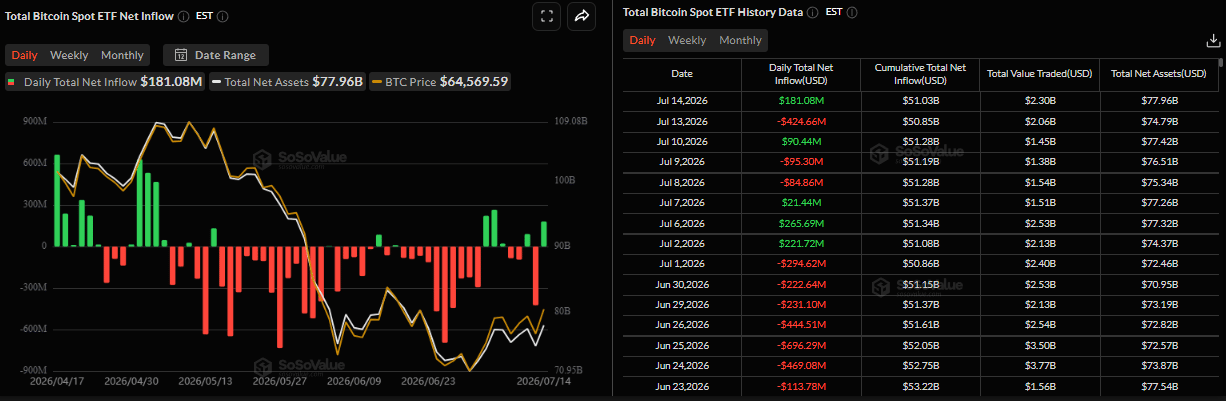
Institutional demand for Bitcoin remained mixed so far this week. SoSoValue data showed that the spot ETF recorded an inflow of $181.08 million on Tuesday following an outflow of $424.66 million the previous day. This indicates that institutional investors remain cautious and indecisive amid the ongoing US-Iran tensions and fail to provide a directional bias for BTC.
Bitcoin Price Forecast: BTC could extend rebound if it closes above 50-day EMA
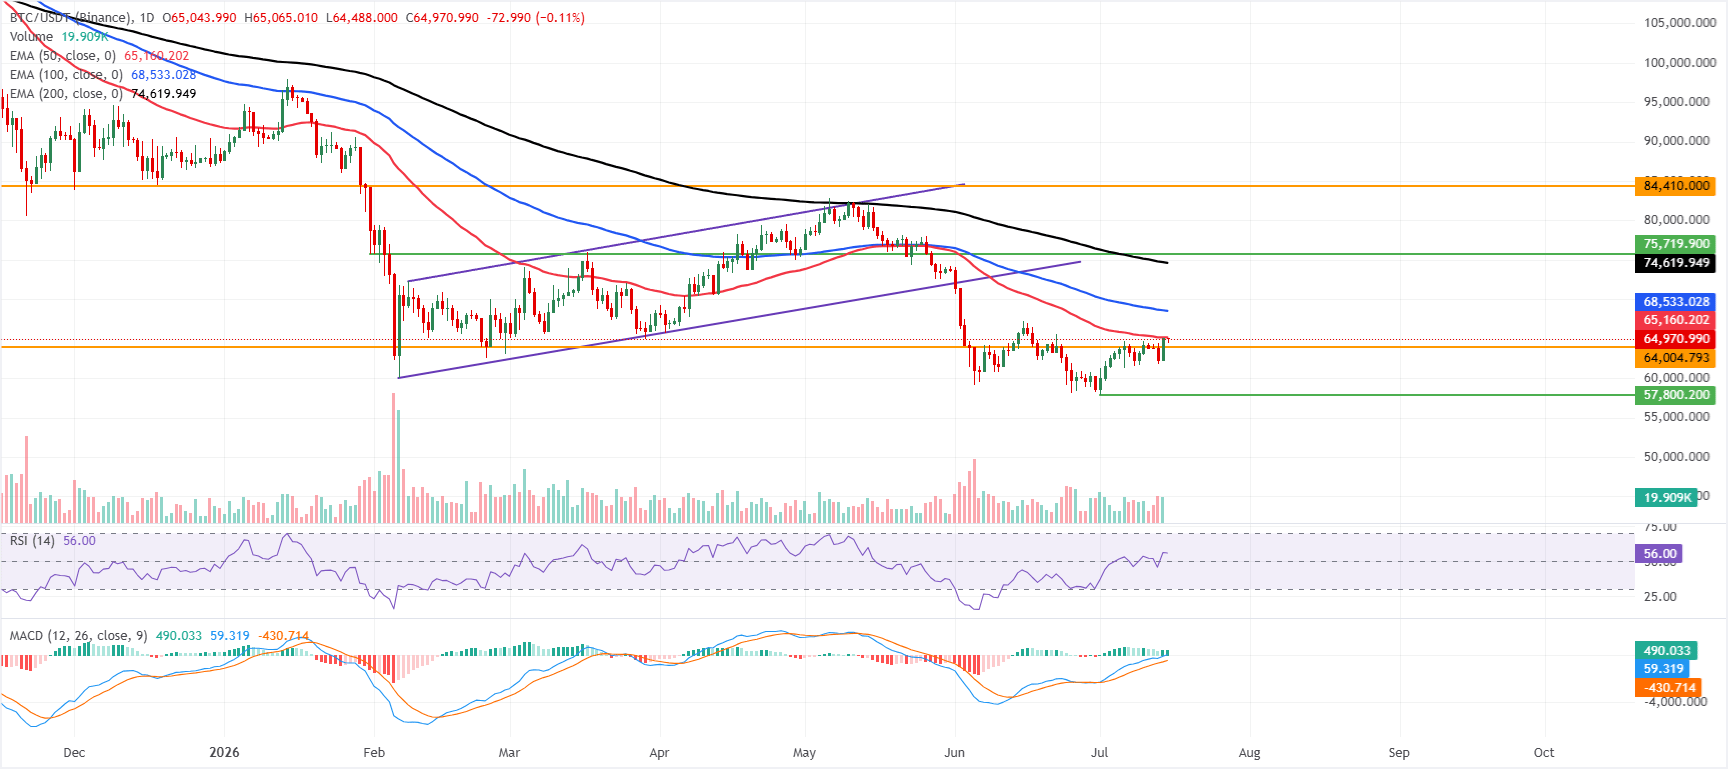
Bitcoin price trades at $64,970 at the time of writing on Wednesday after gaining over 4% and closing above the $64,000 resistance level the previous day. Despite this rebound, BTC maintains a cautious tone, remaining below the 50-day, 100-day, and 200-day Exponential Moving Averages (EMAs) at $65,160, $68,533, and $74,619, respectively. This configuration suggests the broader trend is still under downside pressure even though momentum is stabilizing, with the Relative Strength Index (RSI) at 56 on the daily chart hinting at mildly positive traction and the Moving Average Convergence Divergence (MACD) holding in positive territory, which could help limit immediate losses rather than trigger a decisive bullish reversal.
On the downside, initial support is seen near $64,004, where buyers may defend the recent base.
On the topside, immediate resistance comes at the 50-day EMA around $65,160, followed by the 100-day EMA at $68,533 and the 200-day EMA near $74,619. Only a sustained break above these stacked dynamic barriers would ease the current bearish bias, with a more distant hurdle at the prior horizontal support, now turned resistance, around $84,410.
(The technical analysis of this story was written with the help of an AI tool. Know more.)
Bitcoin, altcoins, stablecoins FAQs
Bitcoin is the largest cryptocurrency by market capitalization, a virtual currency designed to serve as money. This form of payment cannot be controlled by any one person, group, or entity, which eliminates the need for third-party participation during financial transactions.
Altcoins are any cryptocurrency apart from Bitcoin, but some also regard Ethereum as a non-altcoin because it is from these two cryptocurrencies that forking happens. If this is true, then Litecoin is the first altcoin, forked from the Bitcoin protocol and, therefore, an “improved” version of it.
Stablecoins are cryptocurrencies designed to have a stable price, with their value backed by a reserve of the asset it represents. To achieve this, the value of any one stablecoin is pegged to a commodity or financial instrument, such as the US Dollar (USD), with its supply regulated by an algorithm or demand. The main goal of stablecoins is to provide an on/off-ramp for investors willing to trade and invest in cryptocurrencies. Stablecoins also allow investors to store value since cryptocurrencies, in general, are subject to volatility.
Bitcoin dominance is the ratio of Bitcoin's market capitalization to the total market capitalization of all cryptocurrencies combined. It provides a clear picture of Bitcoin’s interest among investors. A high BTC dominance typically happens before and during a bull run, in which investors resort to investing in relatively stable and high market capitalization cryptocurrency like Bitcoin. A drop in BTC dominance usually means that investors are moving their capital and/or profits to altcoins in a quest for higher returns, which usually triggers an explosion of altcoin rallies.














