
Bitcoin Price Forecast: BTC extends gains as ETF inflows persist despite broadening US-Iran war
作者 Vishal Dixit
更新: 5 Mar 2026


熱門文章

Bitcoin (BTC) crosses above $73,000 at press time on Thursday, extending gains after weeks of consolidation below $70,000, driven by the US Stock market recovery.
- Bitcoin hovers around $73,000 on Thursday, driven by the US Stock market recovery, boosting risk-on sentiment.
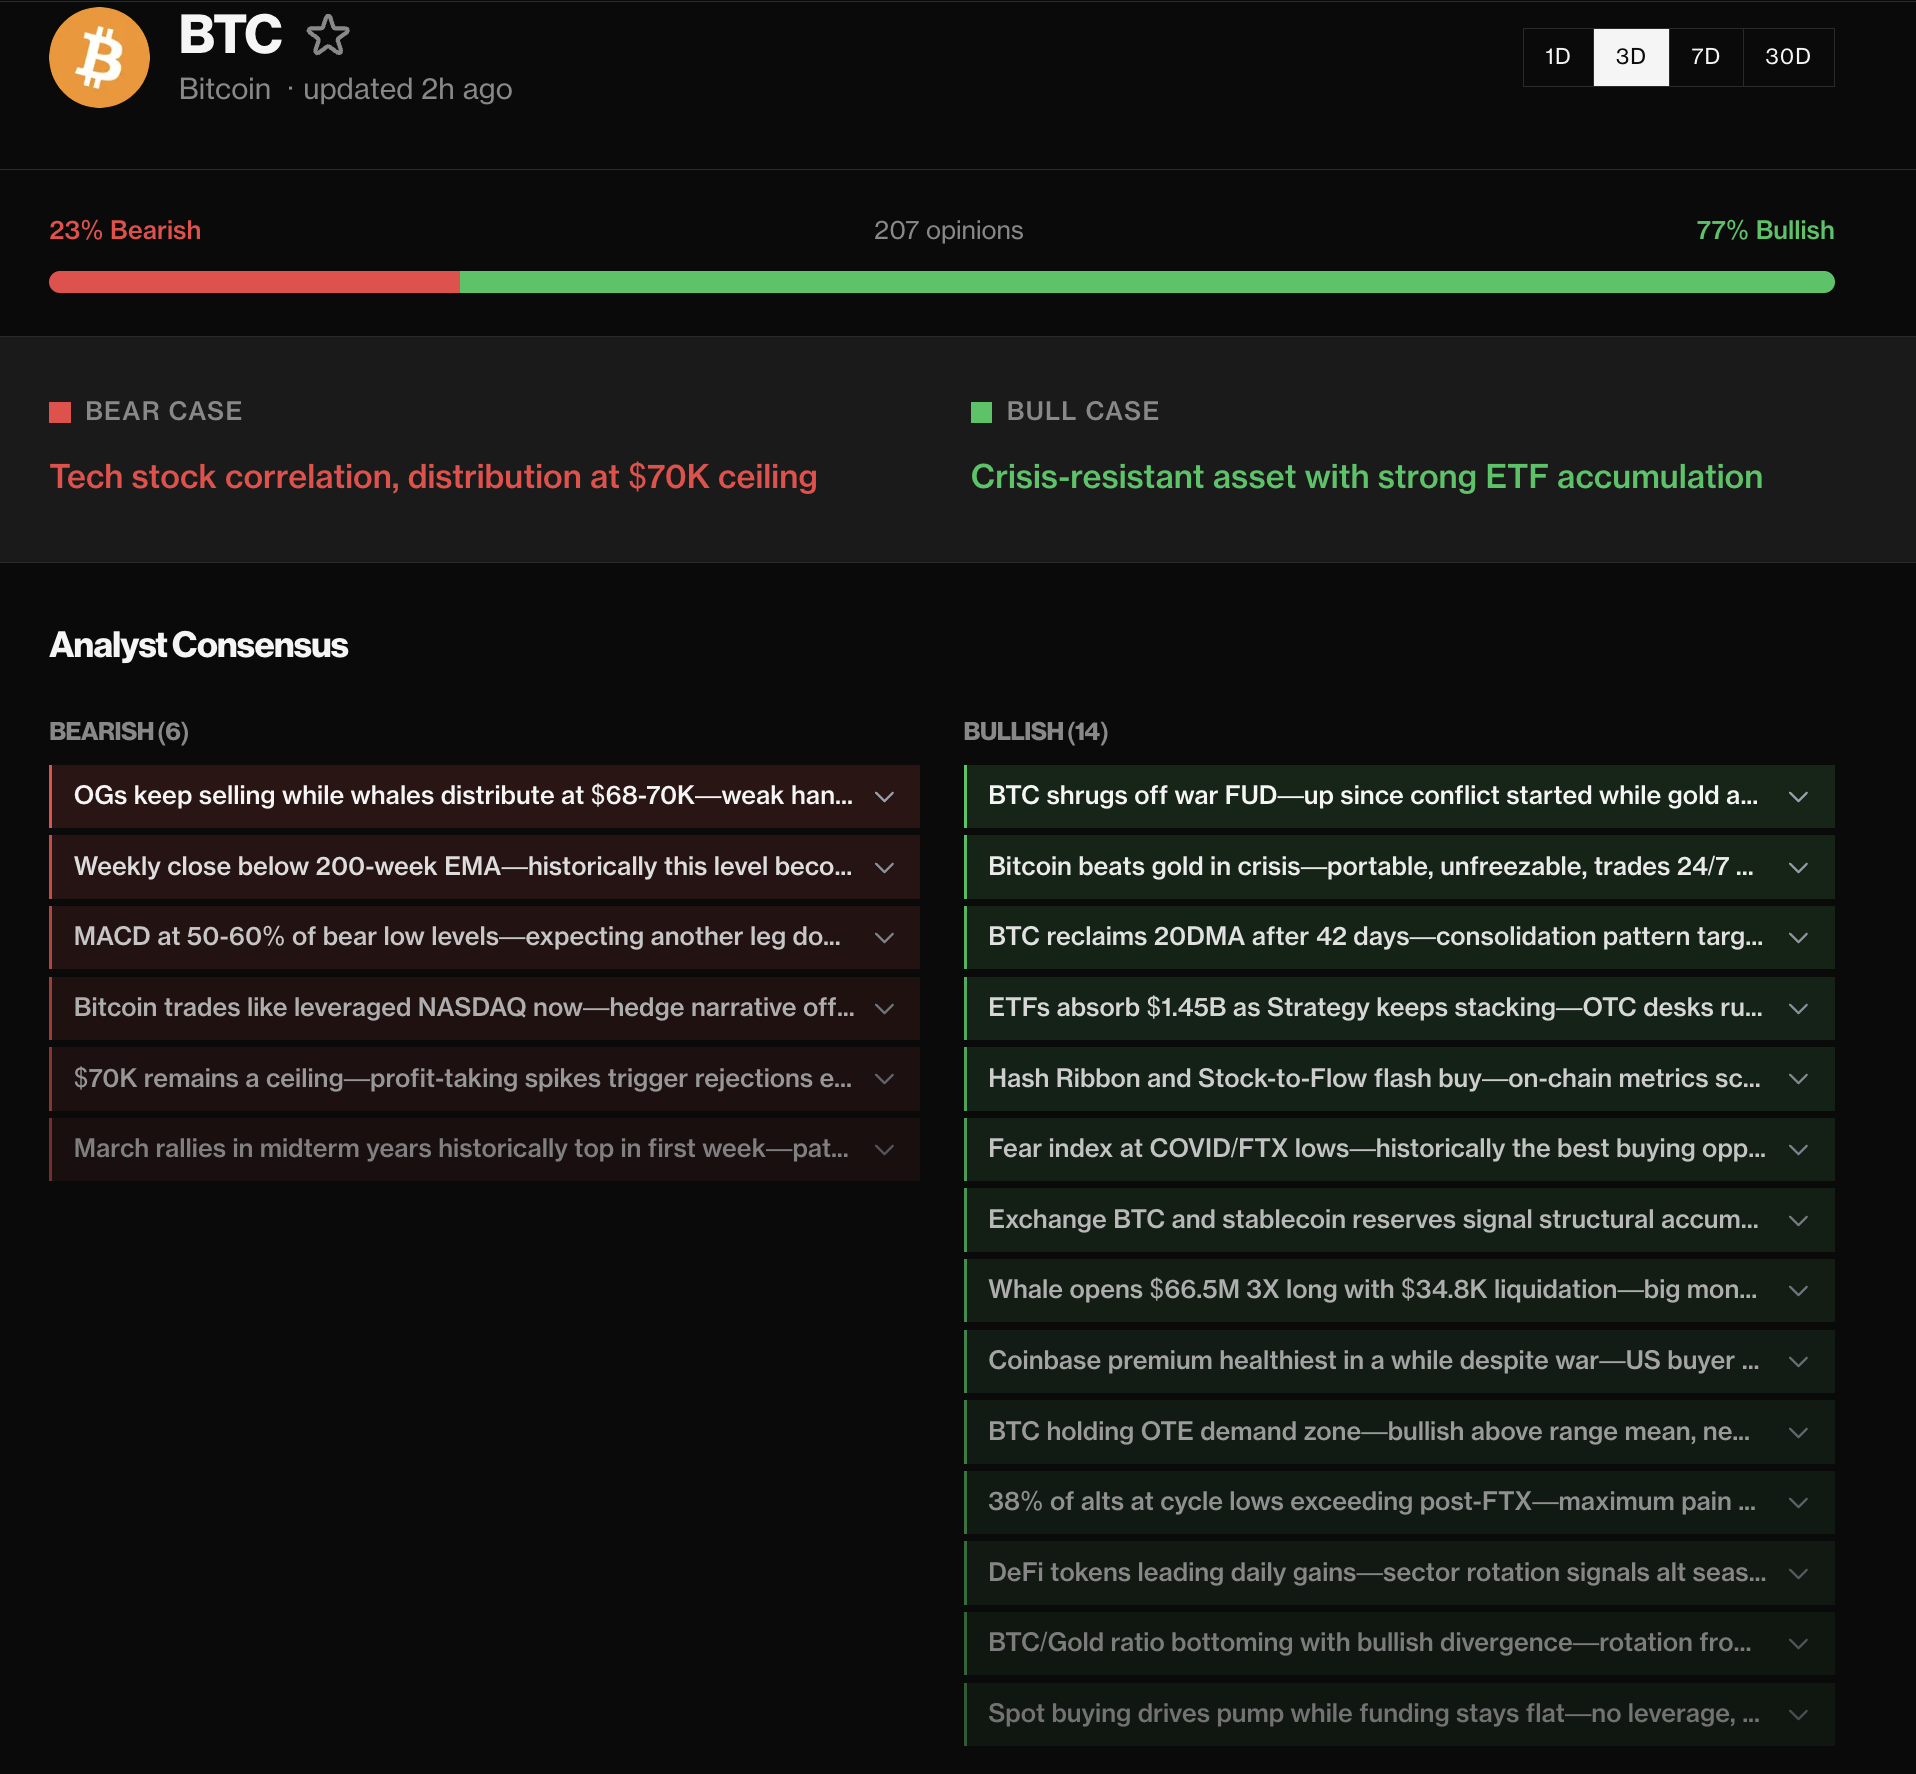
- Data shows analysts are mostly bullish on Bitcoin, citing renewed demand from institutional investors, on-chain holders, and the derivatives market.
- The 50-day EMA at $74,409 emerges as the immediate resistance level.
Bitcoin (BTC) crosses above $73,000 at press time on Thursday, extending gains after weeks of consolidation below $70,000, driven by the US Stock market recovery. Analysts hold an optimistic outlook for Bitcoin, based on over $1 billion in inflows collected by US spot Bitcoin Exchange Traded Funds (ETFs) so far this week, which lifted risk-on sentiment across on-chain and derivatives markets. The technical outlook for BTC focuses on the sloping 50-day Exponential Moving Average (EMA) at $74,409 as the immediate resistance.
Strong demand in US markets fuels Bitcoin recovery
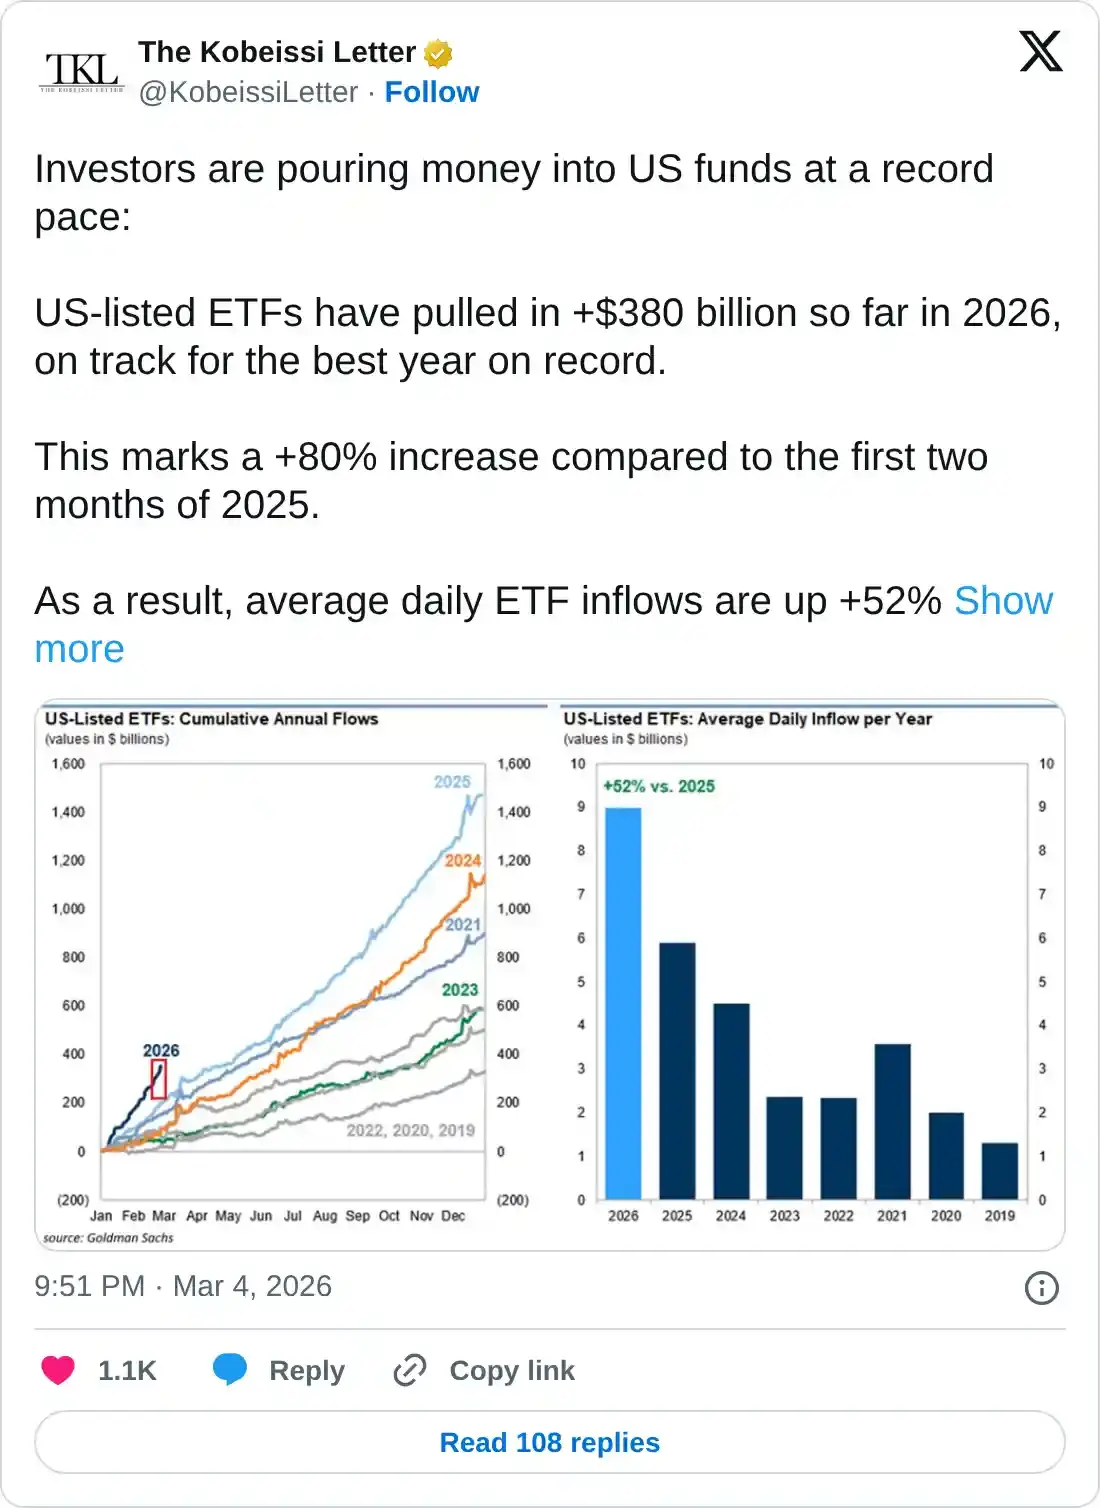
The US-Iran war enters its sixth day with no signs of a reduction in the aerial strikes across the Middle East. The US Stock market sustained gains on Wednesday, as the US-listed ETFs have averaged over $9 million in daily inflows so far this year, totaling more than $380 billion.
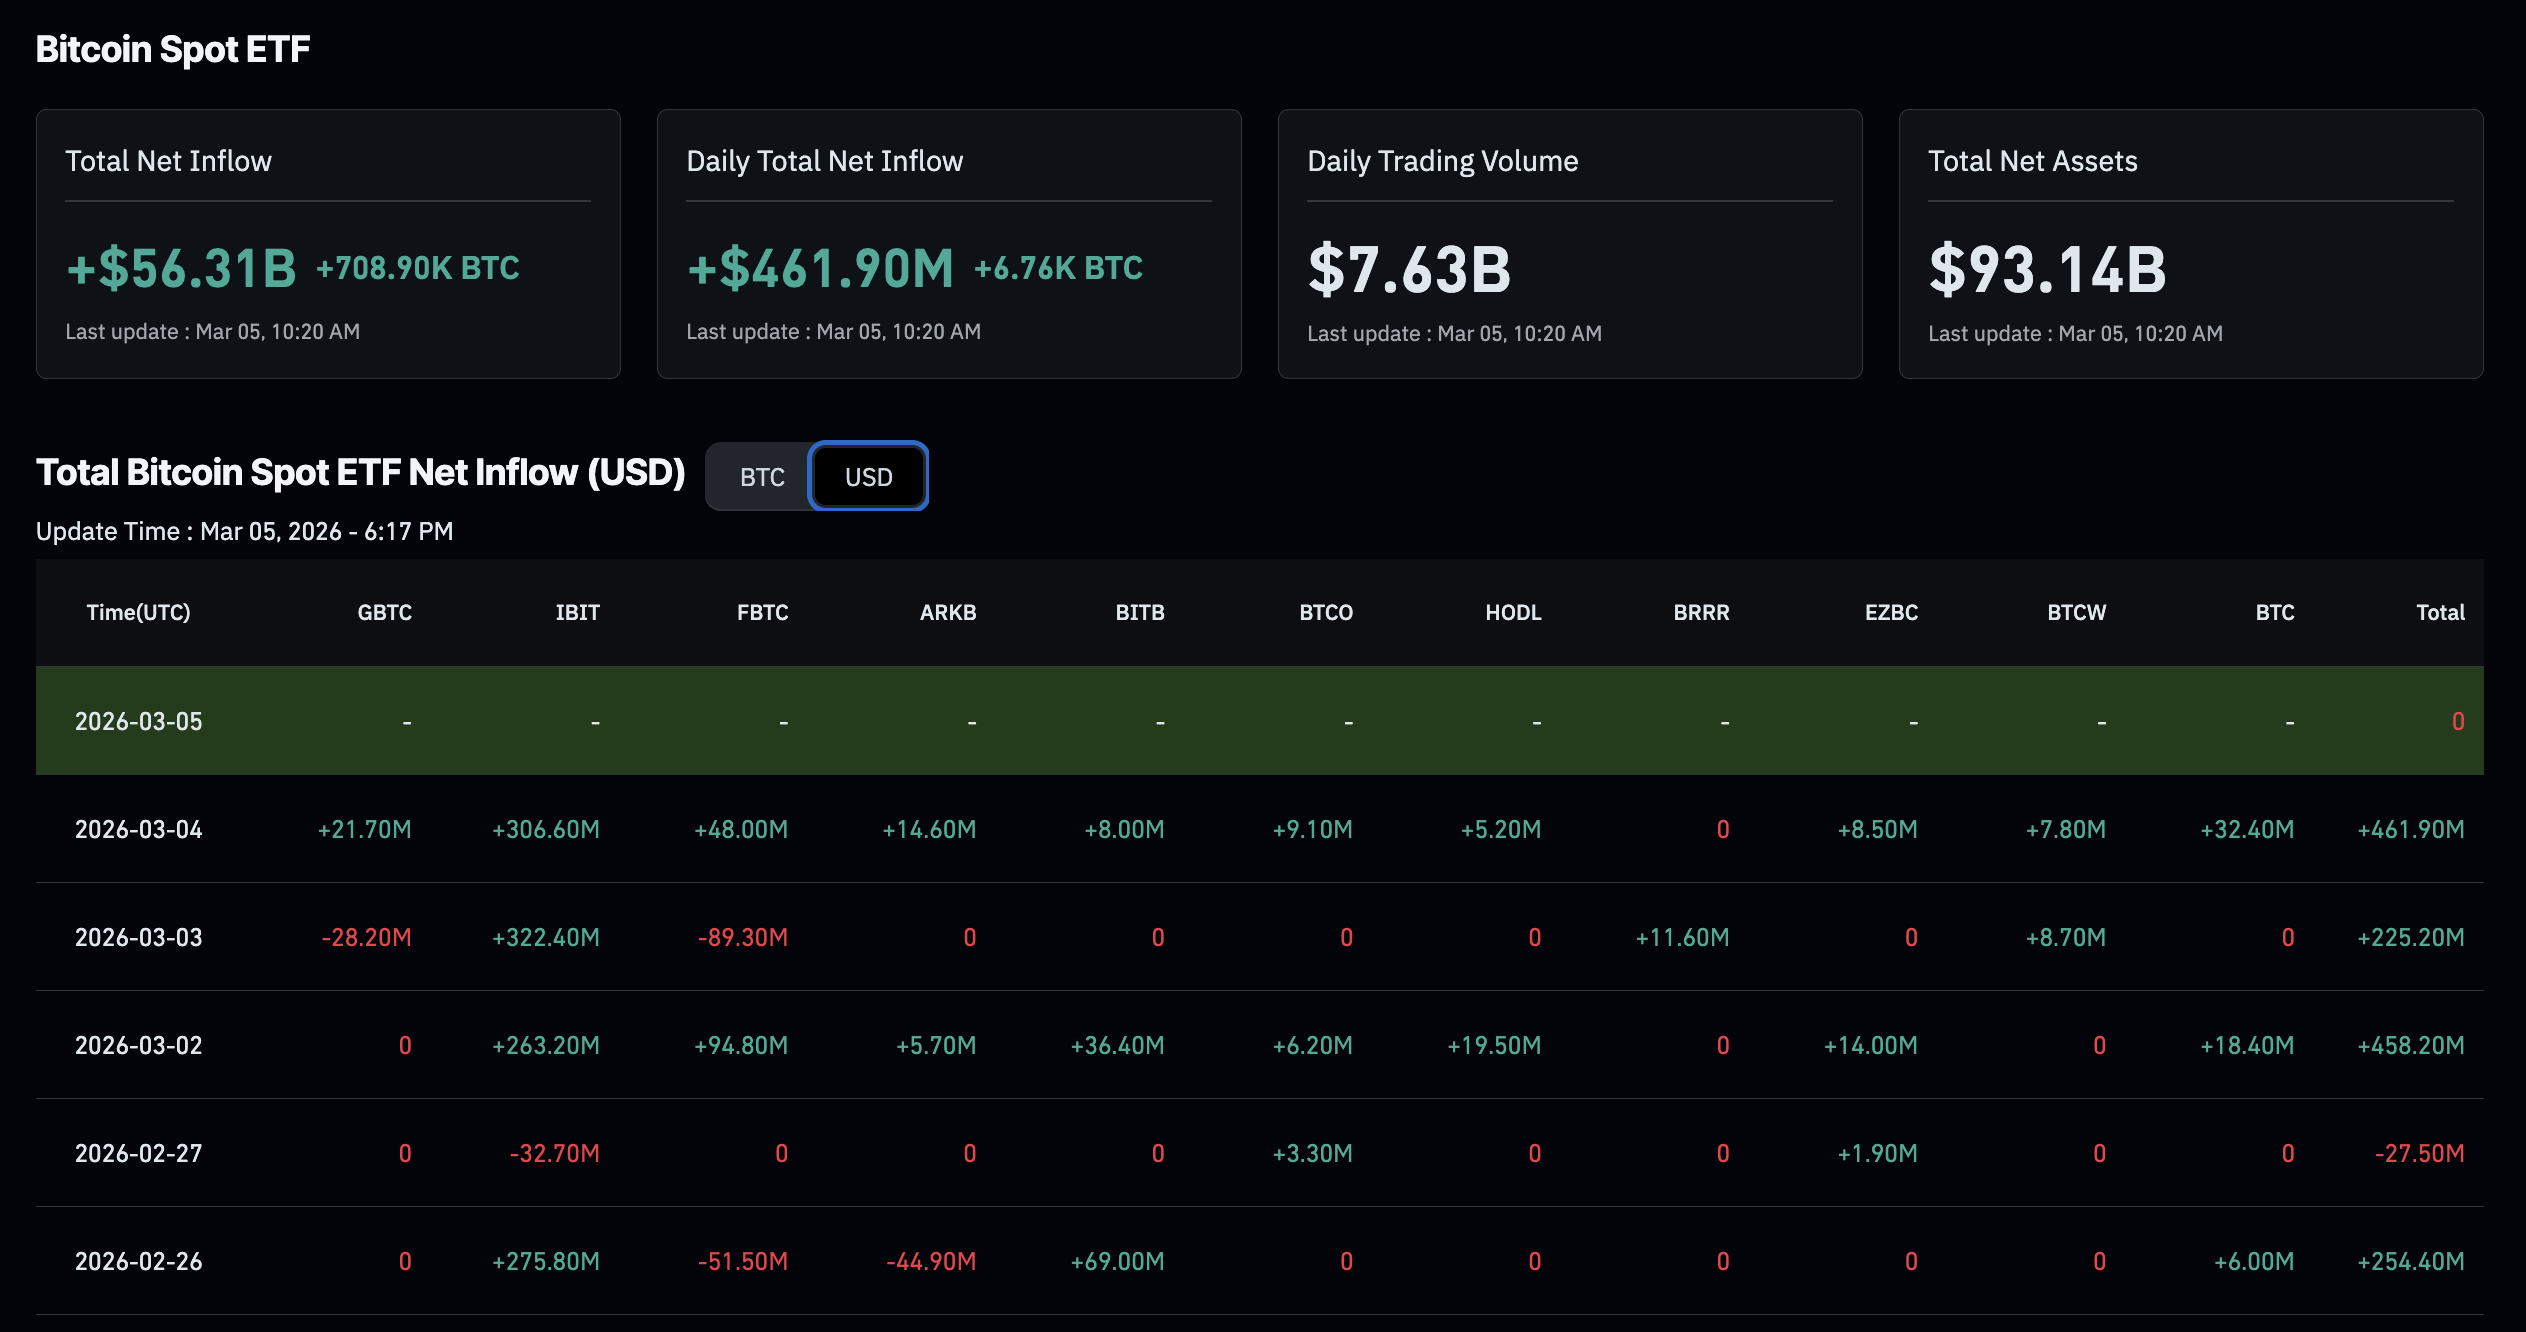
A similar demand is rising across Bitcoin ETFs, lifting the broader cryptocurrency market. The US spot BTC ETFs expanded holdings by $461.90 million on Wednesday, bringing total net assets to $93.14 billion. This inflow marked the third consecutive day of accumulation, bringing the total inflow to $1.14 billion so far this week. Typically, a boost in institutional inflows supports recovery and improves the broader market sentiment. If inflows persist through the rest of the week, Bitcoin could extend its recovery into a higher leg.
On-chain, retail demand follows the suite
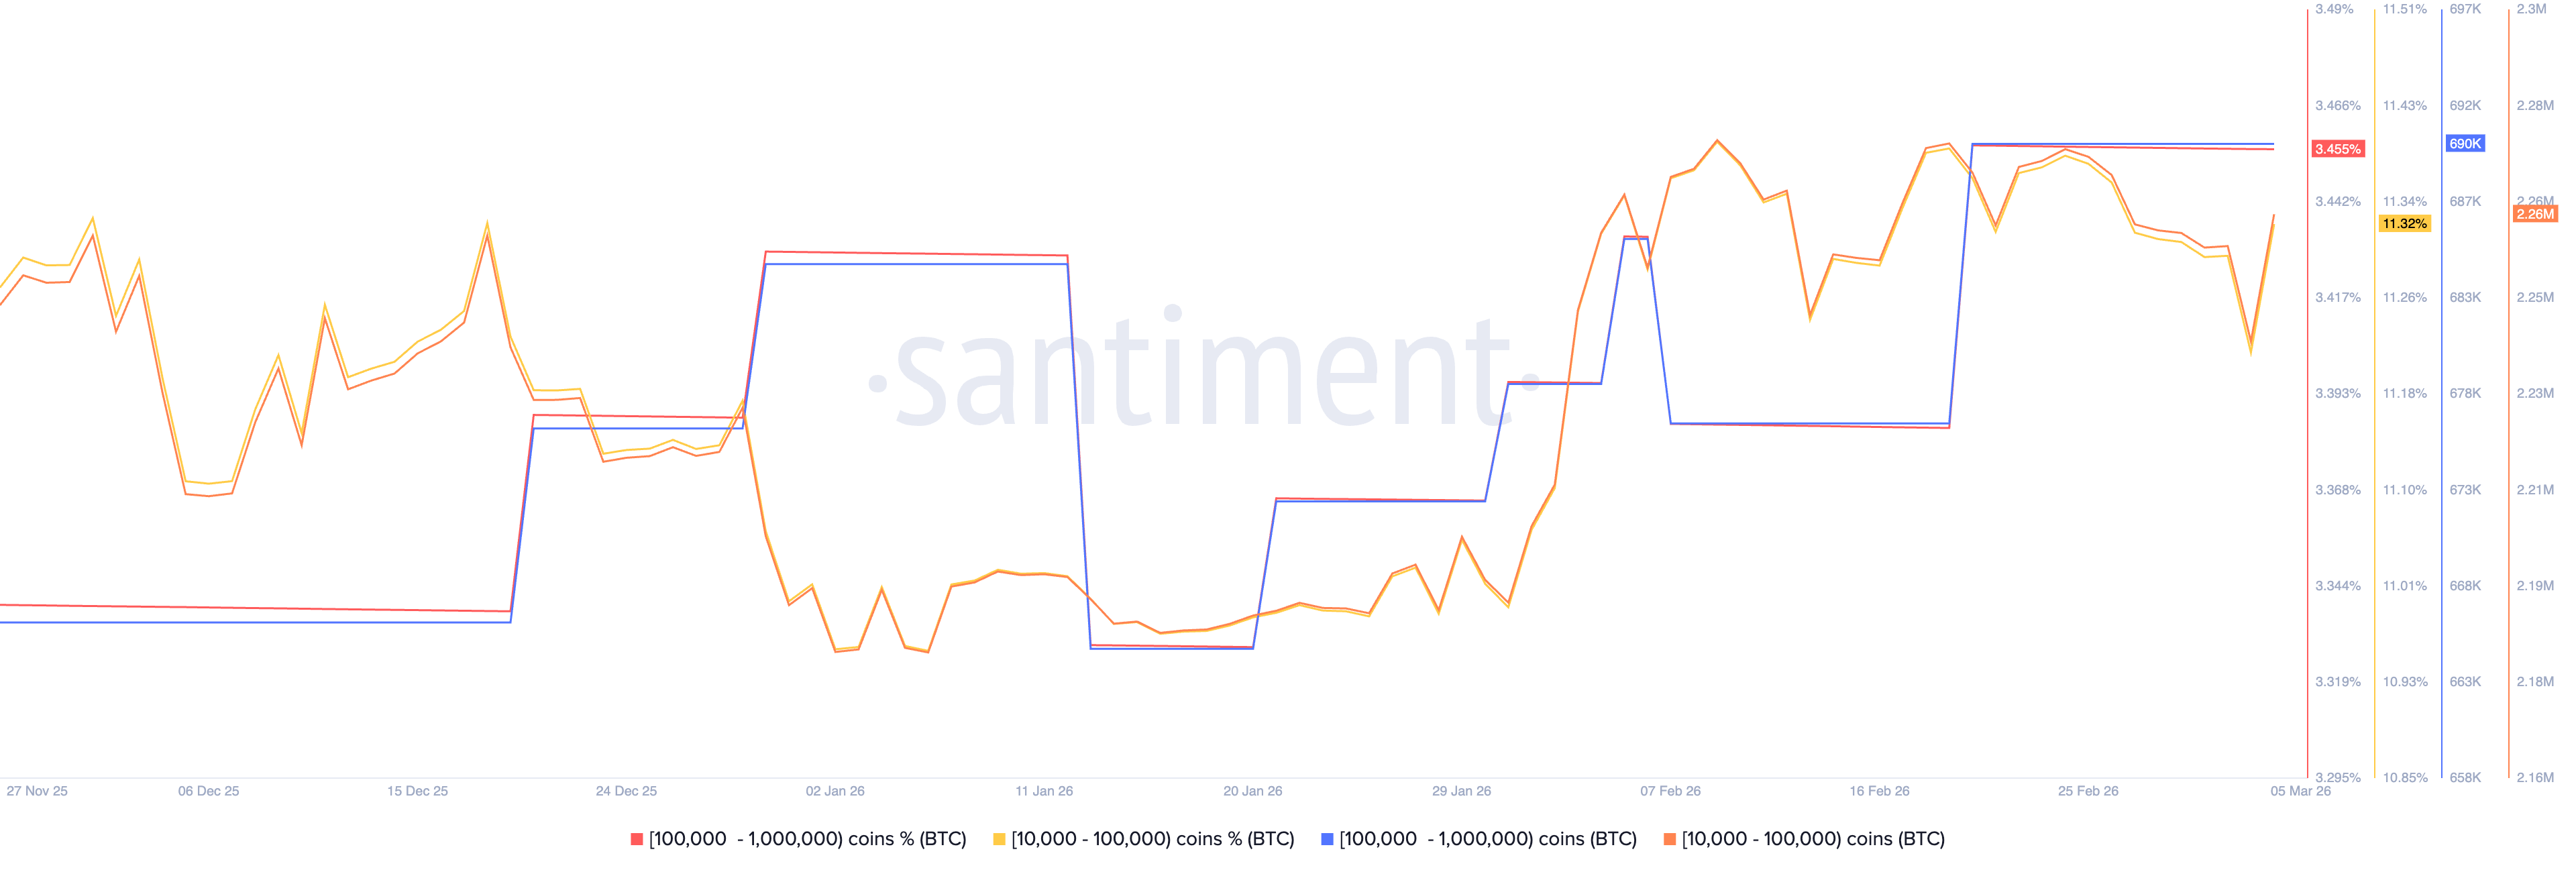
On the on-chain side, large wallet investors are expanding their holdings, mirroring the institutional moves. Santiment data shows that investors with 10,000 to 100,000 BTC hold 2.26 million BTC or 11.32% of the circulating supply, up from 2.24 million BTC on Wednesday. This suggests that cohorts with large BTC holdings, popularly known as whales, anticipate further recovery in Bitcoin.
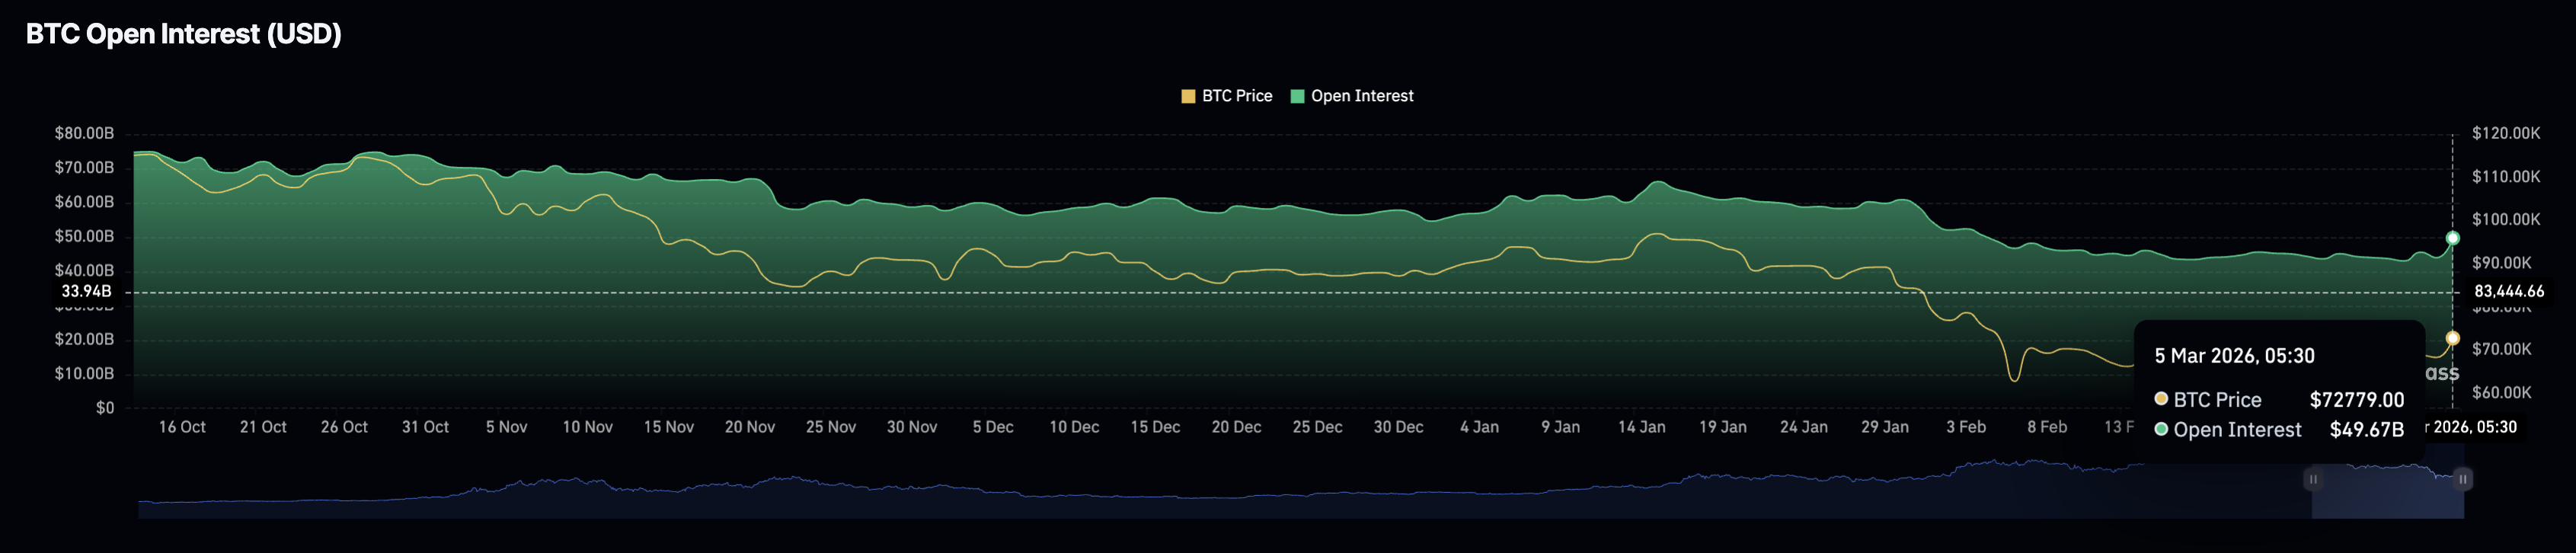
Meanwhile, the derivatives market experiences a boost in retail interest. CoinGlass data shows Bitcoin Open Interest at $49.67 billion on Thursday, up from $43.95 billion the previous day, suggesting increased leverage or positional buildup. Typically, an increase in OI during a recovery supports the upside movement.
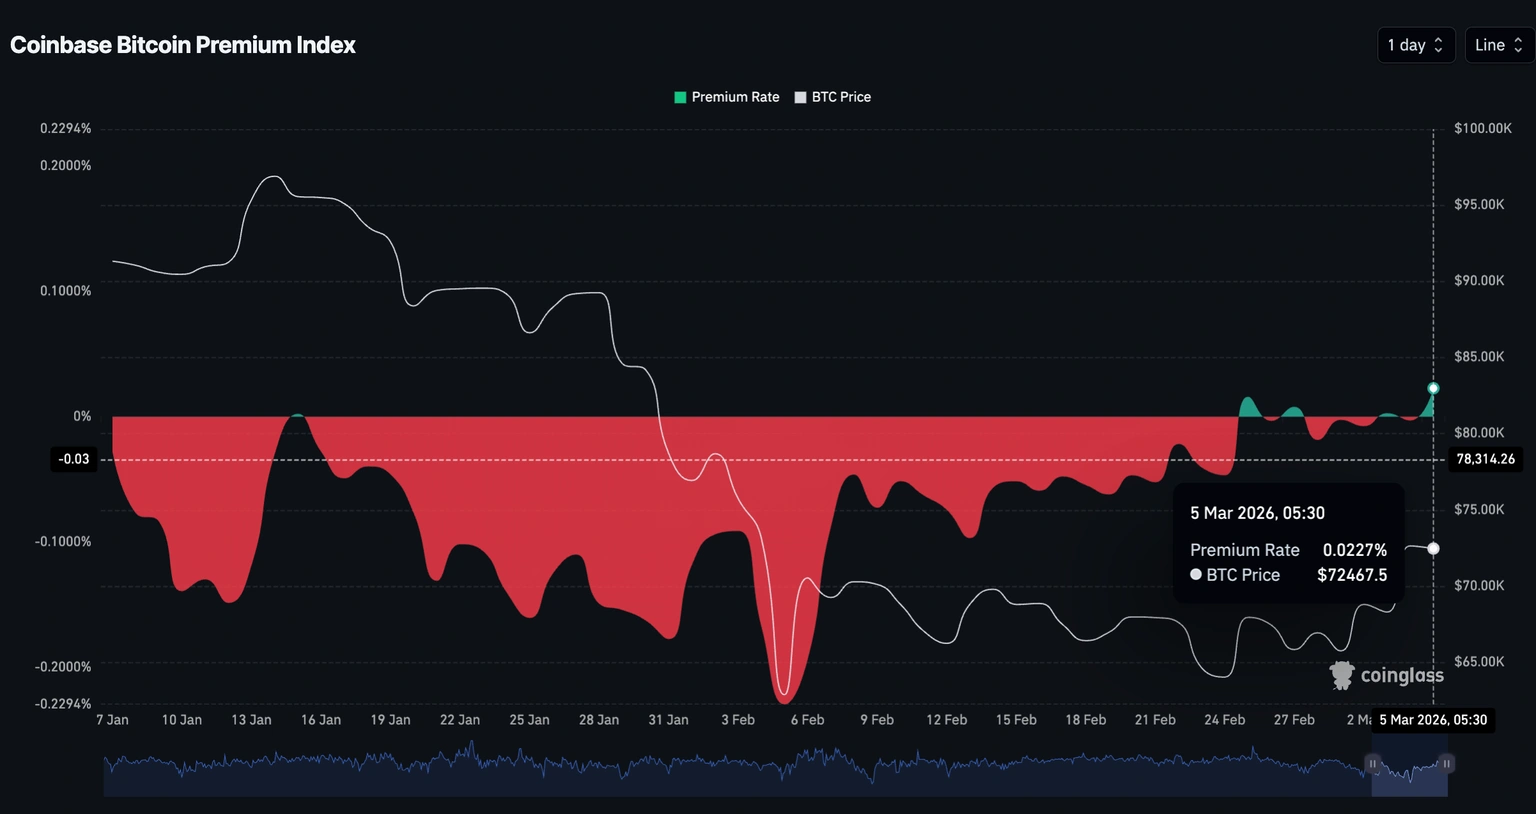
Additionally, the Coinbase premium index at 0.0227% suggests that US retail investors are willing to buy Bitcoin at a premium over the global market average, as previously reported by FXStreet.
Analysts see the Bitcoin glass half-full
Data from Unbias, which tracks top crypto analysts, shows an overall optimism in the market, projecting a 77% bullish case over the last three days based on the strong ETF accumulation. Meanwhile, the 23% bearish case highlights the Bitcoin correlation risk with US tech stocks, which saw outflows of over $388 million in February.
Technical outlook: Will Bitcoin extend gains above $75,000?
Bitcoin trades above $73,000 at press time on Thursday, extending gains after consolidating below $70,000 for roughly three weeks. The Crypto King holds a mildly bullish bias as it inches closer to the downward-sloping 50-day EMA at $74,409.
If Bitcoin clears this level, it could test the 50% trend-based Fibonacci retracement level at $78,258, measured between the October 6 high of $126,199, November 21 low at $80,600, and the January 14 high at $97,924. Beyond this, the 100-day EMA at $81,820 and the 23.6% Fibonacci retracement level at $88,092 rest as overhead resistances.
The Moving Average Convergence Divergence (MACD) rises above its signal line toward the zero line on the daily chart as positive histograms widen, suggesting rising bullish pressure. The Relative Strength Index (RSI) is at 57 on the same chart, pointing higher and indicating that buyers are regaining control.
On the flip side, if Bitcoin fails to close the day above $74,409, it would leave BTC vulnerable to consolidation. The immediate support for Bitcoin is at the $70,000 round figure, and a daily close below this level would expose downside risk to the 78.6% Fibonacci retracement level at $68,839.
(The technical analysis of this story was written with the help of an AI tool.)
Crypto ETF FAQs
An Exchange-Traded Fund (ETF) is an investment vehicle or an index that tracks the price of an underlying asset. ETFs can not only track a single asset, but a group of assets and sectors. For example, a Bitcoin ETF tracks Bitcoin’s price. ETF is a tool used by investors to gain exposure to a certain asset.
Yes. The first Bitcoin futures ETF in the US was approved by the US Securities & Exchange Commission in October 2021. A total of seven Bitcoin futures ETFs have been approved, with more than 20 still waiting for the regulator’s permission. The SEC says that the cryptocurrency industry is new and subject to manipulation, which is why it has been delaying crypto-related futures ETFs for the last few years.
Yes. The SEC approved in January 2024 the listing and trading of several Bitcoin spot Exchange-Traded Funds, opening the door to institutional capital and mainstream investors to trade the main crypto currency. The decision was hailed by the industry as a game changer.
The main advantage of crypto ETFs is the possibility of gaining exposure to a cryptocurrency without ownership, reducing the risk and cost of holding the asset. Other pros are a lower learning curve and higher security for investors since ETFs take charge of securing the underlying asset holdings. As for the main drawbacks, the main one is that as an investor you can’t have direct ownership of the asset, or, as they say in crypto, “not your keys, not your coins.” Other disadvantages are higher costs associated with holding crypto since ETFs charge fees for active management. Finally, even though investing in ETFs reduces the risk of holding an asset, price swings in the underlying cryptocurrency are likely to be reflected in the investment vehicle too.

超過一百萬用戶依賴 FXStreet 獲取即時市場數據、圖表工具、專家洞見與外匯新聞。其全面的經濟日曆與教育網路研討會協助交易者保持資訊領先、做出審慎決策。FXStreet 擁有約 60 人的團隊,分布於巴塞隆納總部及全球各地。
閱讀更多


