

Cardano Price Forecast: ADA risks over 20% downside as sellers resurface
- Cardano extends losses on Tuesday for the third consecutive day, breaking below its 50-day EMA at $0.1860.
- Holdings data of large wallet investors suggests muted demand, implying a lack of buying pressure.
- Retail demand has eased amid an 8% decline in Open Interest, and funding rates have dropped toward zero over the past 24 hours.
Cardano (ADA) price has weakened so far this week, extending its losses on Tuesday for the third straight day. Large wallet investors, commonly referred to as whales, remain on the sidelines while retail support eases with ADA futures Open Interest and funding rate plunging sharply over the last 24 hours. The technical outlook for ADA is mildly bearish amid easing bullish momentum.

Whale interest and retail speculation ease
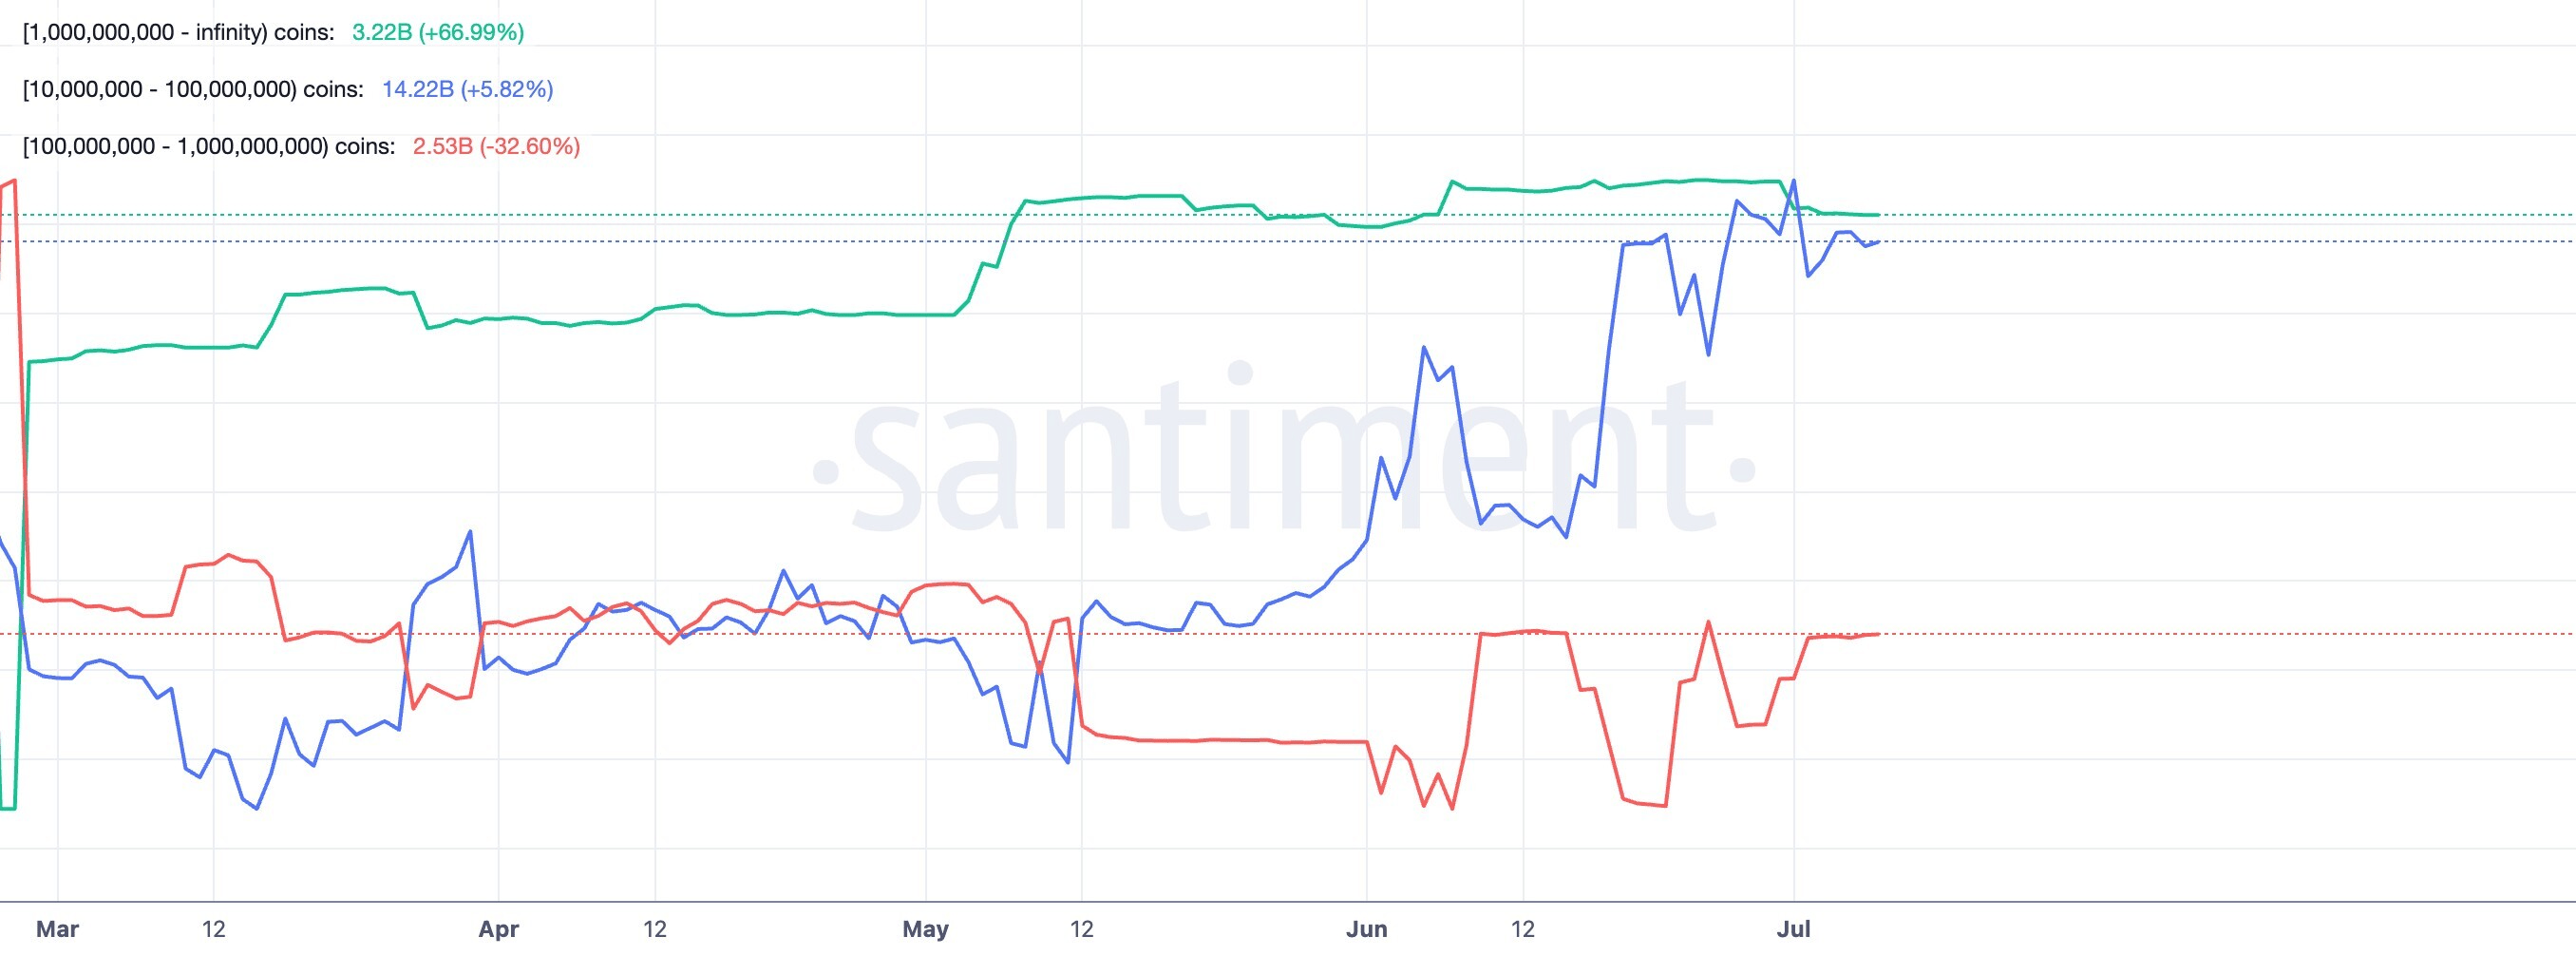
Cardano is losing demand among large wallets and retail investors, risking the loss of last week's gains. Santiment data shows that investors with more than 1 billion ADA hold 3.22 billion ADA on Tuesday, maintaining a largely stable holding since Friday. A similar trend is seen in cohorts holding 100 million to 1 billion ADA, which have stabilized near 2.53 billion ADA since Thursday.
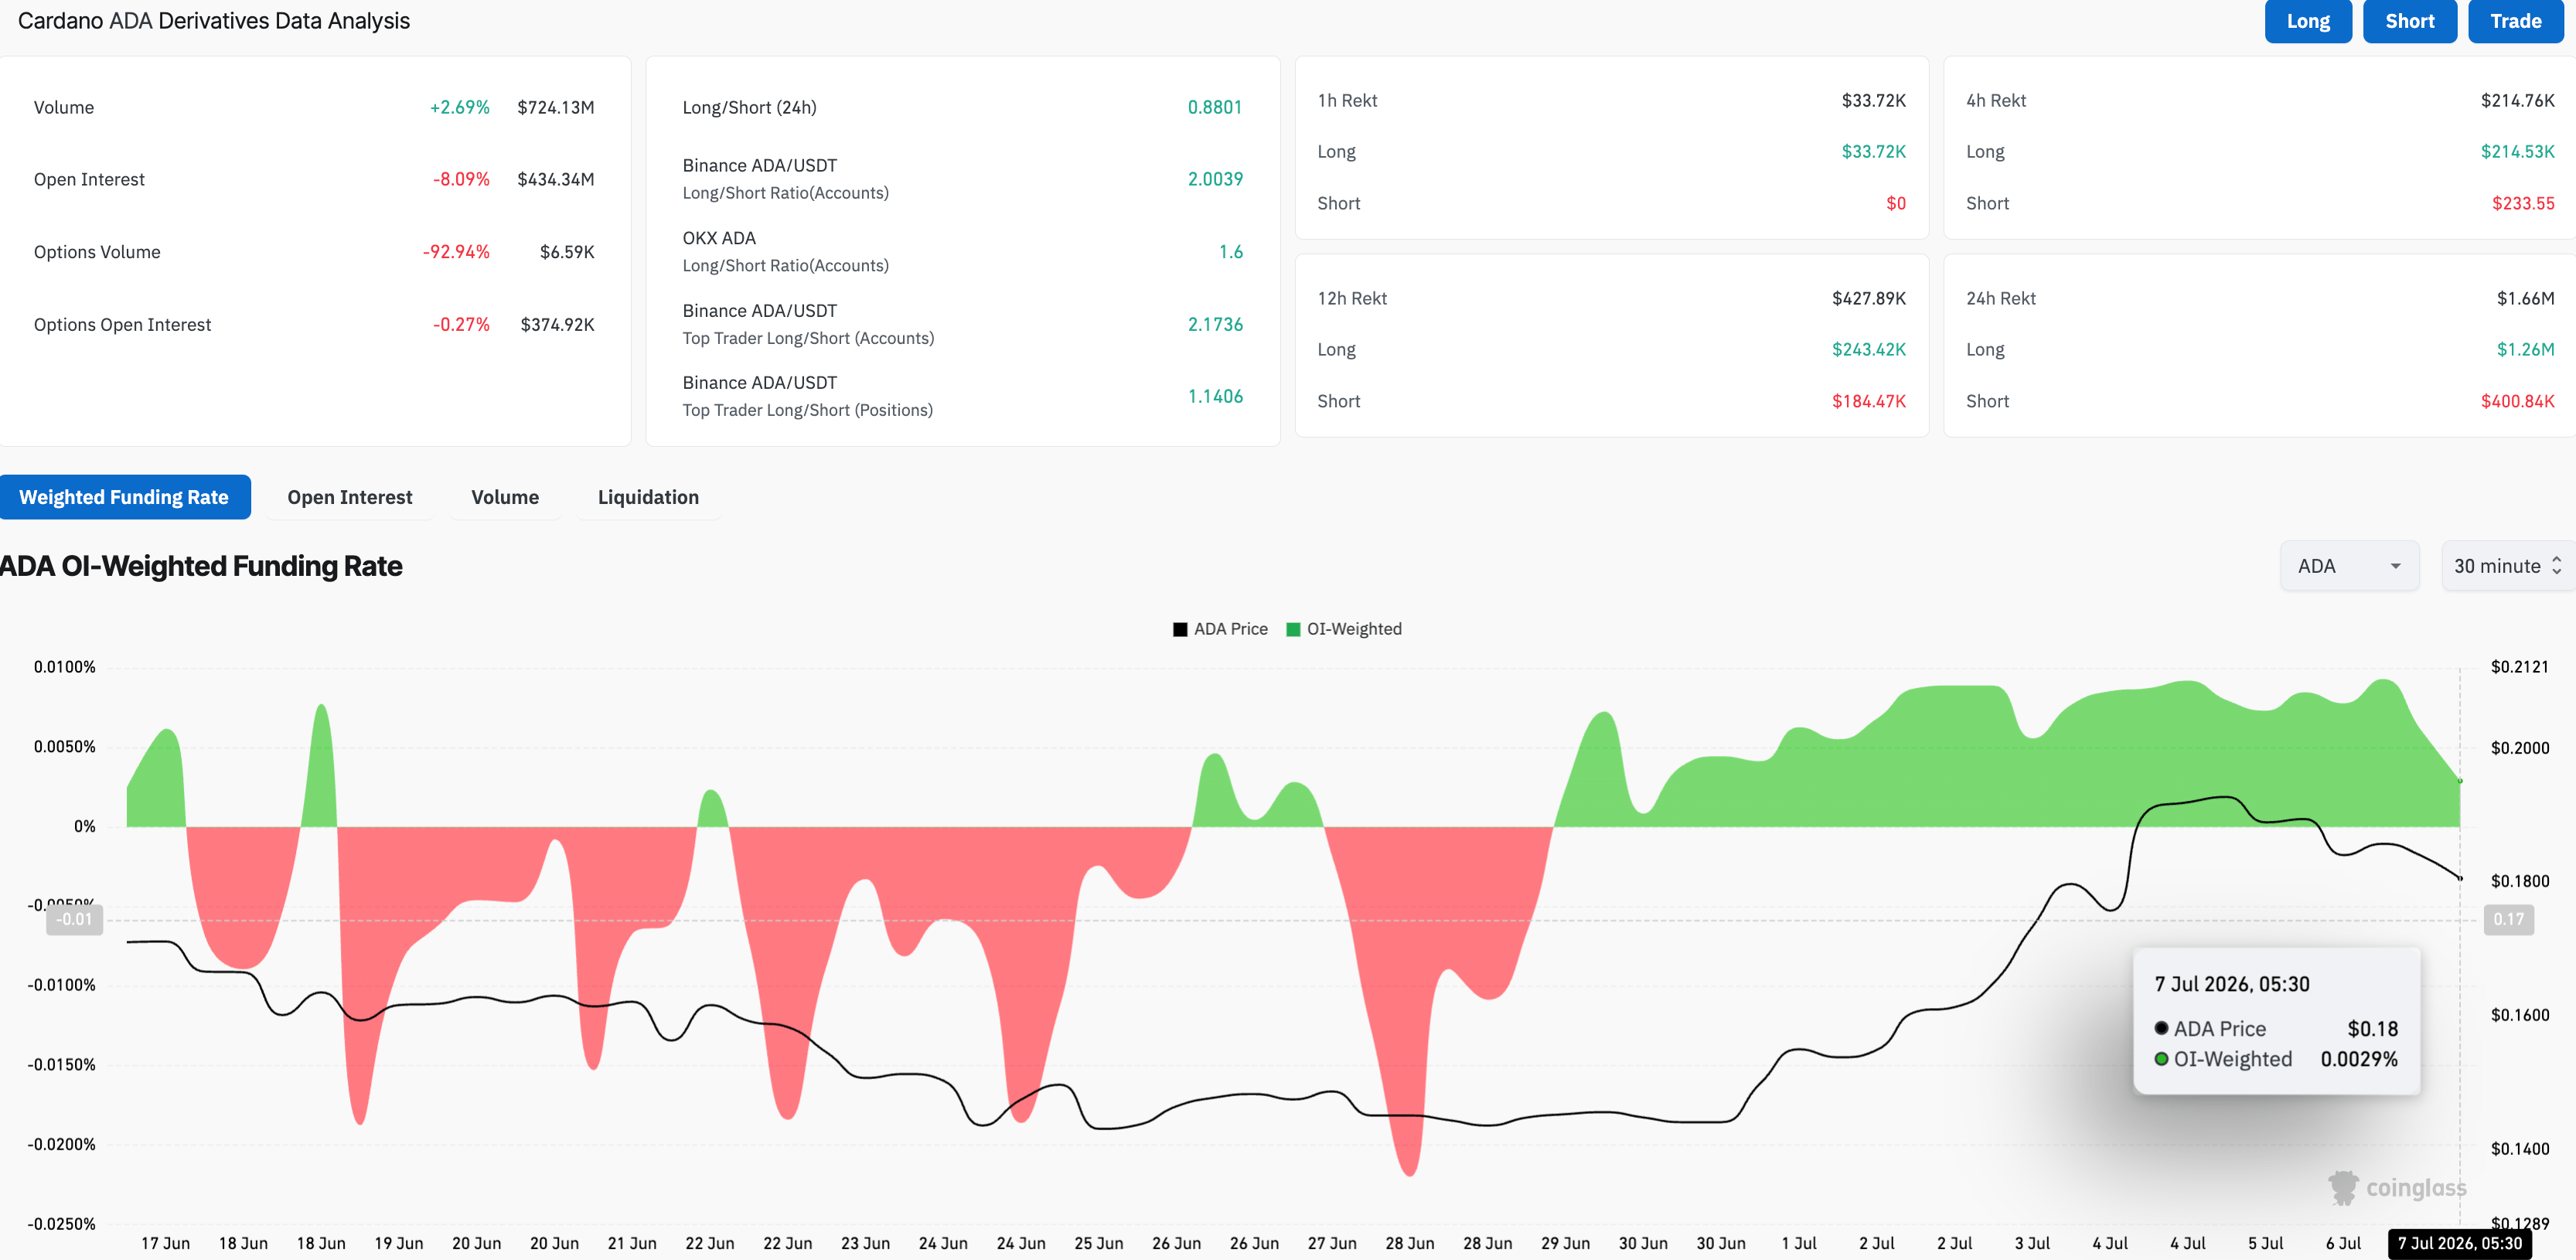
On the retail front, CoinGlass data shows that ADA futures Open Interest (OI) is down 8% over the last 24 hours to $434.34 million, indicating a significant wipeout of leveraged positions. At the same time, the funding rate has dropped to 0.0029%, from 0.0093% the previous day, implying that traders are shifting away from buying ADA long contracts at a premium.
The total liquidations in the same time period amounted to $1.66 million, led by $1.26 million of long liquidations, reaffirming the failing buy-side dominance in Cardano derivatives.
Cardano risks a steeper correction below its 50-day EMA
Cardano nears $0.1800 at press time on Tuesday, maintaining a mild bearish bias in the near term. ADA is trading lower, below its 50-day Exponential Moving Average (EMA) at $0.1861, and well under its 200-day EMA at $0.2940.
From a technical perspective, another decisive close below the 50-day EMA could reaffirm the downside bias, with the main structural floor at the June 26 low of $0.1385, projecting a downside risk of over 20%.
Momentum shows early signs of easing, with the Moving Average Convergence Divergence (MACD) holding above its signal line while the positive histogram contracts. At the same time, the Relative Strength Index (RSI) at 56 shows a downtick before reaching the overbought zone, hinting that buying pressure could fade rather than intensify.
On the topside, initial resistance is located at the 50-day EMA near $0.1861, where a daily close above would be needed to ease the current downside bias, before the more distant 200-day EMA at $0.2940 comes into view as a higher trend barrier.
(The technical analysis of this story was written with the help of an AI tool. Know more.)














