
Crypto market bleeds $1.80 billion amid concerns of Bitcoin losing $65,000
- Bitcoin hovers around $66,000 on Wednesday, as mounting selling pressure threatens a break below $65,000.
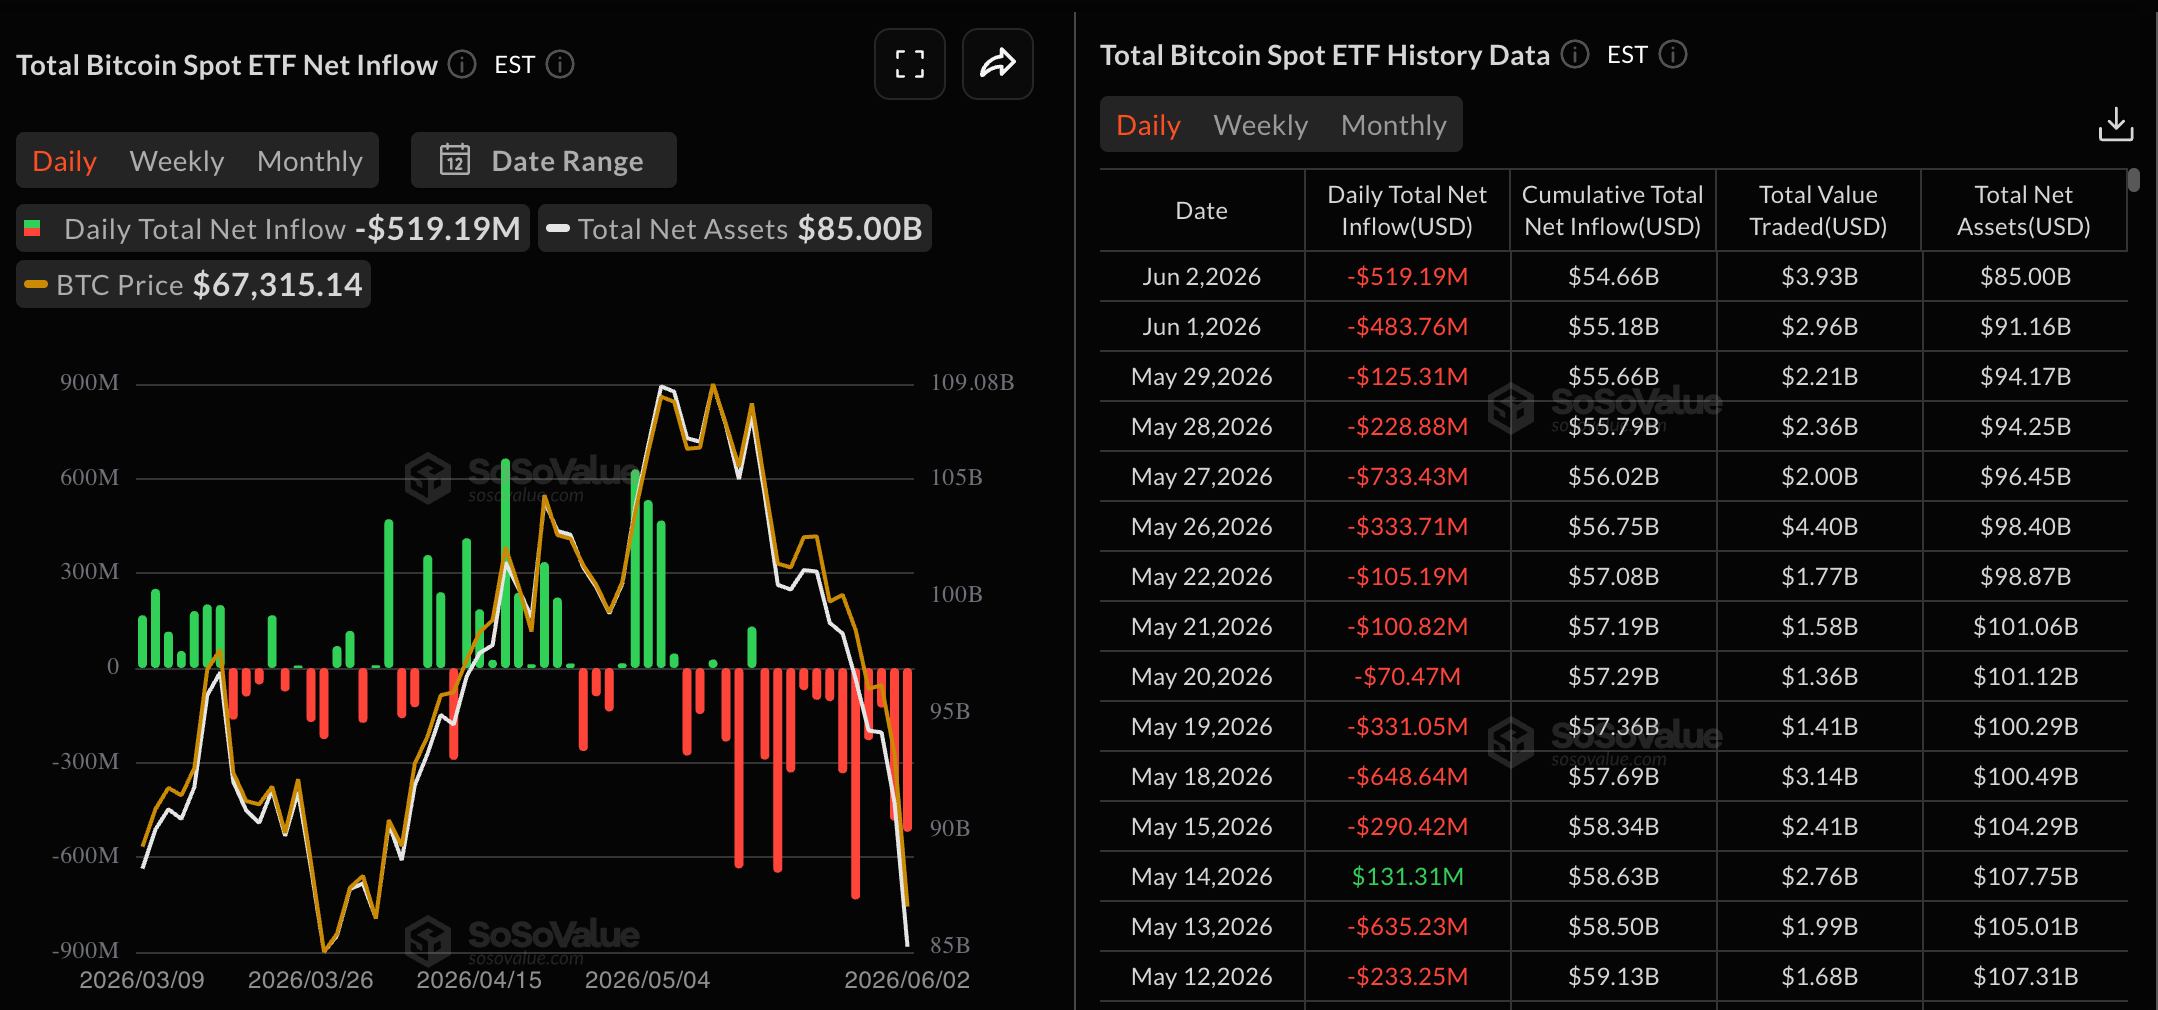
- A streak of ETF outflows of roughly $4 billion since May 15 reflects institutional pressure weighing down on Bitcoin.
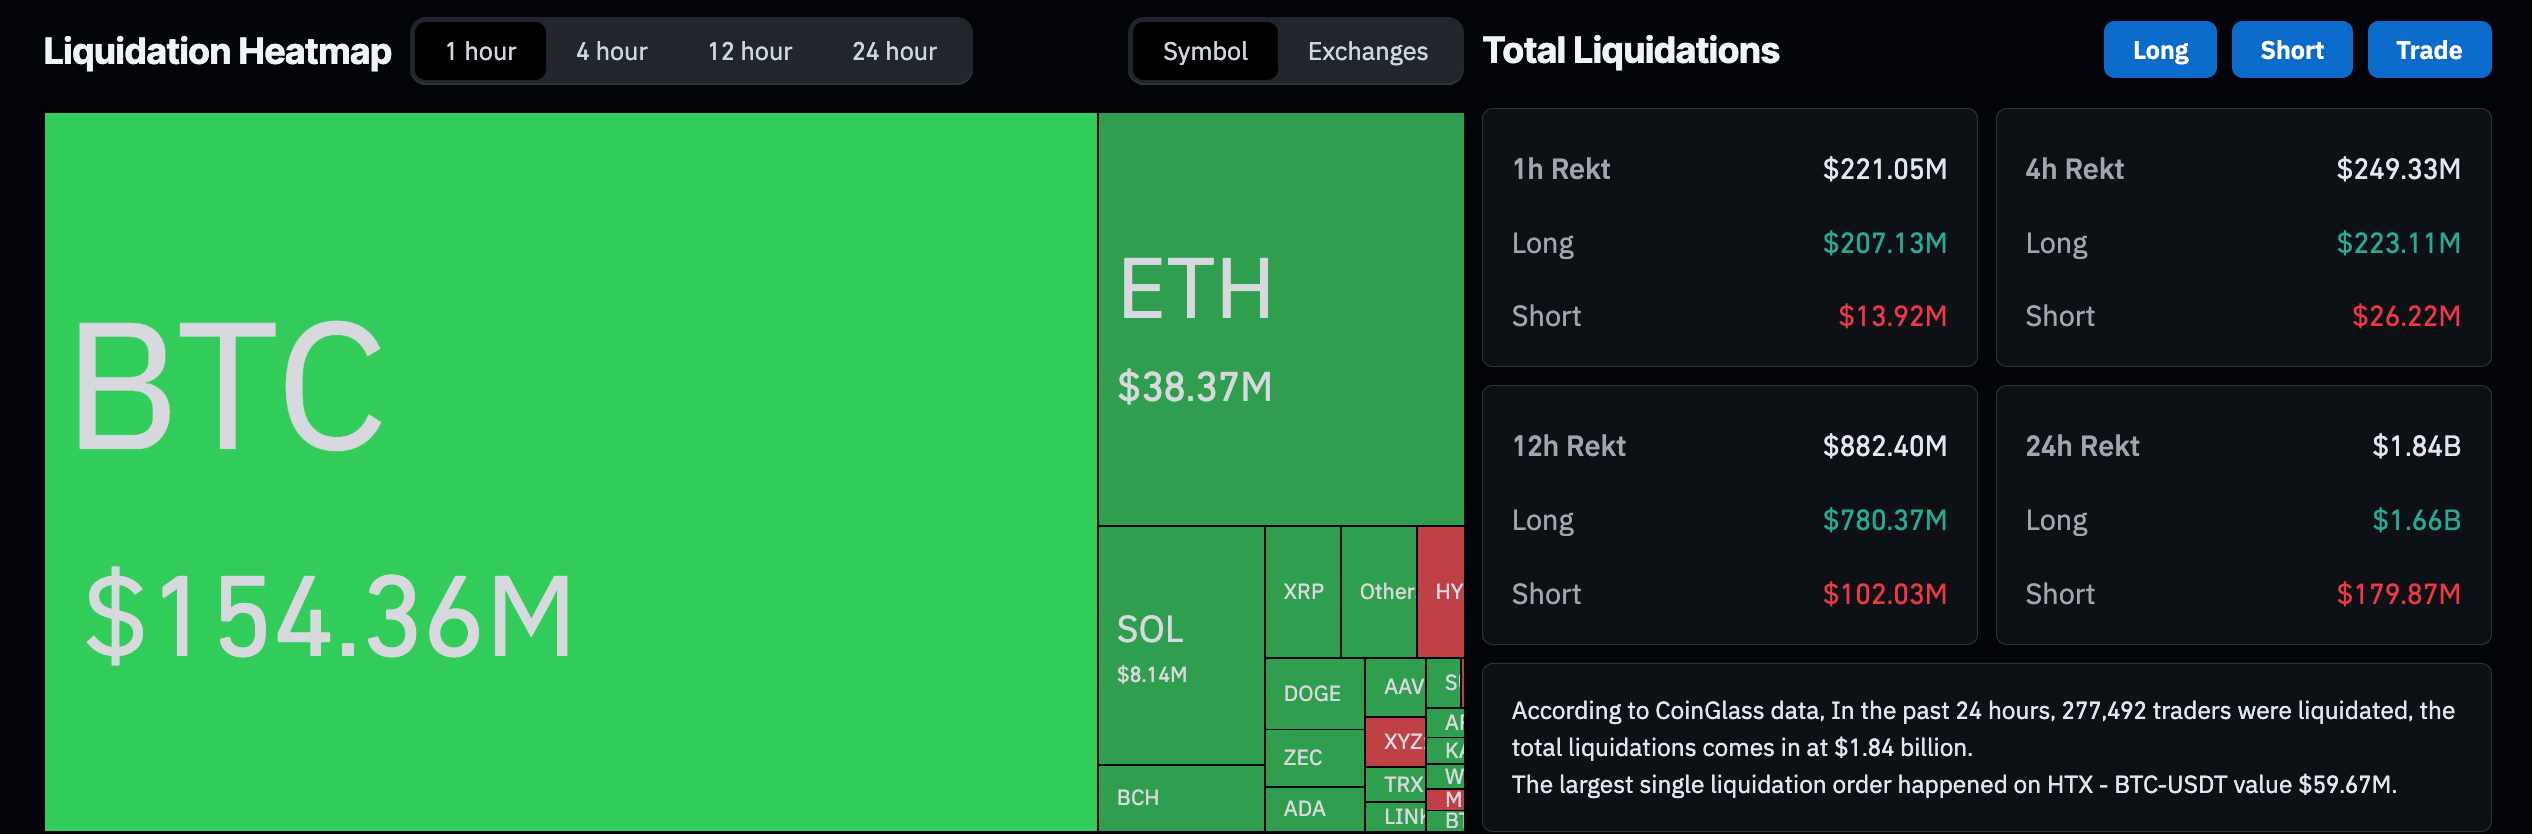
- Derivatives market data shows $1.84 billion in liquidation over the last 24 hours.
The cryptocurrency market is under extreme bearish pressure, with Bitcoin (BTC) price inching closer to $65,000 and total liquidations over the last 24 hours surpassing $1.80 billion. Declining institutional confidence in Bitcoin, with outflows of roughly $4 billion since May 15, appears as the primary catalyst fueling the ongoing correction.

Crypto market crash wipes out over $1.80 billion
Bitcoin’s 6% drop on Tuesday triggered a massive market-wide wipeout of bullish positions. CoinGlass data show that liquidation over the last 24 hours totals $1.84 billion from 277,754 traders, including $1.66 billion in forced liquidations of long positions, reaffirming the sell-side bias. This marks the third-largest liquidation spree so far this year.
The largest single liquidation order occurred on the BTC/USDT trading pair on the HTX exchange, with a value of $59.67 million.
Institutional offloading fuels the crypto market crash
Bitcoin-focused Exchange-Traded Funds (ETFs) have outpaced traditional crypto whales in dictating BTC's price. SoSoValue data shows BTC ETFs recorded $519.19 million in outflows on Tuesday, bringing the 12-day outflow streak total to $3.97 billion. This outflow streak dropped the Total Net Assets to $85.00 billion from $104.29 billion on May 15. Such a massive rebalancing reinforces bearish market sentiment and could fuel a steeper price correction amid extended outflows.
Bitcoin risks breaking the $65,000 mark
Bitcoin trades near $67,000 at press time on Wednesday, up from an earlier low of $65,426. Still, BTC maintains a clear bearish bias after a 6% drop the previous day.
That said, price remains well below the 50-, 100-, and 200-day Exponential Moving Averages (EMAs), clustered around $75,325, $76,244, and $81,782, respectively. The pair also trades below the broken trendline, now acting as resistance, around $71,491.
Meanwhile, momentum remains heavy on the daily chart, with the Relative Strength Index (RSI) at 22 signaling oversold conditions, yet the Moving Average Convergence Divergence (MACD) remains deeply negative, suggesting that downside pressure dominates.
Looking down, a clear close below $65,000 would break the support marked on March 29 and threaten the February 6 low at $60,000. This is where buyers may attempt to slow the decline, though the prevailing structure suggests that any recovery is likely to face selling interest before those overhead barriers are overcome
On the topside, initial resistance appears at the reclaimed-bearish trendline area near $71,491, ahead of a denser supply zone where the 50-day EMA aligns around $75,325 and the 100-day EMA near $76,244.
(The technical analysis of this story was written with the help of an AI tool.)


