
Crypto Market Overview: Bitcoin logs a 20-month low – Worldcoin, Pepe lead losses
作者 Vishal Dixit
更新: 26 Jun 2026


熱門文章

The broader cryptocurrency market is facing relentless selling, pushing Bitcoin (BTC) down to $58,000 on Friday and liquidating over $1 billion in 24 hours. Worldcoin (WLD) and Pepe (PEPE) have emerged as the biggest losers over the same period, as bearish grip tightens on retail sentiment.
- Bitcoin extends losses below $59,000 on Friday, marking a 20-month low.
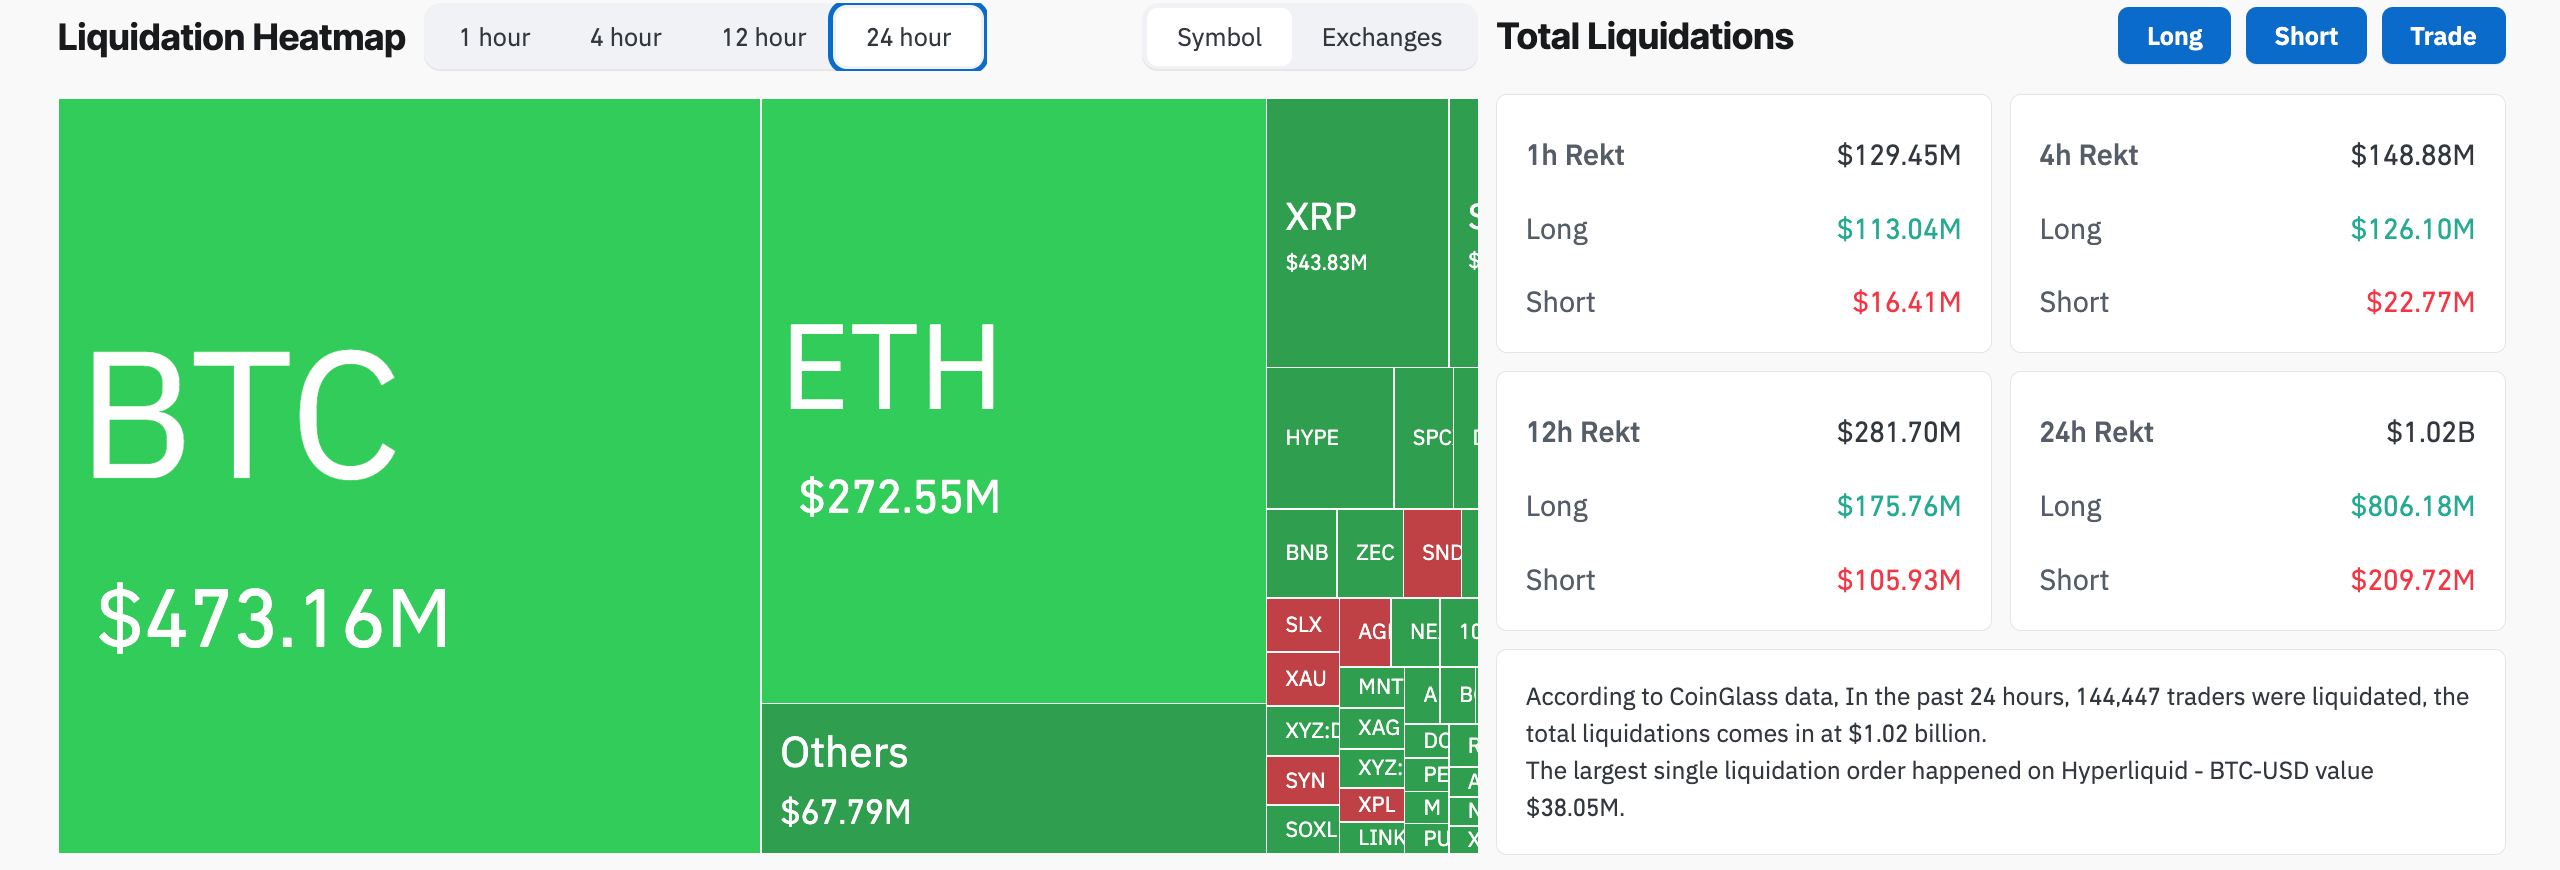
- Total liquidations cross $1 billion in 24 hours, with over $800 million in long liquidations, pointing to a clear, broader market sell-off.
- Worldcoin and Pepe are among the biggest losers over the last 24 hours.
The broader cryptocurrency market is facing relentless selling, pushing Bitcoin (BTC) down to $58,000 on Friday and liquidating over $1 billion in 24 hours. Worldcoin (WLD) and Pepe (PEPE) have emerged as the biggest losers over the same period, as bearish grip tightens on retail sentiment.
CoinMarketCap’s Fear and Greed Index at 14 on Friday continues to drift lower, signaling a clear risk-off mandate among investors.
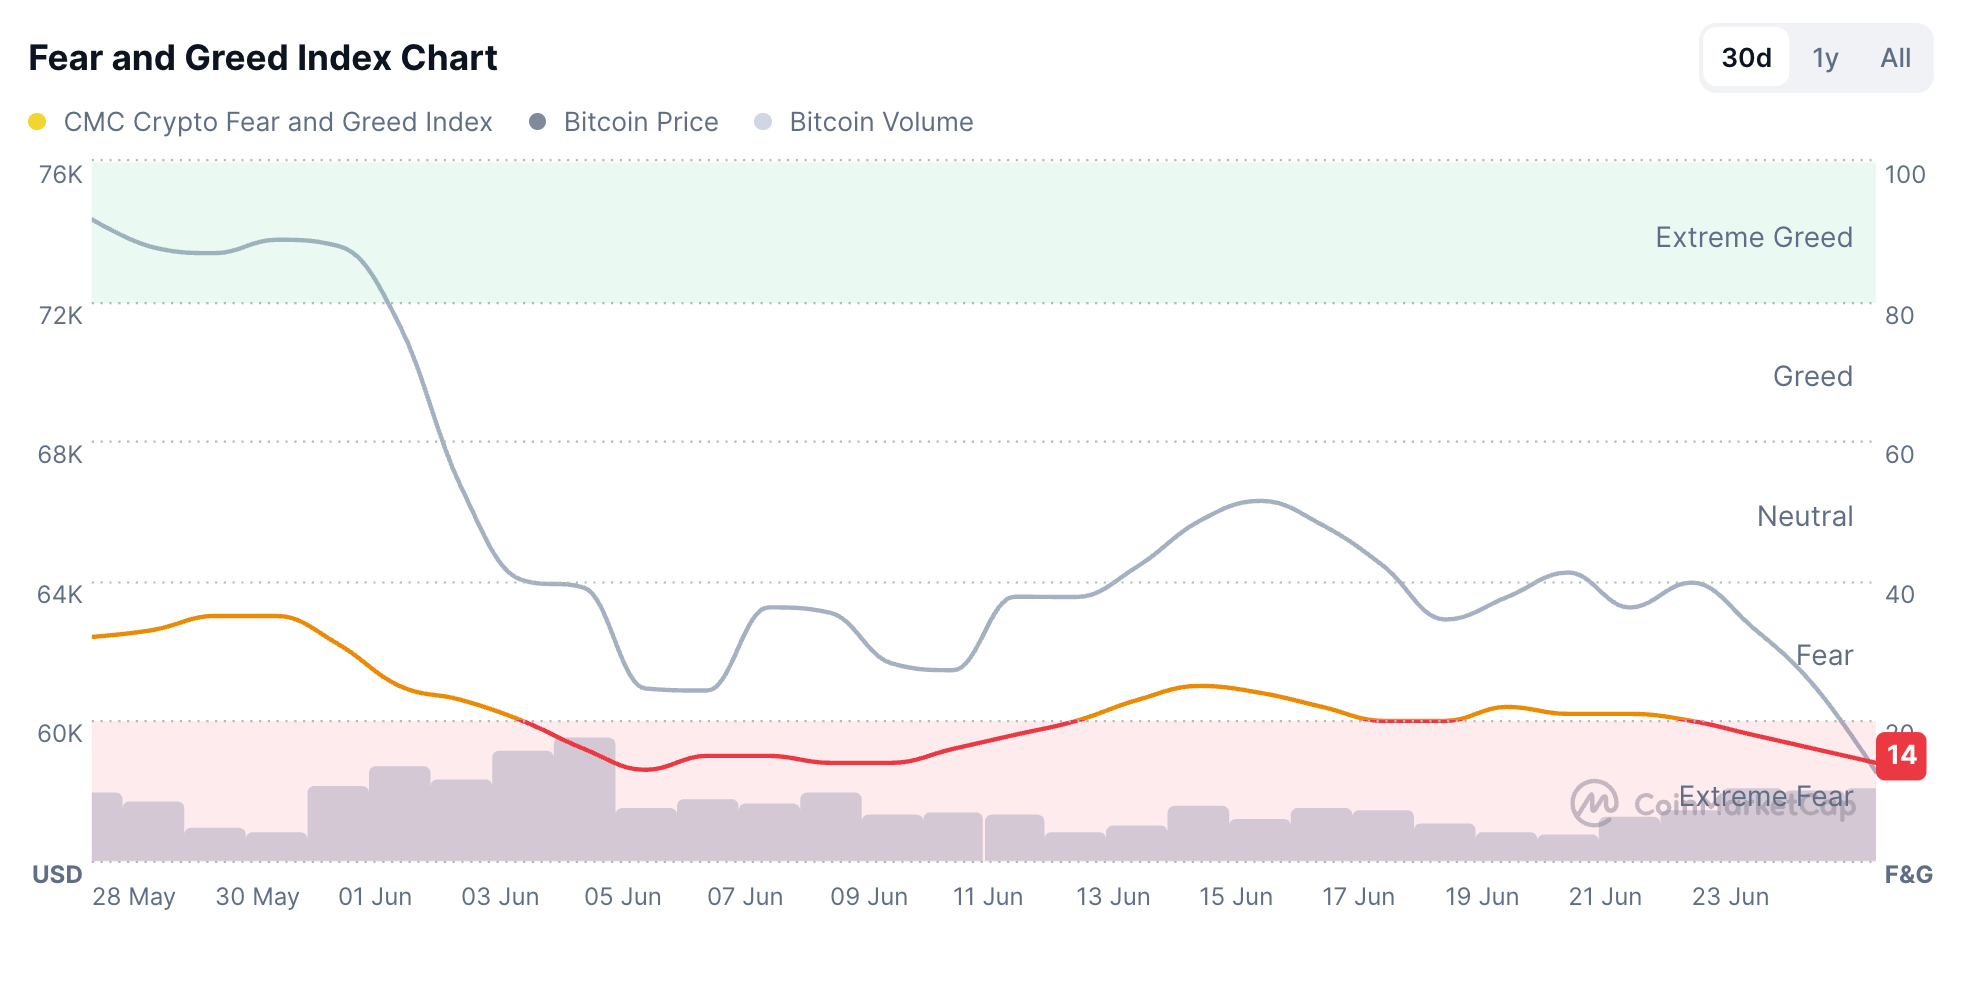
Crypto market hits the panic button
Bitcoin's slip below the $60,000 mark signals a structural bearish shift across the crypto market, with extended downside risks. CoinGlass data shows around $1 billion in total liquidations over the last 24 hours, primarily driven by $806 million in long liquidations, suggesting weakness among buyers.
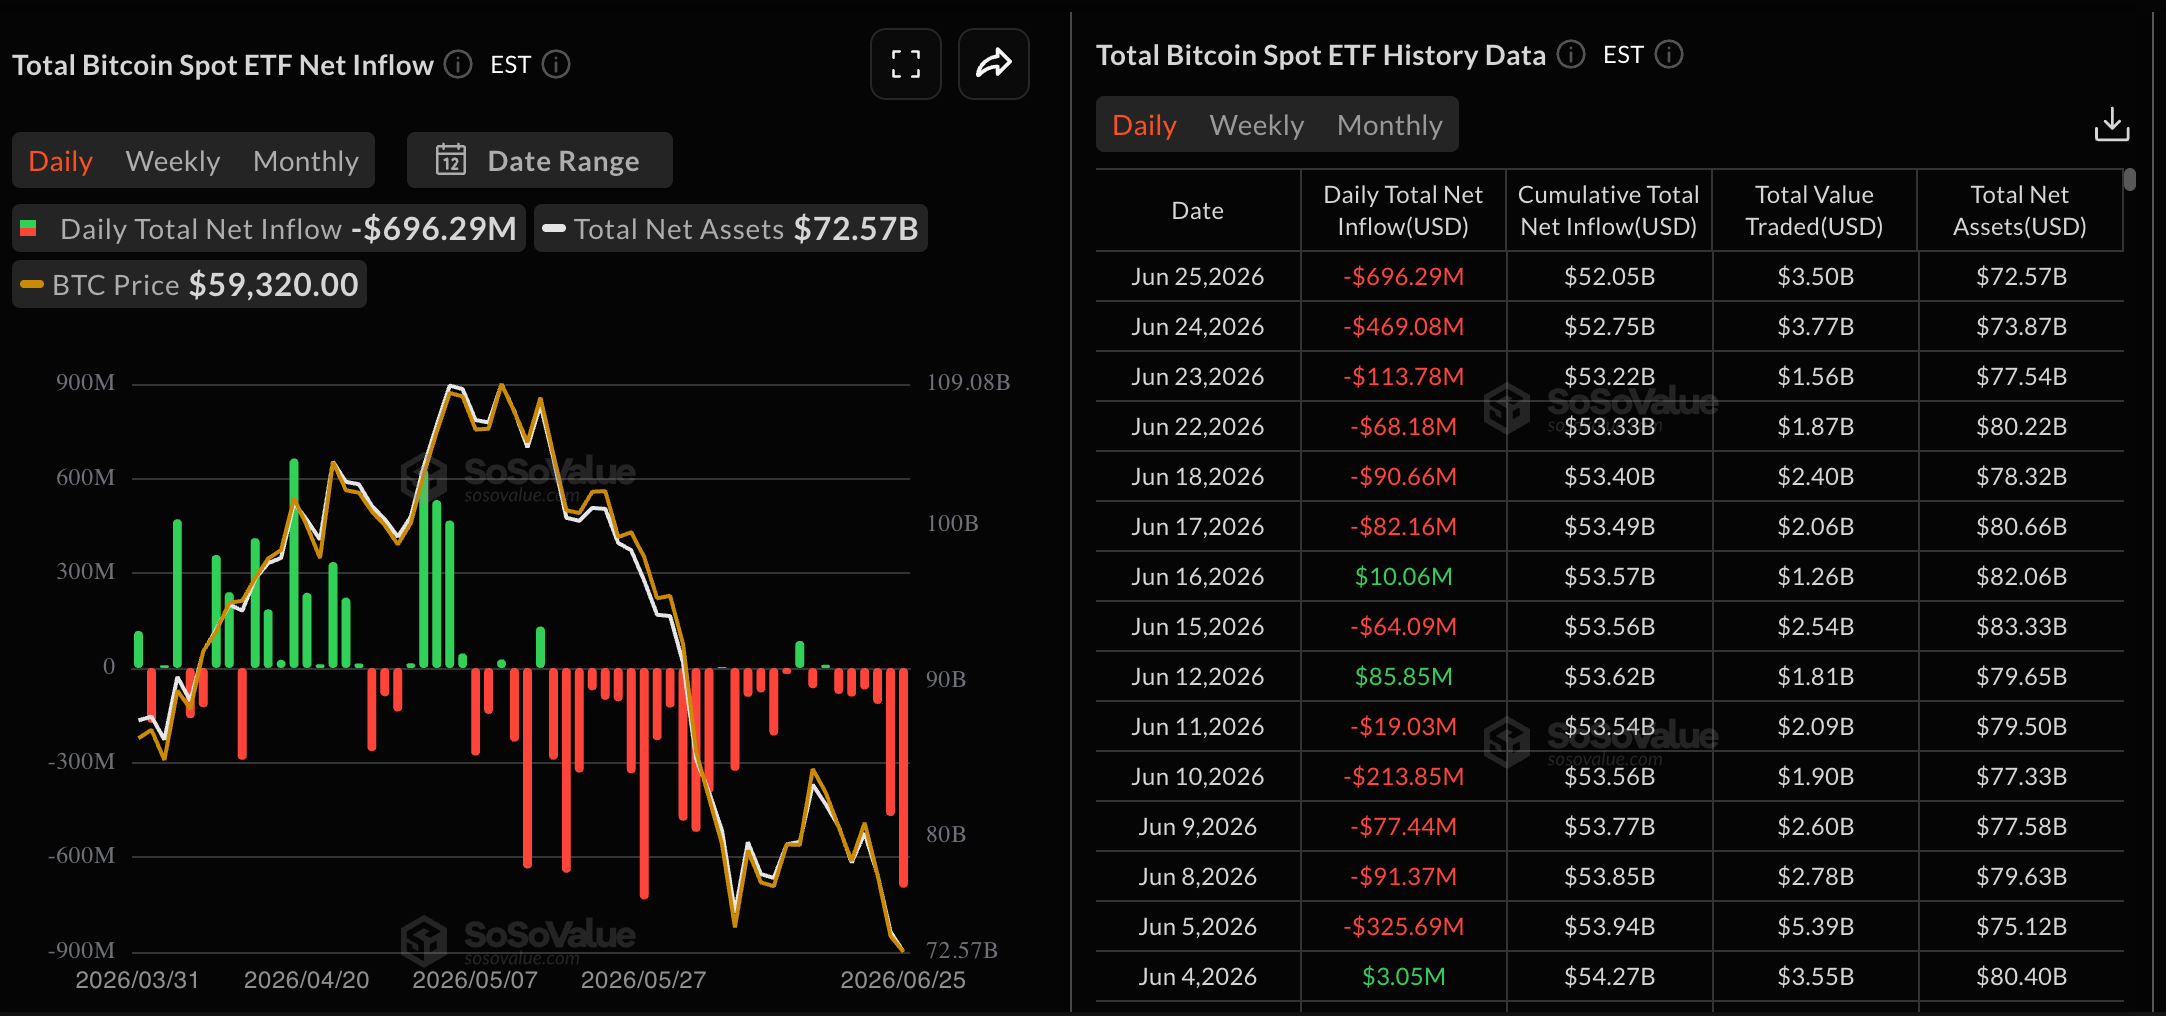
On the institutional front, Bitcoin Exchange-Traded Funds (ETFs) recorded $696 million in outflows on Thursday, marking their highest outflow since May 27. The institutional trimming extends for the sixth consecutive day, totaling $3.61 billion so far in June, the highest monthly outflow ever.
Bitcoin loses recovery hopes as bears break the $60,000 mark
Bitcoin trades around $58,000 at press time on Friday, extending its fourth consecutive day of losses. The bearish breakout of the $60,000 psychological threshold offsets the possibility of a double-bottom reversal, reaffirming a firm bearish bias.
The 50-day Exponential Moving Average (EMA) at $67,821 and the 200-day EMA at $77,044 both loom overhead as trend-defining resistance, while the broken upward support trend line, now a barrier around $73,736, underscores the loss of bullish structure.
That said, the momentum remains heavy on the downside, with the Moving Average Convergence Divergence (MACD) slipping below its signal line, hinting at fading downside pressure, while the Relative Strength Index (RSI) at 28 shows oversold conditions that could slow but not yet reverse the downtrend.
Looking down, the path of least resistance could drift Bitcoin lower toward the July 5, 2024, low of $53,485.
Worldcoin and Pepe extend their downward spiral
Worldcoin trades below the $0.5000 psychological level on Friday, mirroring Bitcoin's four consecutive days of losses. Still, the 50-day EMA at $0.4513 and the 200-day EMA at $0.4651 keep the near-term tone neutral to slightly supported after the recent bounce.
The MACD line falls sharply below the signal line as selling pressure resumes, while the RSI at 44 has eased below the midline, hinting that bullish momentum is fading.
On the topside, immediate resistance aligns with the $0.7229 peak from June 17, and a daily close above this barrier would open the way for a more constructive recovery phase.
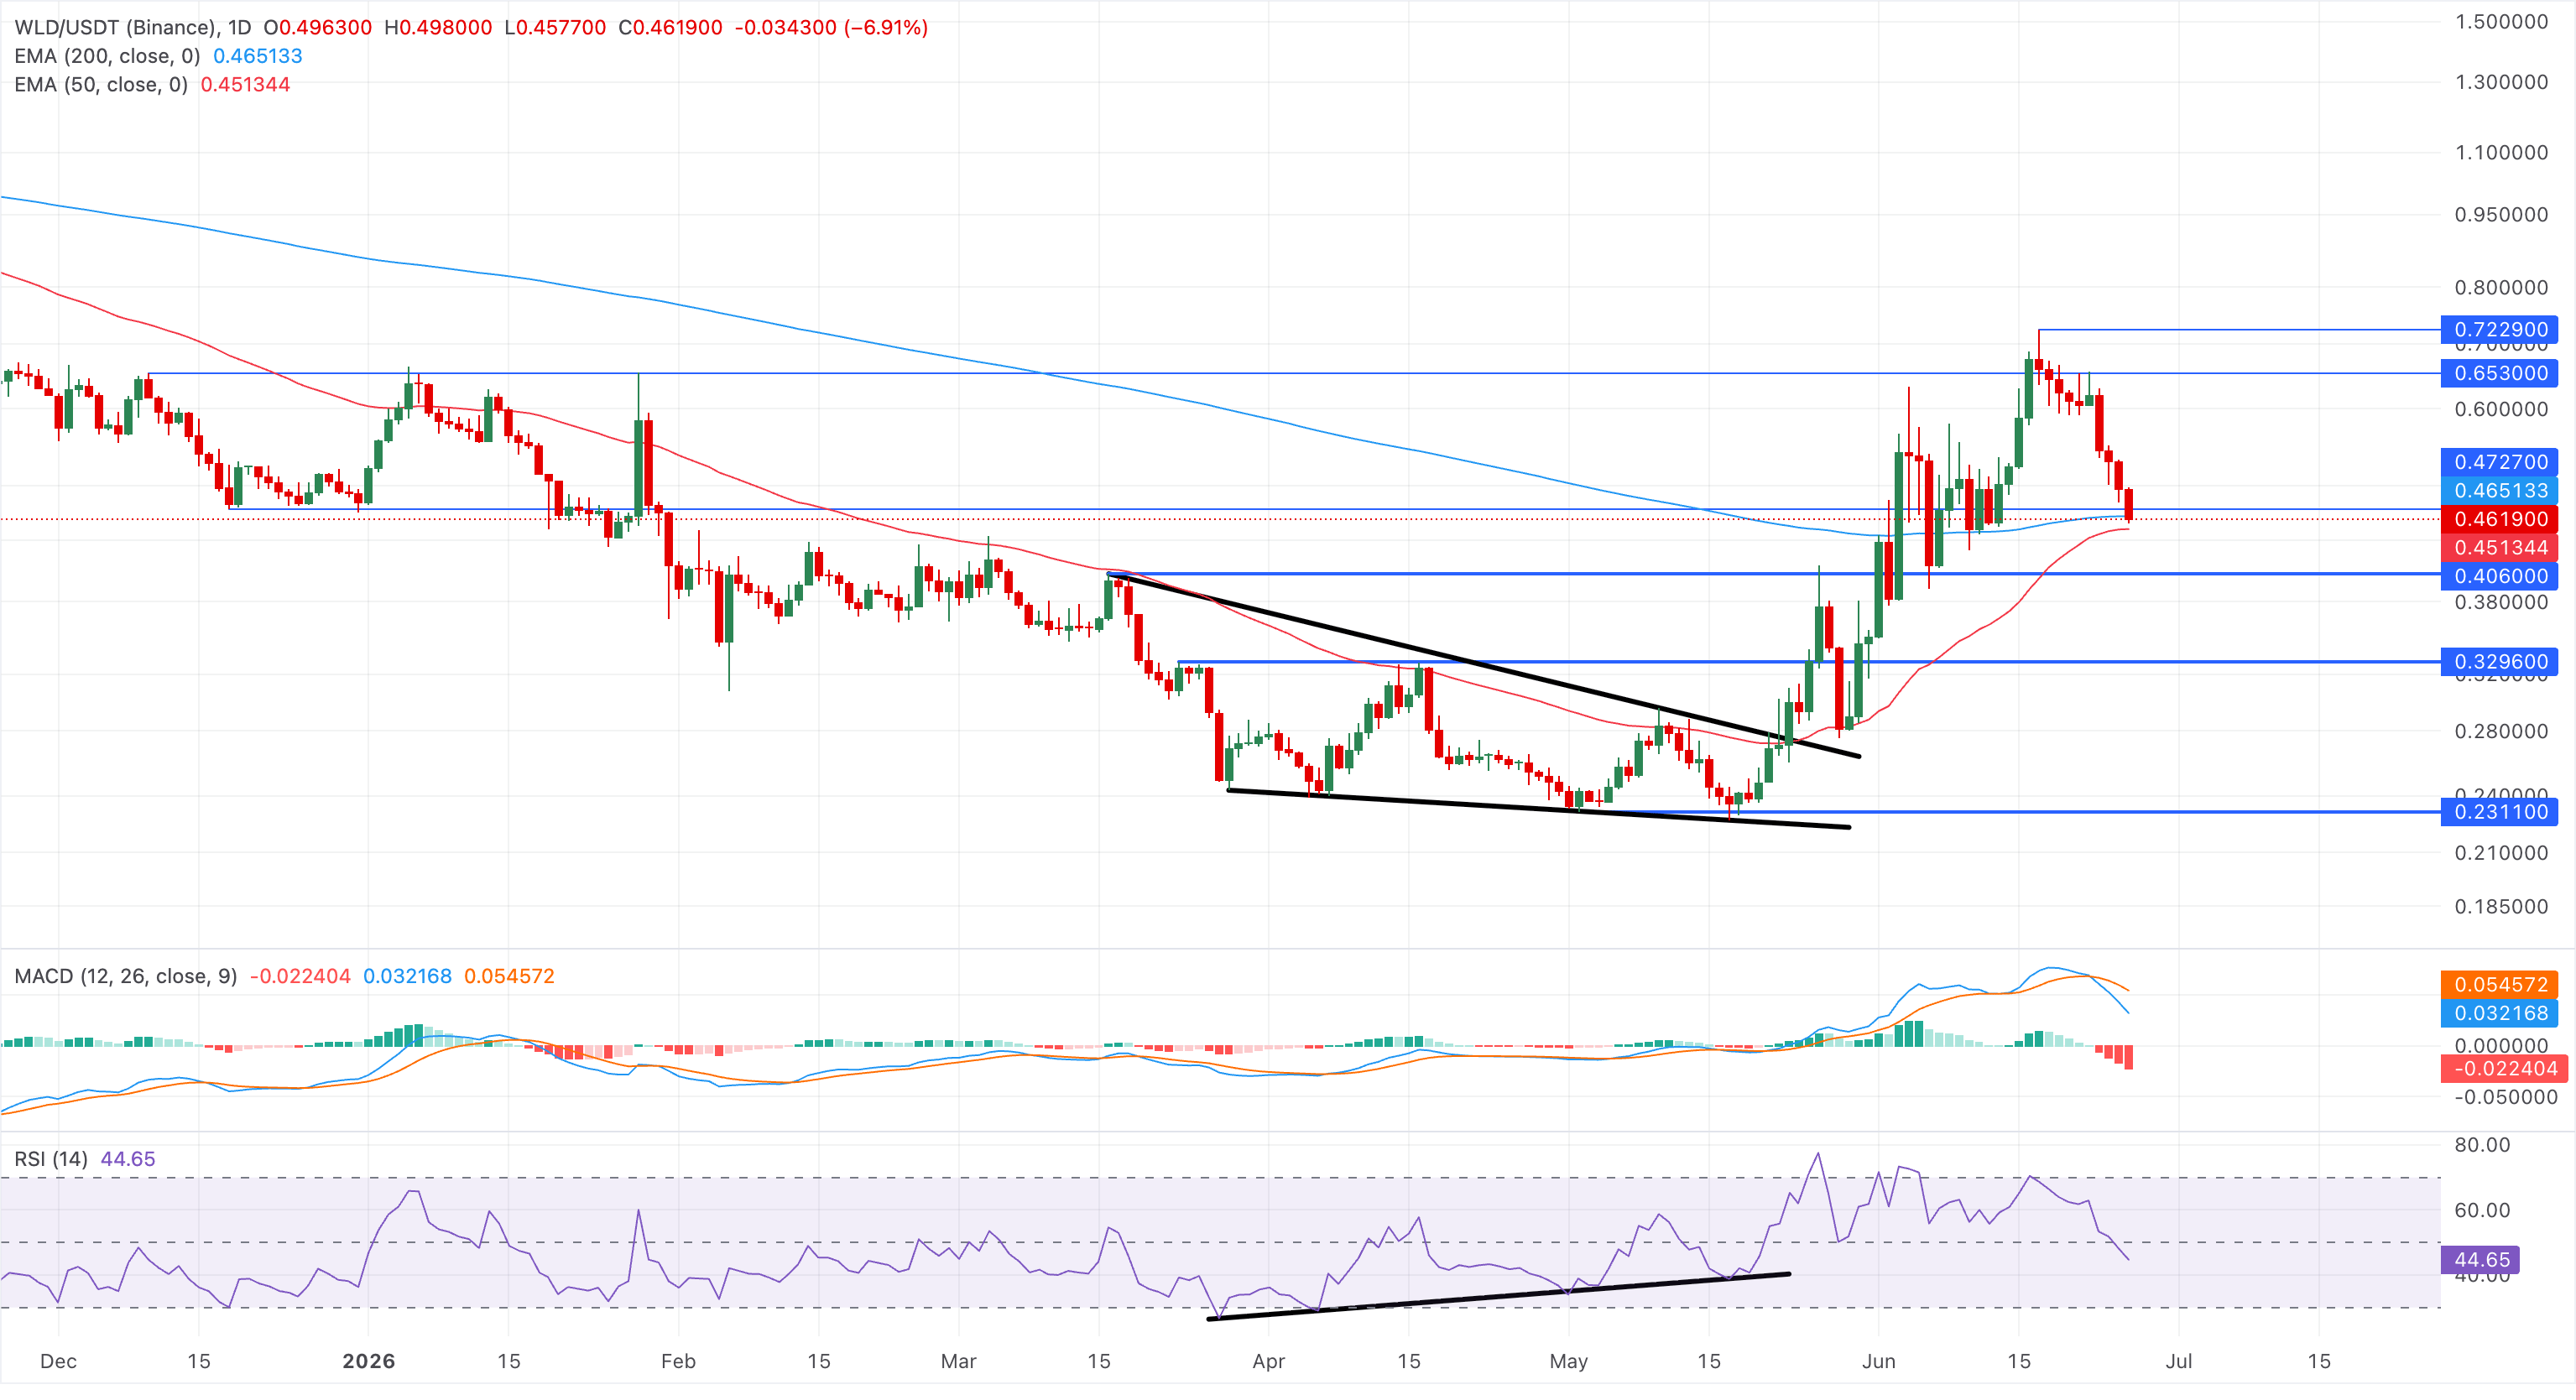
On the downside, initial support comes from the 200-day EMA at $0.4651, and the 50-day EMA at $0.4513, and a break back below this level would reinforce the idea of a deeper pullback toward prior lows, leaving the pair vulnerable to renewed selling pressure.
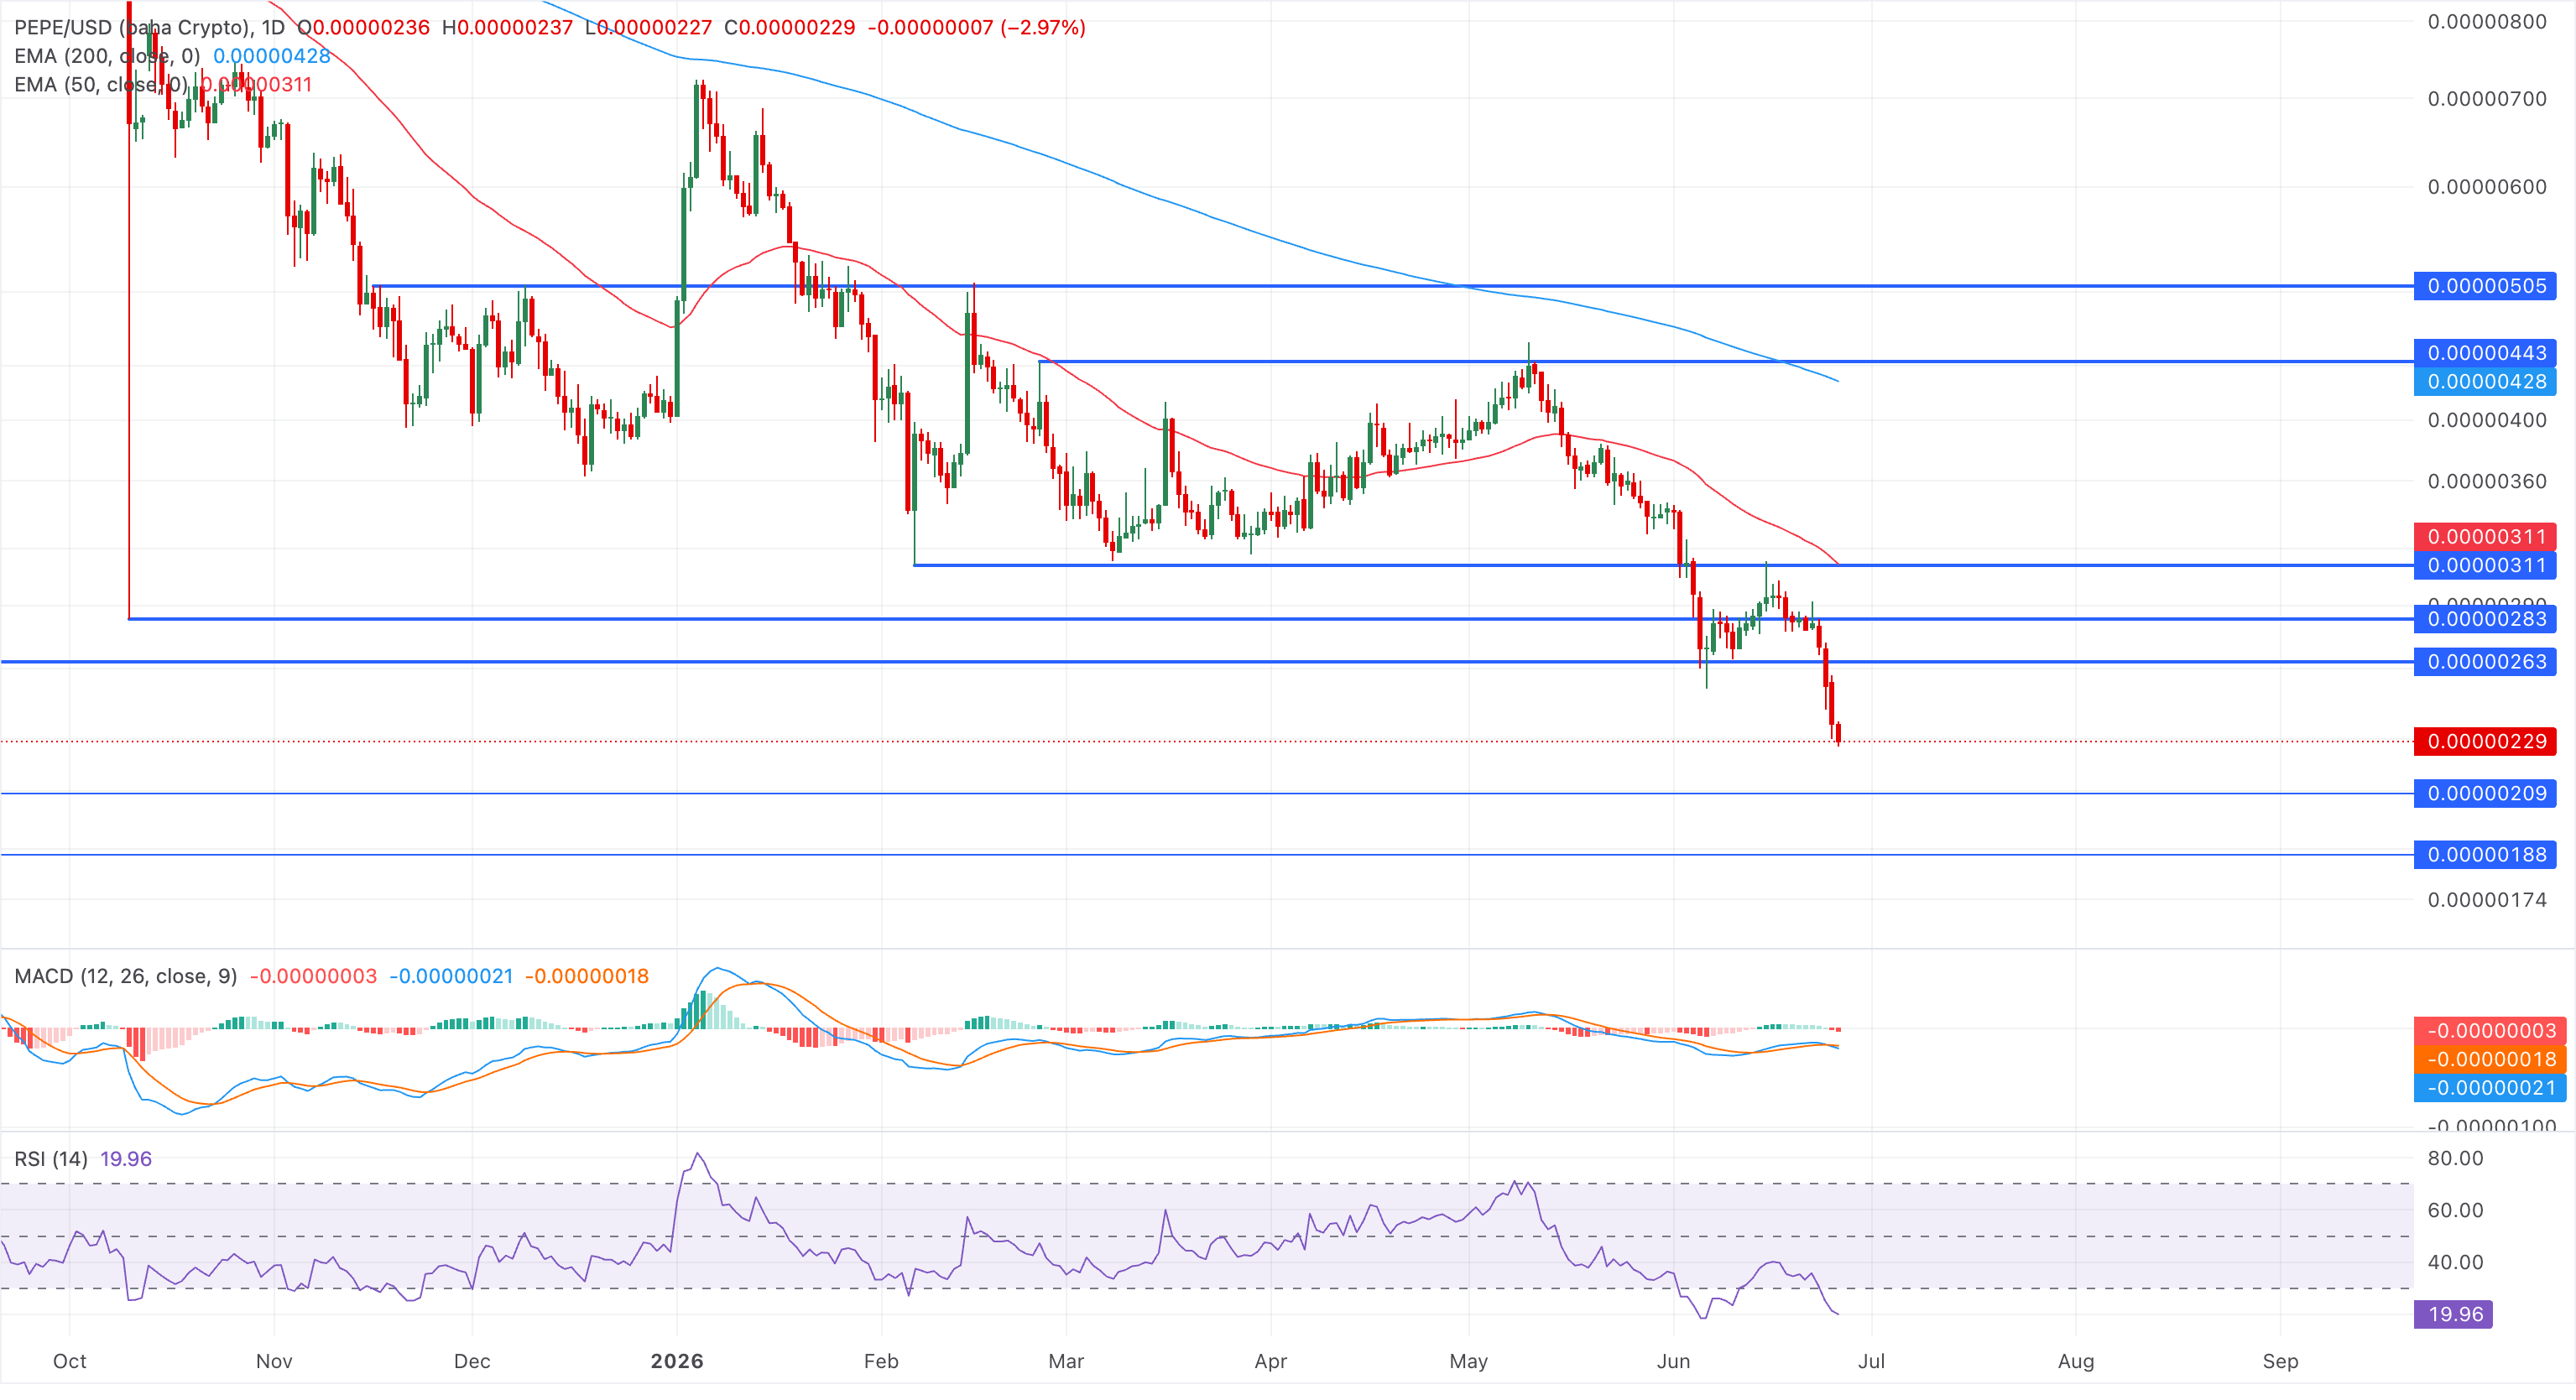
Pepe mimics a falling knife scenario on the daily chart, with roughly an 18% loss over the last four days. PEPE is down 3% at press time on Friday, well below the 50-day and 200-day EMAs at $0.00000311 and $0.00000428, respectively. To reinforce an upward trend, short-term recoveries in PEPE should clear the moving averages above.
That said, the momentum is extremely bearish on the daily timeframe, limiting the chances of a rebound. The MACD indicator flashes a sell signal with a bearish crossover while the RSI at 19 points to extreme oversold conditions.
On the downside, the extended correction in PEPE could target the $0.00000200 round figure, last seen in February 2024.
(The technical analysis of this story was written with the help of an AI tool.)

超過一百萬用戶依賴 FXStreet 獲取即時市場數據、圖表工具、專家洞見與外匯新聞。其全面的經濟日曆與教育網路研討會協助交易者保持資訊領先、做出審慎決策。FXStreet 擁有約 60 人的團隊,分布於巴塞隆納總部及全球各地。
閱讀更多


