
Crypto Overview: Broader market recovers as Near Protocol and Venice Token rally
作者 Vishal Dixit
更新: 22 May 2026


熱門文章

Bitcoin (BTC) holds above $77,000 at press time on Friday as bearish sentiment wanes in the broader market. Near Protocol (NEAR) and Venice Token (VVV) have posted double-digit gains over the last 24 hours, emerging as top performers.
- Bitcoin hovers above $77,000 on Friday as the broader market sentiment holds.
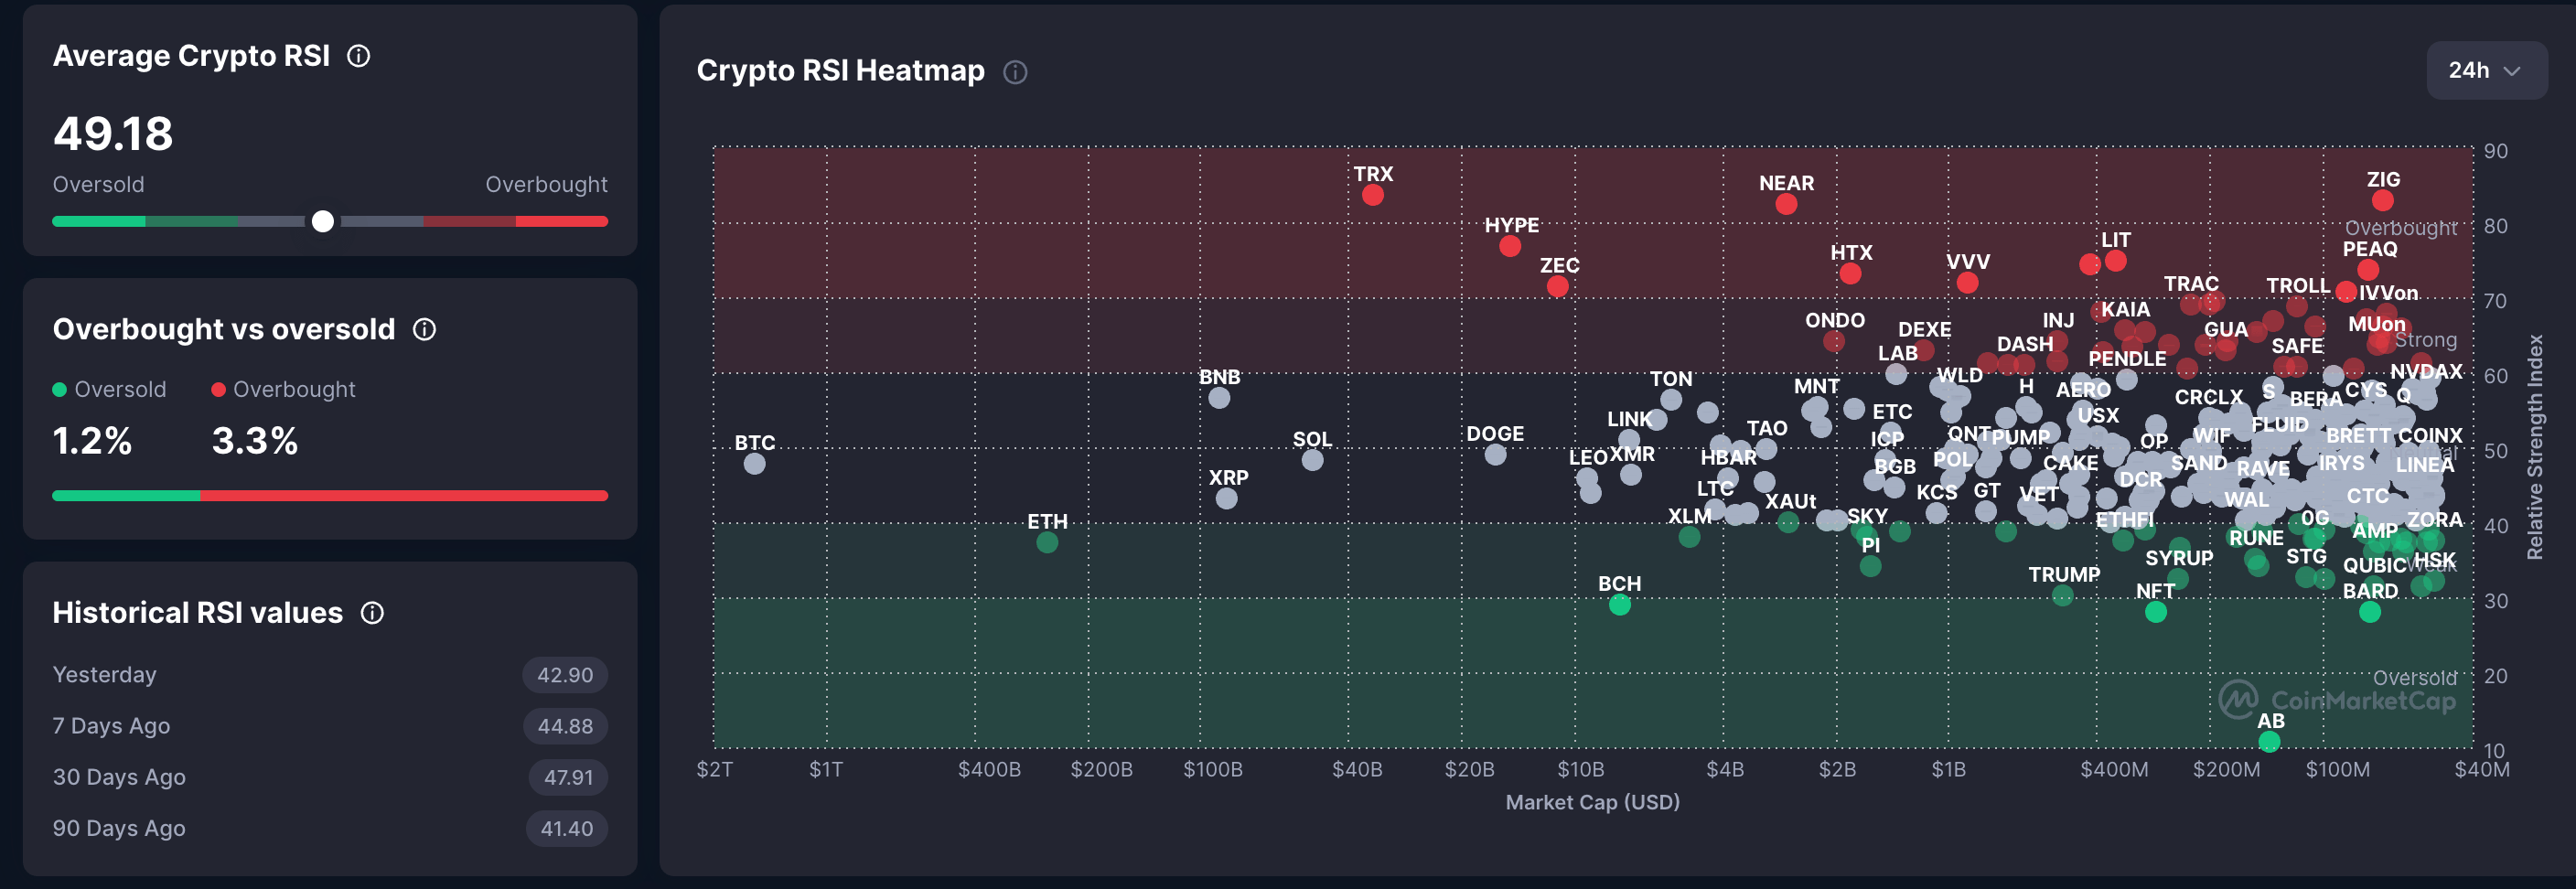
- The average RSI of the crypto market rises to 49 on Friday, signaling a shift to a neutral level as bearish pressure wanes.
- Near Protocol and Venice Token are leading the broader market gains over the last 24 hours.
Bitcoin (BTC) holds above $77,000 at press time on Friday as bearish sentiment wanes in the broader market. Near Protocol (NEAR) and Venice Token (VVV) have posted double-digit gains over the last 24 hours, emerging as top performers.
Broader market selling pressure wanes
Altcoins are leading the broader market gains as Bitcoin holds steady after a correction earlier this week. The crypto market’s average Relative Strength Index (RSI) has increased to 49, from 42 on Thursday, signaling a significant reduction in selling pressure. This return to neutral RSI levels increases the likelihood that buyers will regain control.
Near Protocol and Venice Token test breakout rally
Near Protocol is up over 8% on Friday, extending Thursday's 13% gain. NEAR keeps a clear bullish near-term bias as price extends well above both the 50- and 200-day Exponential Moving Averages (EMAs), which now underpin the uptrend.
The Moving Average Convergence Divergence (MACD) histogram is positive and expanding above zero, suggesting upside momentum is still building, though the RSI near 82 flags deeply overbought conditions that could prompt a cooling phase or consolidation after the latest rally.
On the topside, NEAR trades above the 61.8% Fibonacci retracement at $1.91, measured over the downswing from $3.18 to $0.84. A daily close above it would position the 78.6% Fibonacci retracement at $2.39 as the next key resistance.
On the downside, the 50% retracement at $1.63 is the first notable support, followed by the 38.2% Fibonacci retracement at $1.39.
Venice Token trades at a record high, up 4% on Friday, extending the 12% gain from the previous day. The pair holds well above the 50-period EMA at $15.67 on the 4-hour chart and the 200-period EMA at $12.52, keeping the near-term structure firmly bullish as price extends away from its underlying trend supports.
The rising RSI near 68 hints at strong but increasingly stretched upside momentum, while the MACD remains positive, with the line holding in positive territory, reinforcing the constructive bias on this timeframe.
A decisive close above $18.96 would confirm VVV entering a price discovery mode, potentially targeting the 78.6% Fibonacci trend-based extension level at $24.07, measured from $18.96 to $12.50.
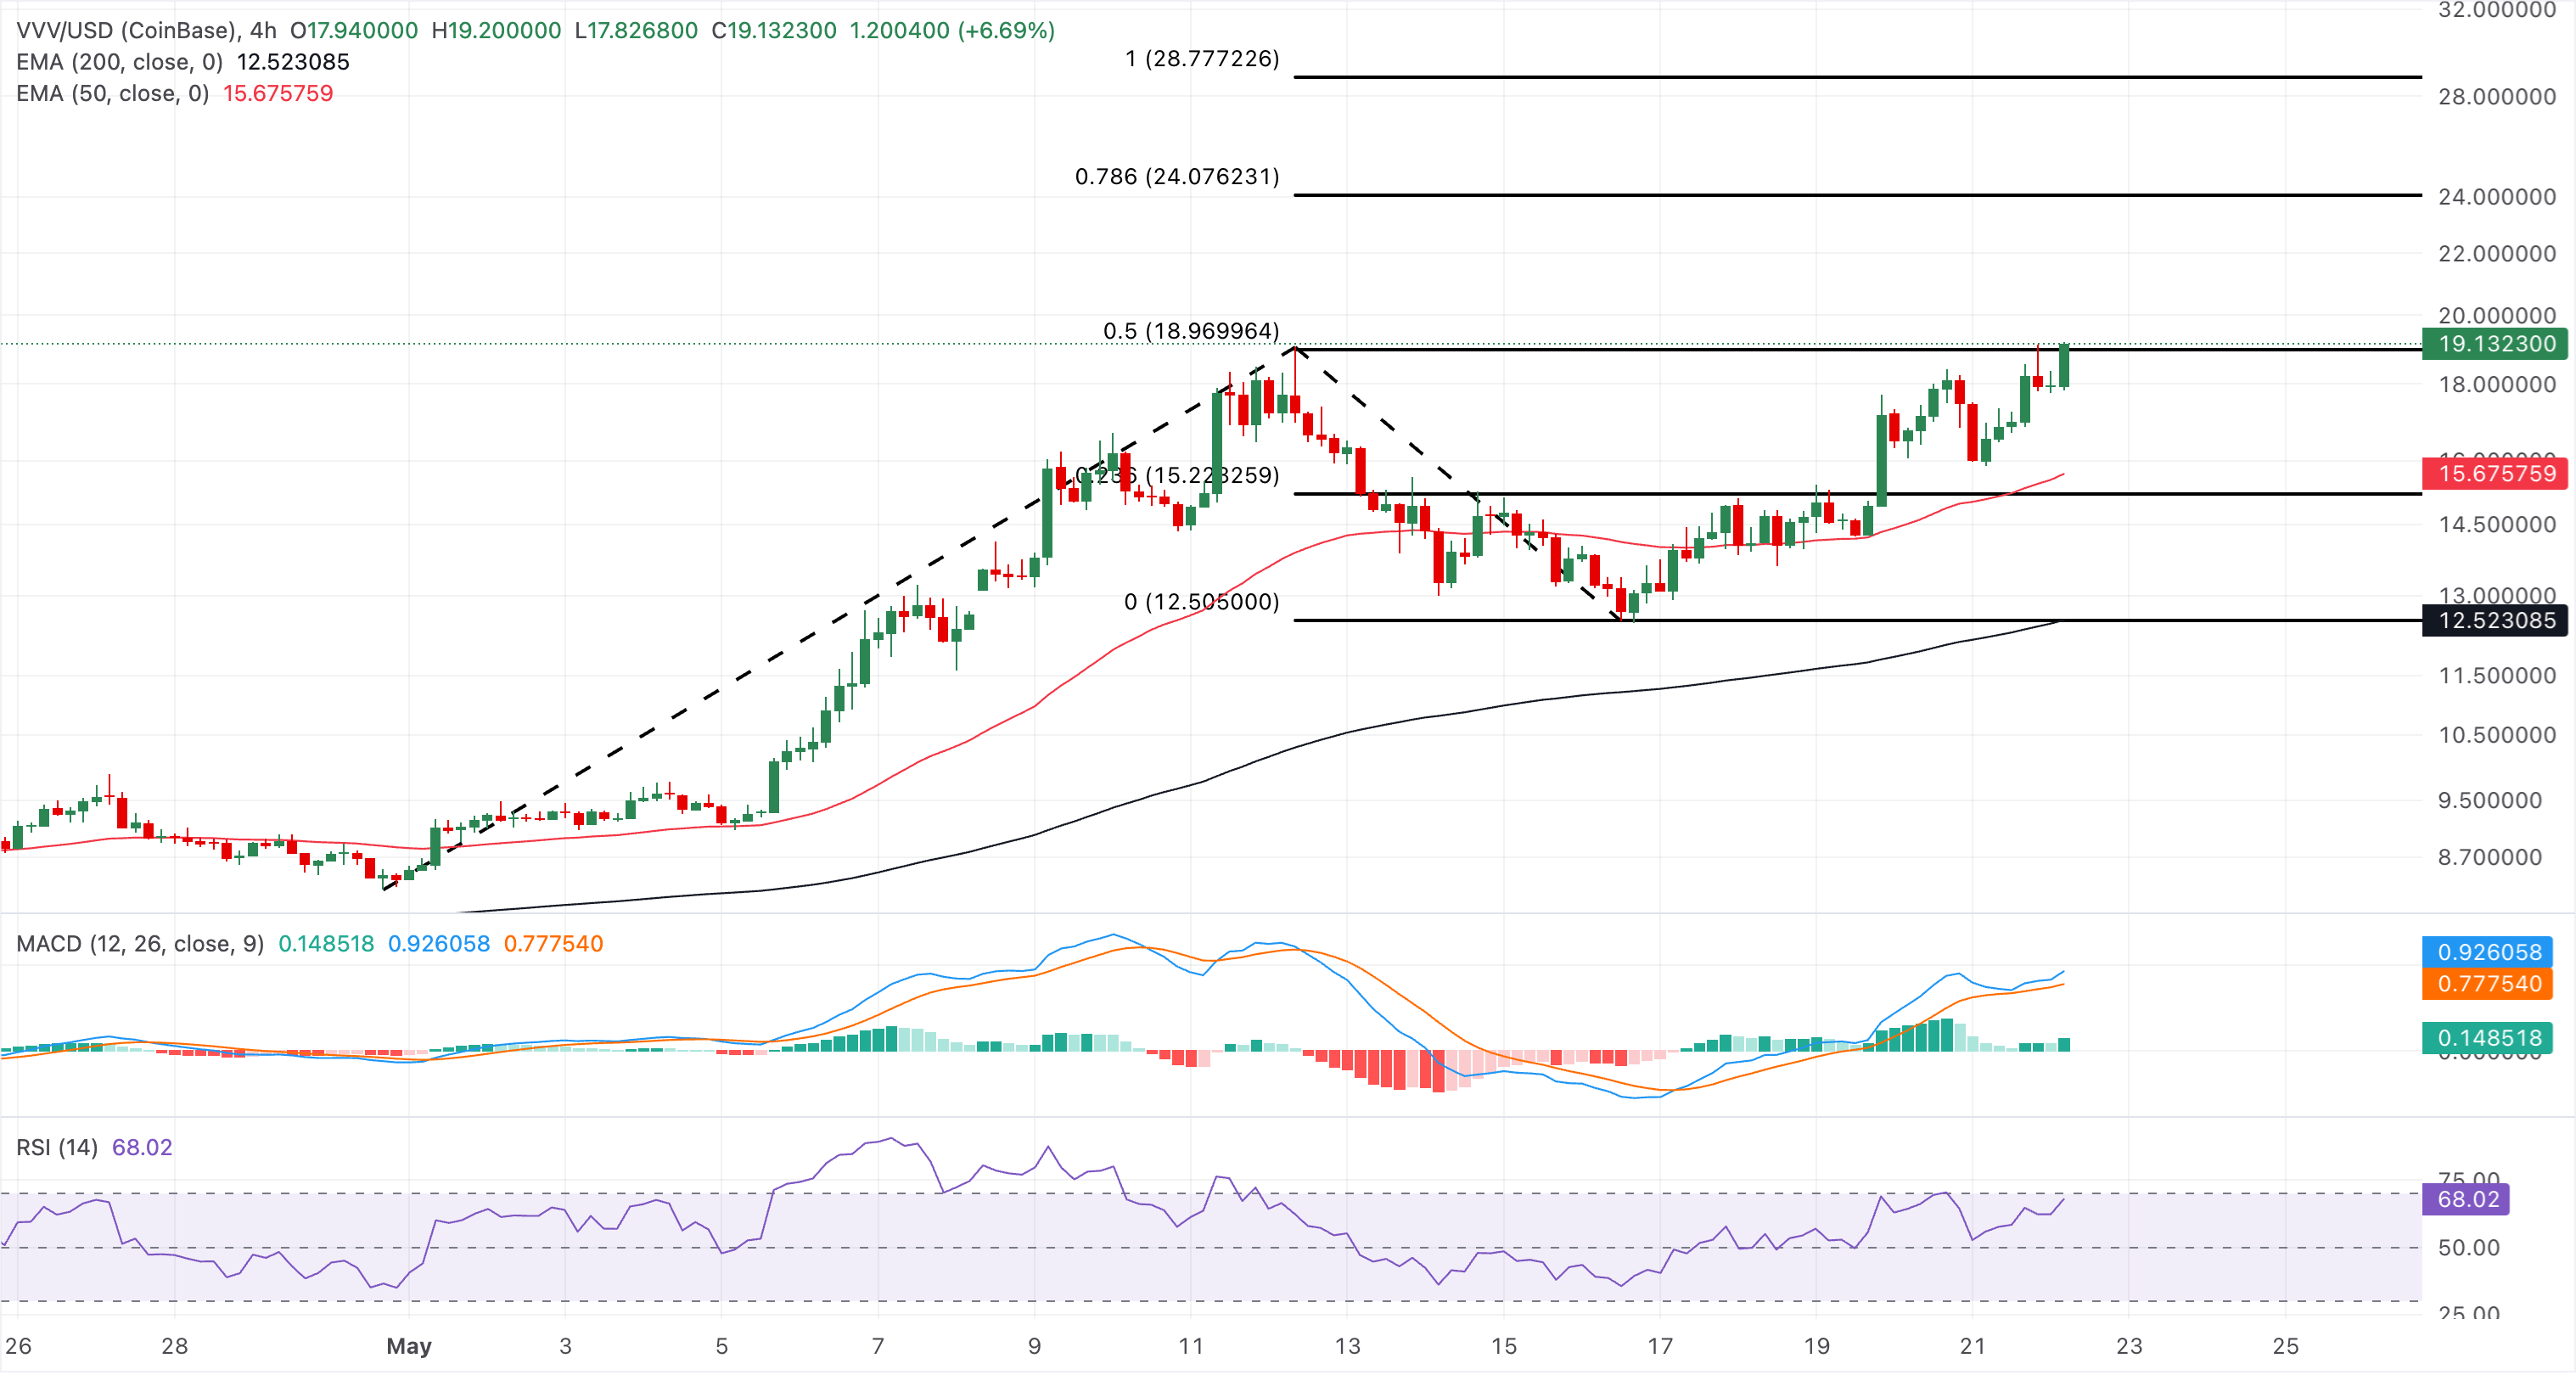
Looking down, the 50-period EMA at $15.67 serves as immediate support, where buyers could absorb short-term pullbacks.
(The technical analysis of this story was written with the help of an AI tool.)

超過一百萬用戶依賴 FXStreet 獲取即時市場數據、圖表工具、專家洞見與外匯新聞。其全面的經濟日曆與教育網路研討會協助交易者保持資訊領先、做出審慎決策。FXStreet 擁有約 60 人的團隊,分布於巴塞隆納總部及全球各地。
閱讀更多


