
Crypto Overview: Hyperliquid rallies on strong ETF inflows, Dash and Zcash follow suit
作者 Vishal Dixit
更新: 21 May 2026


熱門文章

Bitcoin (BTC) is trading above $77,000 at press time on Thursday, easing downside pressure amid the wipeout of $180 million in crypto shorts over the last 24 hours.
- Bitcoin shows mild recovery above $77,000 on Thursday, easing downside pressure on altcoins.
- Mild recovery wipes out over $180 million in crypto shorts, signaling a near-term tilt toward the buy side.
- Hyperliquid, Dash, and Zcash are leading the rally over the last 24 hours.
Bitcoin (BTC) is trading above $77,000 at press time on Thursday, easing downside pressure amid the wipeout of $180 million in crypto shorts over the last 24 hours. In the same period, Hyperliquid (HYPE), Dash (DASH), and Zcash (ZEC) led the broader market rally on intense Exchange Traded Fund (ETF) inflows and renewed demand for privacy coins.
Mild recovery in Bitcoin eases broader market stress
Bitcoin trades above $77,000 on Thursday, extending gains from the previous day. The near-term recovery with a rebound from its 50-day Exponential Moving Average (EMA) suggests a reversal to its 200-day EMA around $82,000. Typically, altcoins mimic Bitcoin's recovery following a pullback.
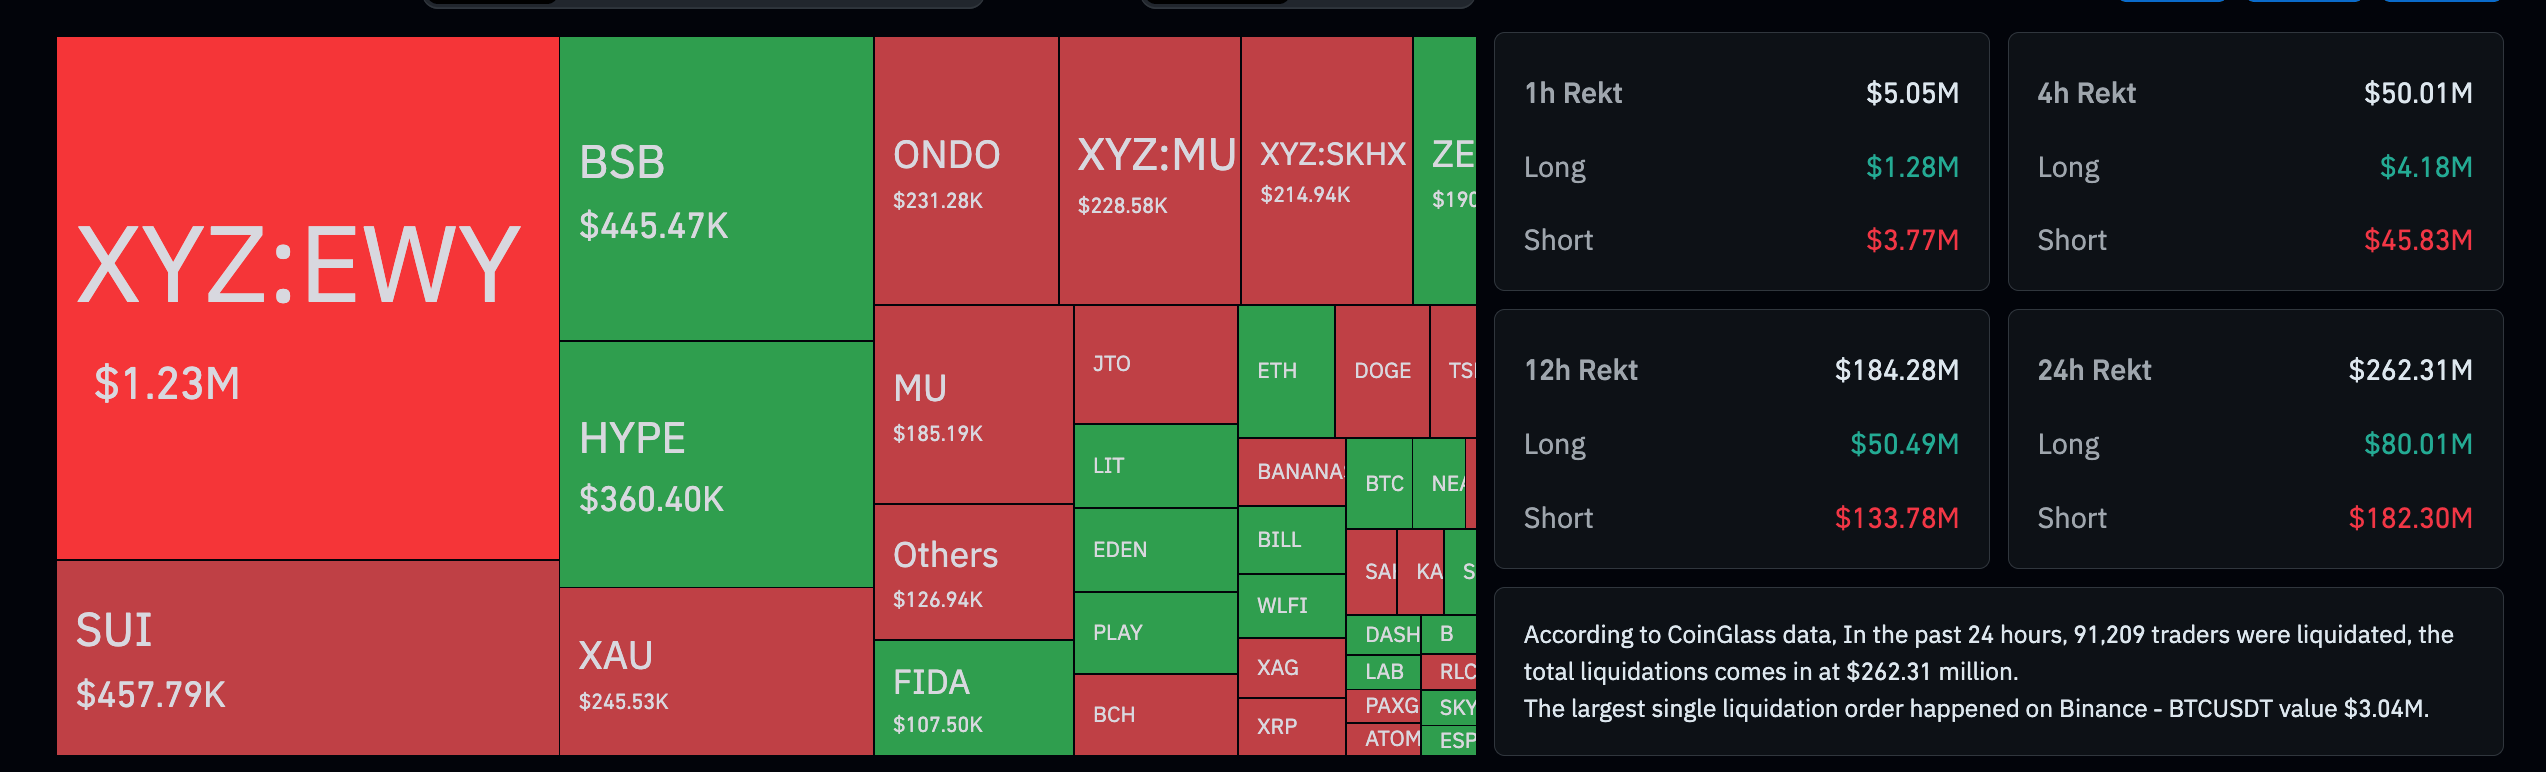
CoinGlass data shows $262 million in total liquidations over the last 24 hours across the market, led by $182 million in short liquidations, pointing to a forced bearish positional wipeout.
Hyperliquid and privacy coins eye further gains
Hyperliquid is extending a strong bullish phase that has reached a seven-month high, driven by recent $22 million in ETF inflows. The everything exchange token holds well above the 50-day EMA at $42.40 and the 200-day EMA at $36.95, which together suggest a firmly established uptrend. The underlying upward-sloping trendline breakout around $53.00 further reinforces the constructive structure.
Momentum remains robust, with the Moving Average Convergence Divergence (MACD) indicator in positive territory and the Relative Strength Index (RSI) hovering in overbought territory near 76, hinting that while buyers are in control, conditions are becoming stretched.
Looking up, the all-time high of $59.45 remains a key resistance level, and a breakout above it would signal a shift into price discovery mode.
On the downside, initial support is seen at the broken trendline around $53.00, followed by R2 and R1 Pivot Points at $51.30 and $45.52, respectively.
DASH hovers around $50 on Thursday after a 20% surge the previous day, maintaining a bullish near-term bias. The privacy coin trades well above the 50-period EMA at $44.48 on the 4-hour chart and the 200-period EMA at $42.05, driven by the hopes of Zcash Orchard Shielded Pool integration.
Bullish momentum is rising, as indicated by a positive MACD and an RSI near 72, which hints at firm buying pressure but signals concerns about overbought conditions.
A sustained break above the 61.8% retracement at about $51.11, measured over the downswing from $58.09 to $39.84, would open the way toward the 78.6% level near $54.18.
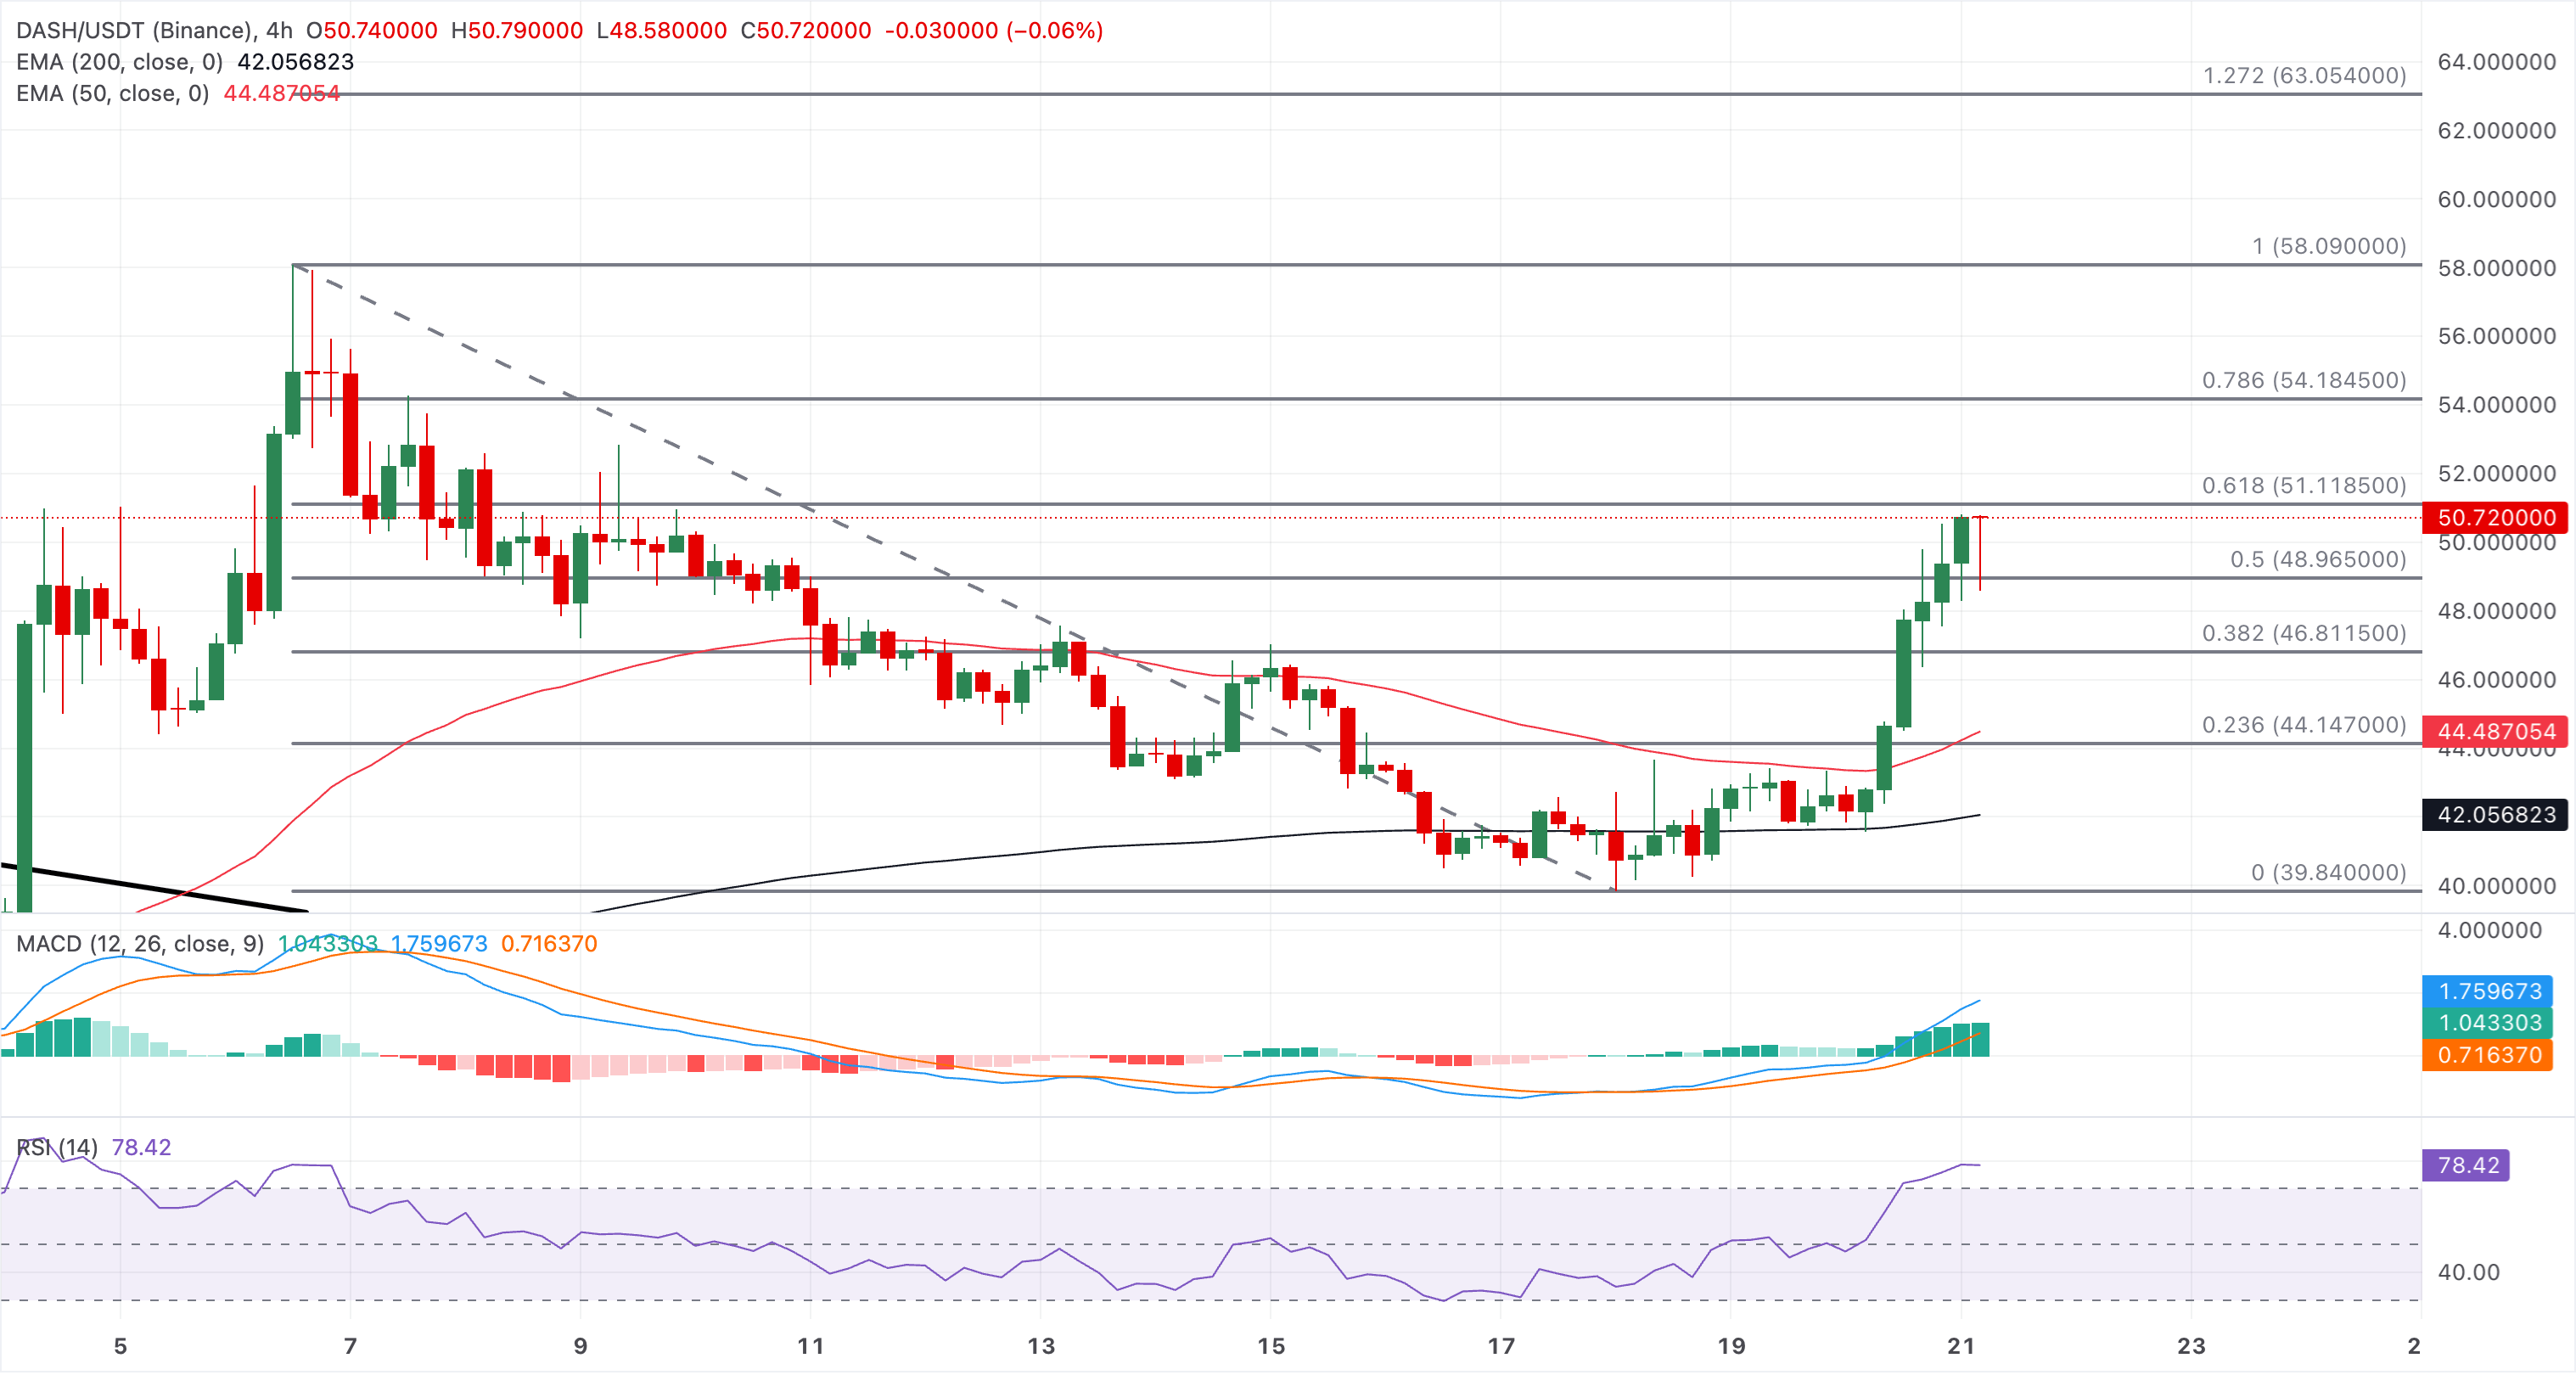
Initial support is seen well lower at the 50% retracement level at $48.96, followed by the 38.2% Fibonacci retracement level at $46.81.
Zcash maintains a clear bullish bias as price trades above $665 on Thursday, well above both the 50-day and 200-day EMAs, clustered around $445 and $335. The privacy coin has also pushed decisively through the 78.6% Fibonacci retracement at $628, measured from $750 to $104, suggesting a steady recovery.
The RSI is around 72, hinting at overbought conditions but still constructive momentum, while the MACD remains in positive territory, suggesting that upside pressure persists despite increasingly stretched conditions.
Looking up, the next meaningful resistance is the recent swing high, aligned with the 100% Fibonacci retracement at $750, where buyers could begin taking profits.
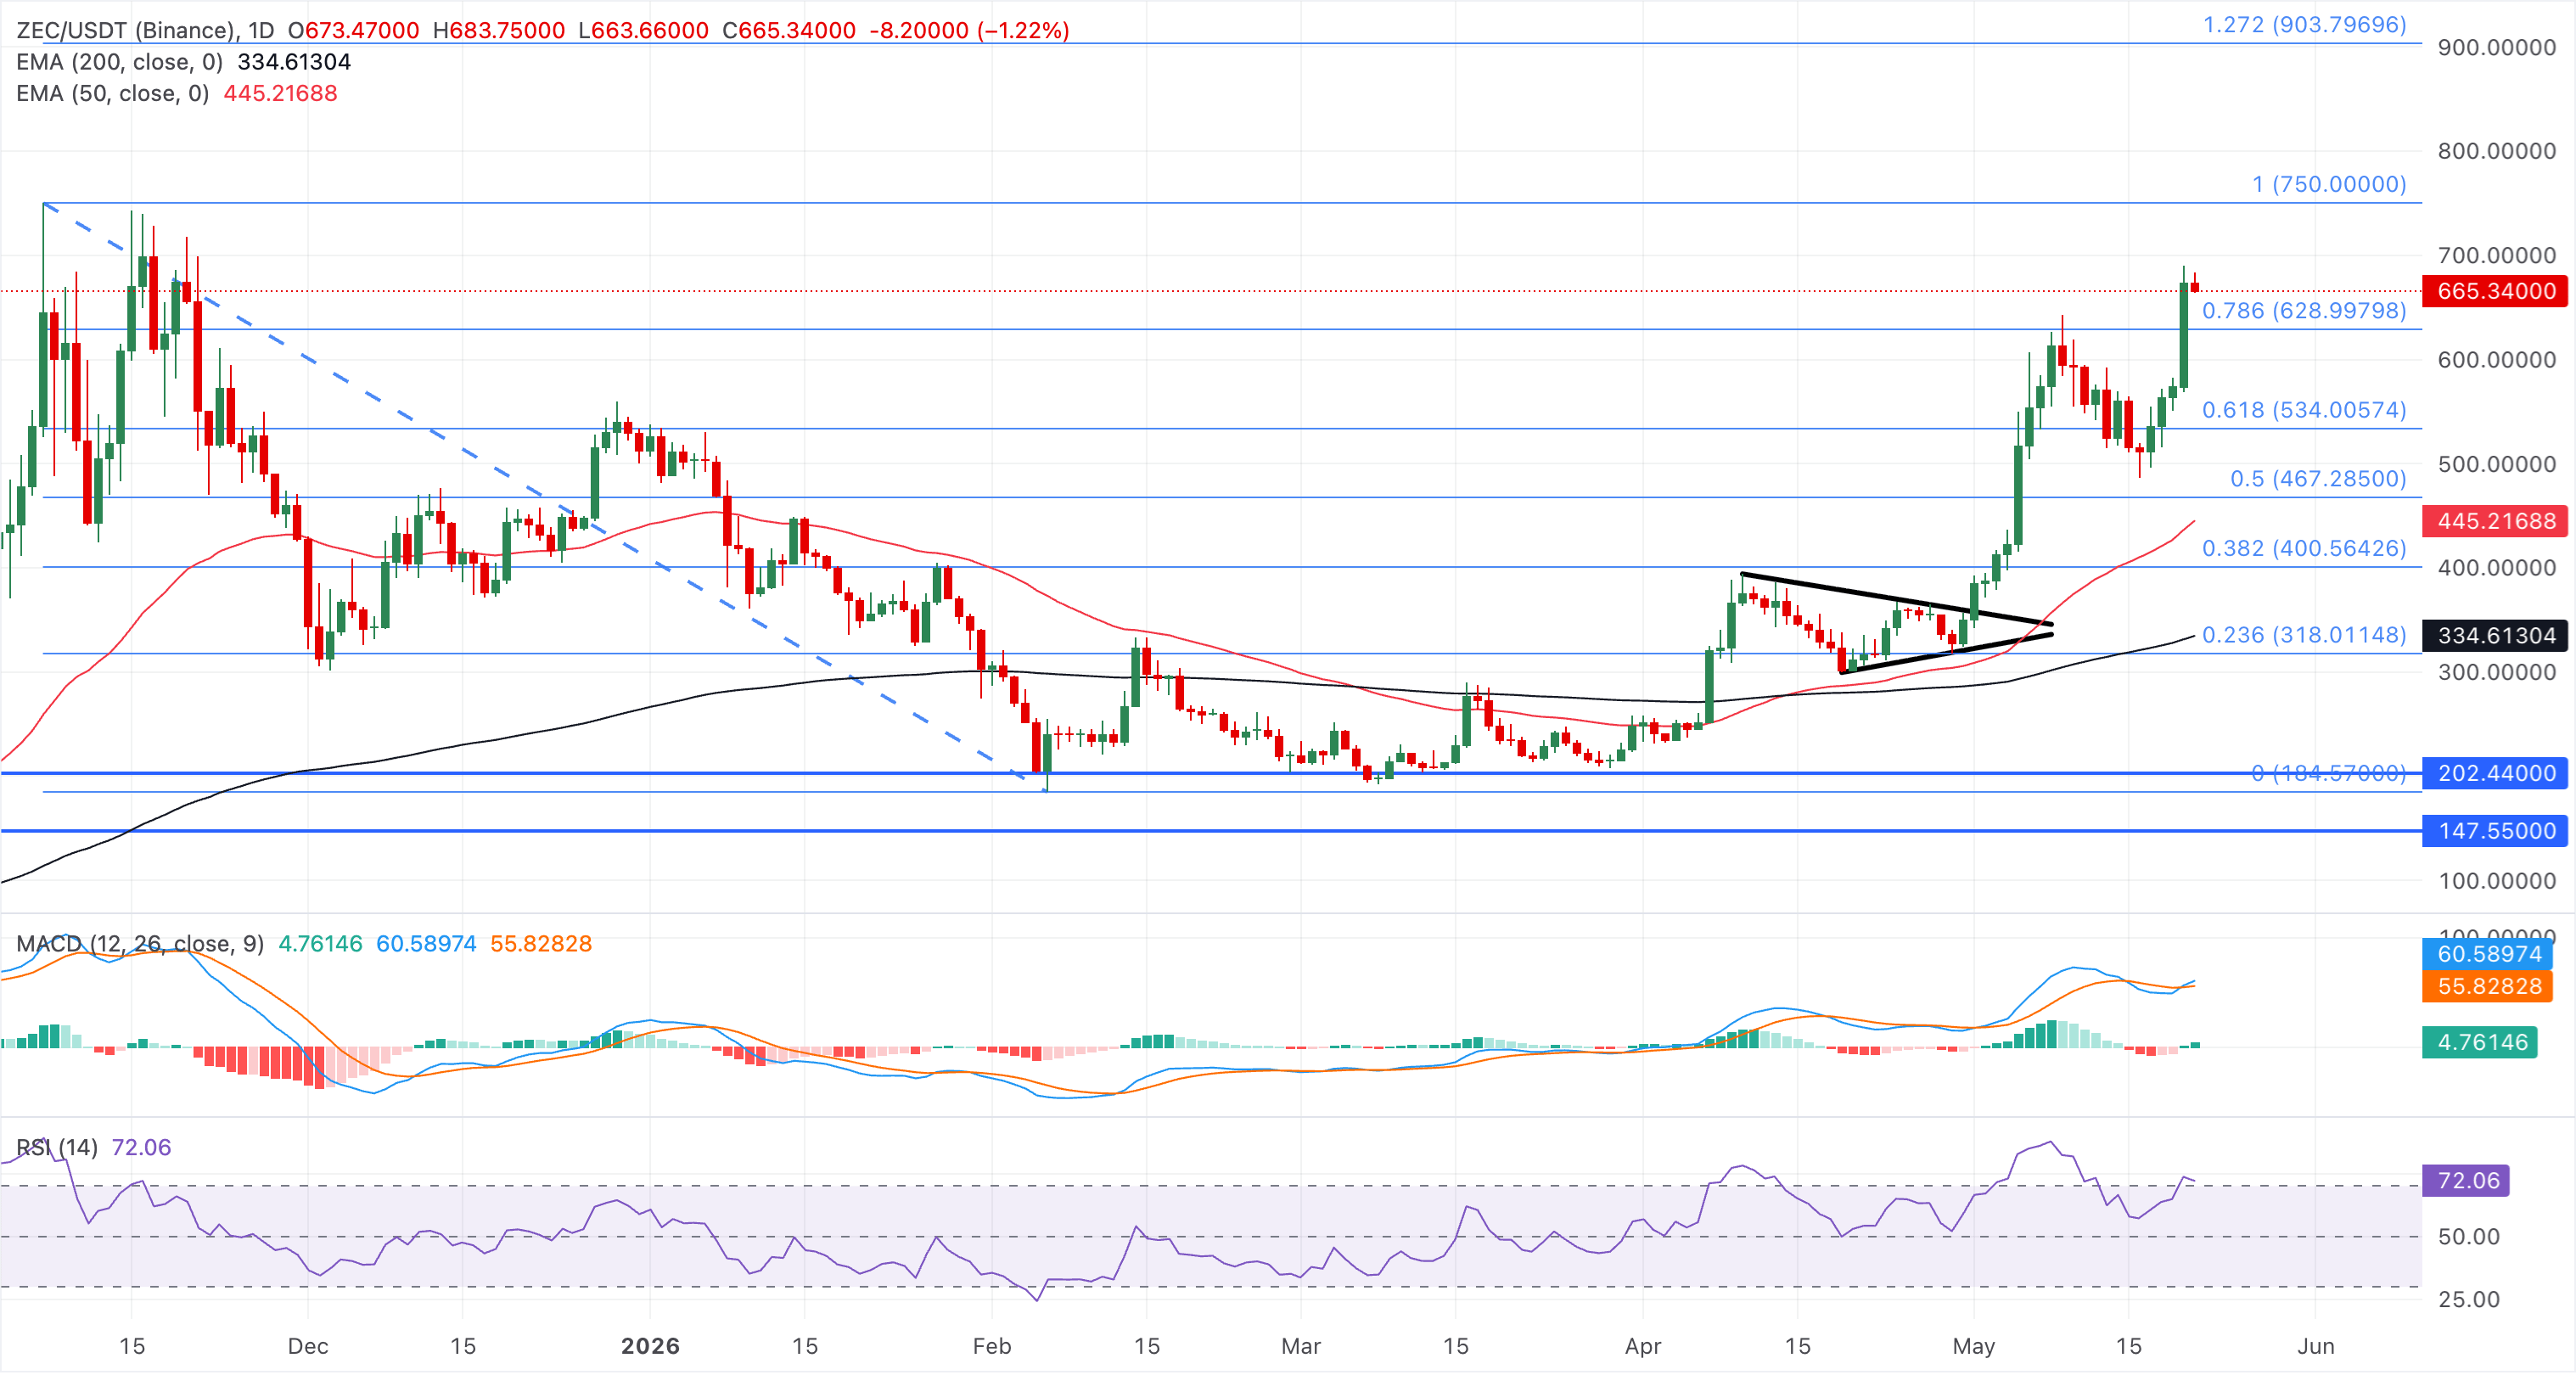
On the downside, initial support lies at the 78.6% retracement at $629, followed by deeper Fibonacci cushions at $534 and $467.
(The technical analysis of this story was written with the help of an AI tool.)

超過一百萬用戶依賴 FXStreet 獲取即時市場數據、圖表工具、專家洞見與外匯新聞。其全面的經濟日曆與教育網路研討會協助交易者保持資訊領先、做出審慎決策。FXStreet 擁有約 60 人的團隊,分布於巴塞隆納總部及全球各地。
閱讀更多


