
Crypto Today: Bitcoin at $60,000, Ethereum at $1,500, and XRP at $1 face a make-or-break test
作者 Vishal Dixit
更新: 26 Jun 2026


熱門文章

Bitcoin (BTC), Ethereum (ETH), and Ripple (XRP) are trading in the red on Friday after three consecutive days of losses, testing their respective make-or-break support levels. The prevailing bearish pressure weighs on the prospects of a rebound despite potential bullish RSI divergences.
- Bitcoin hovers around $60,000 on Friday after three consecutive days of losses, with bears needing a decisive break below to maintain control.
- Ethereum holds above $1,500, with a possible hidden bullish RSI divergence keeping a double-bottom rebound on the table.
- XRP remains above the $1 psychological support, with a RSI divergence suggesting bearish momentum could be fading.
Bitcoin (BTC), Ethereum (ETH), and Ripple (XRP) are trading in the red on Friday after three consecutive days of losses, testing their respective make-or-break support levels. The prevailing bearish pressure weighs on the prospects of a rebound despite potential bullish RSI divergences.
The technical outlook is heavily bearish for Bitcoin, Ethereum, and XRP, as a downside continuation on Friday could offset any rebound potential.
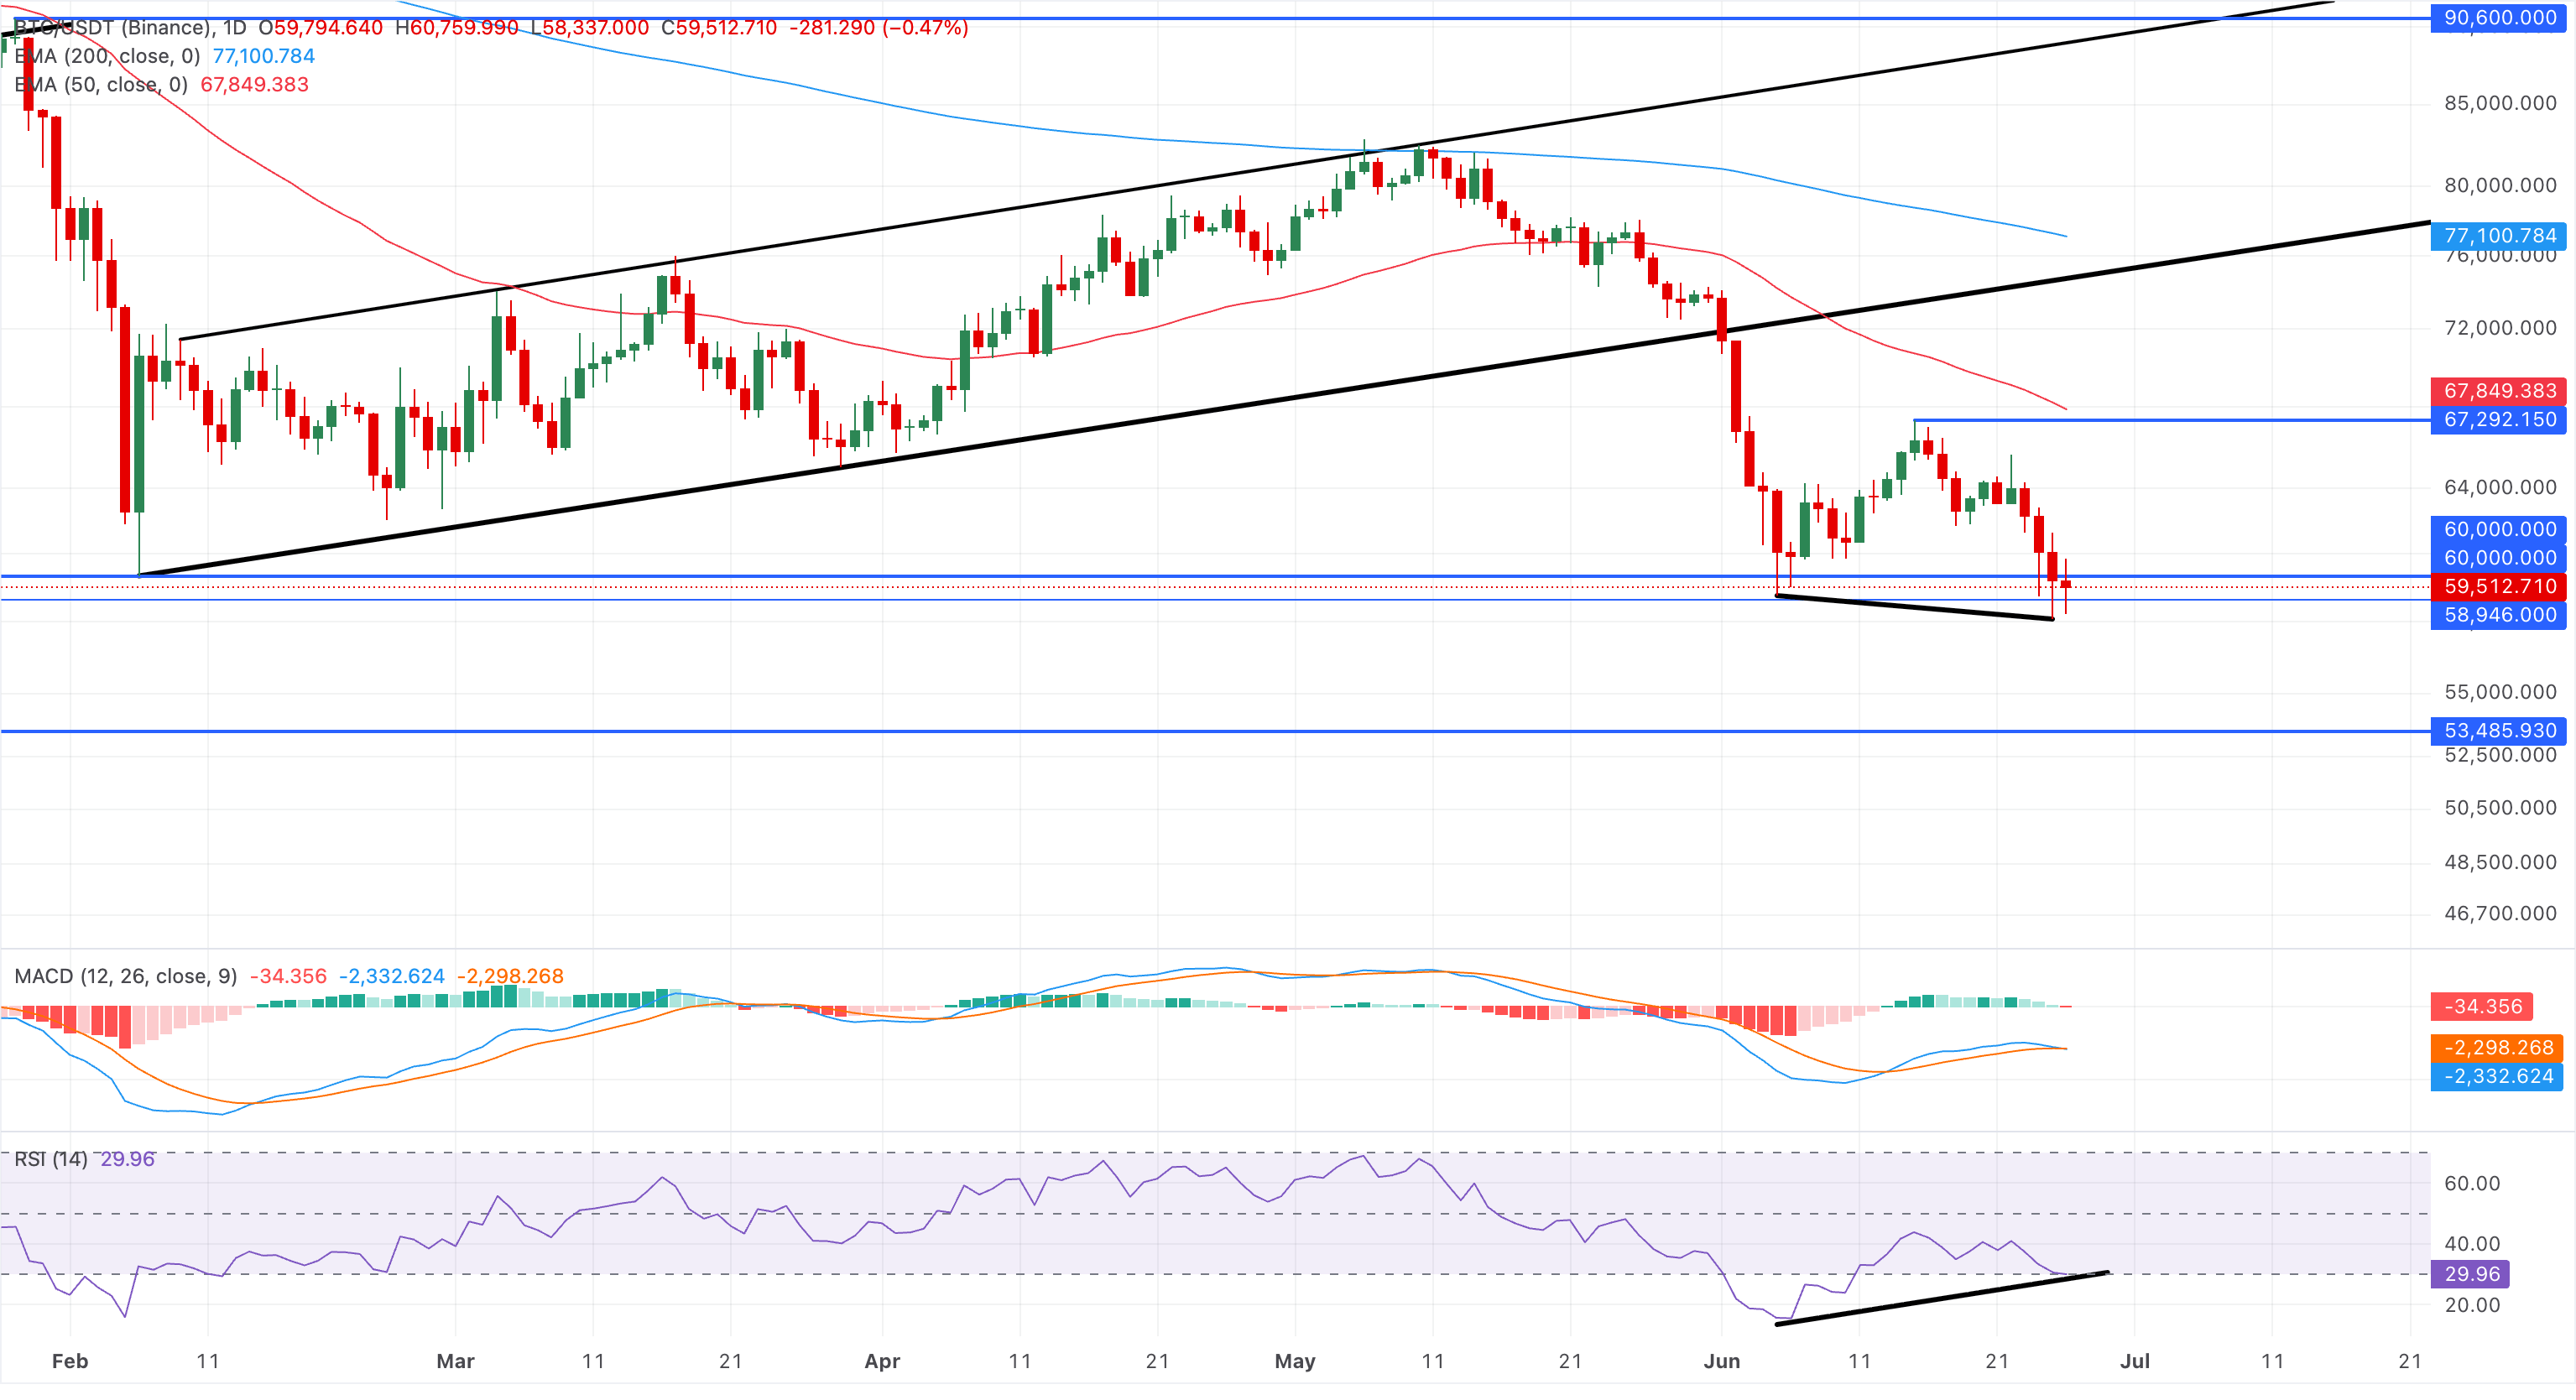
Could Bitcoin pivot from $60,000?
Bitcoin hovers slightly below the $60,000 on Friday, retaining a bearish bias. Still, buying pressure at the key support delays a clear downtrend below this psychological level, while price remains below the 50-day Exponential Moving Average (EMA) at $67,849 and the 200-day EMA at $77,100.
That said, the Moving Average Convergence Divergence (MACD) flattens near its signal line, hinting at waning but still fragile momentum. However, the Relative Strength Index (RSI) hovers just above the oversold threshold near 30, suggesting lingering downside pressure. However, the RSI is higher than during the previous dip to $60,000, signaling bullish divergence. This supports the possibility of a double-bottom reversal in Bitcoin if sellers fail to assert clear dominance.
Looking down, the key support for Bitcoin below $60,000 lies at the July 5, 2024, low of $53,485
On the topside, immediate resistance is at the 50-day EMA around $67,849, reinforcing the broader bearish structure.
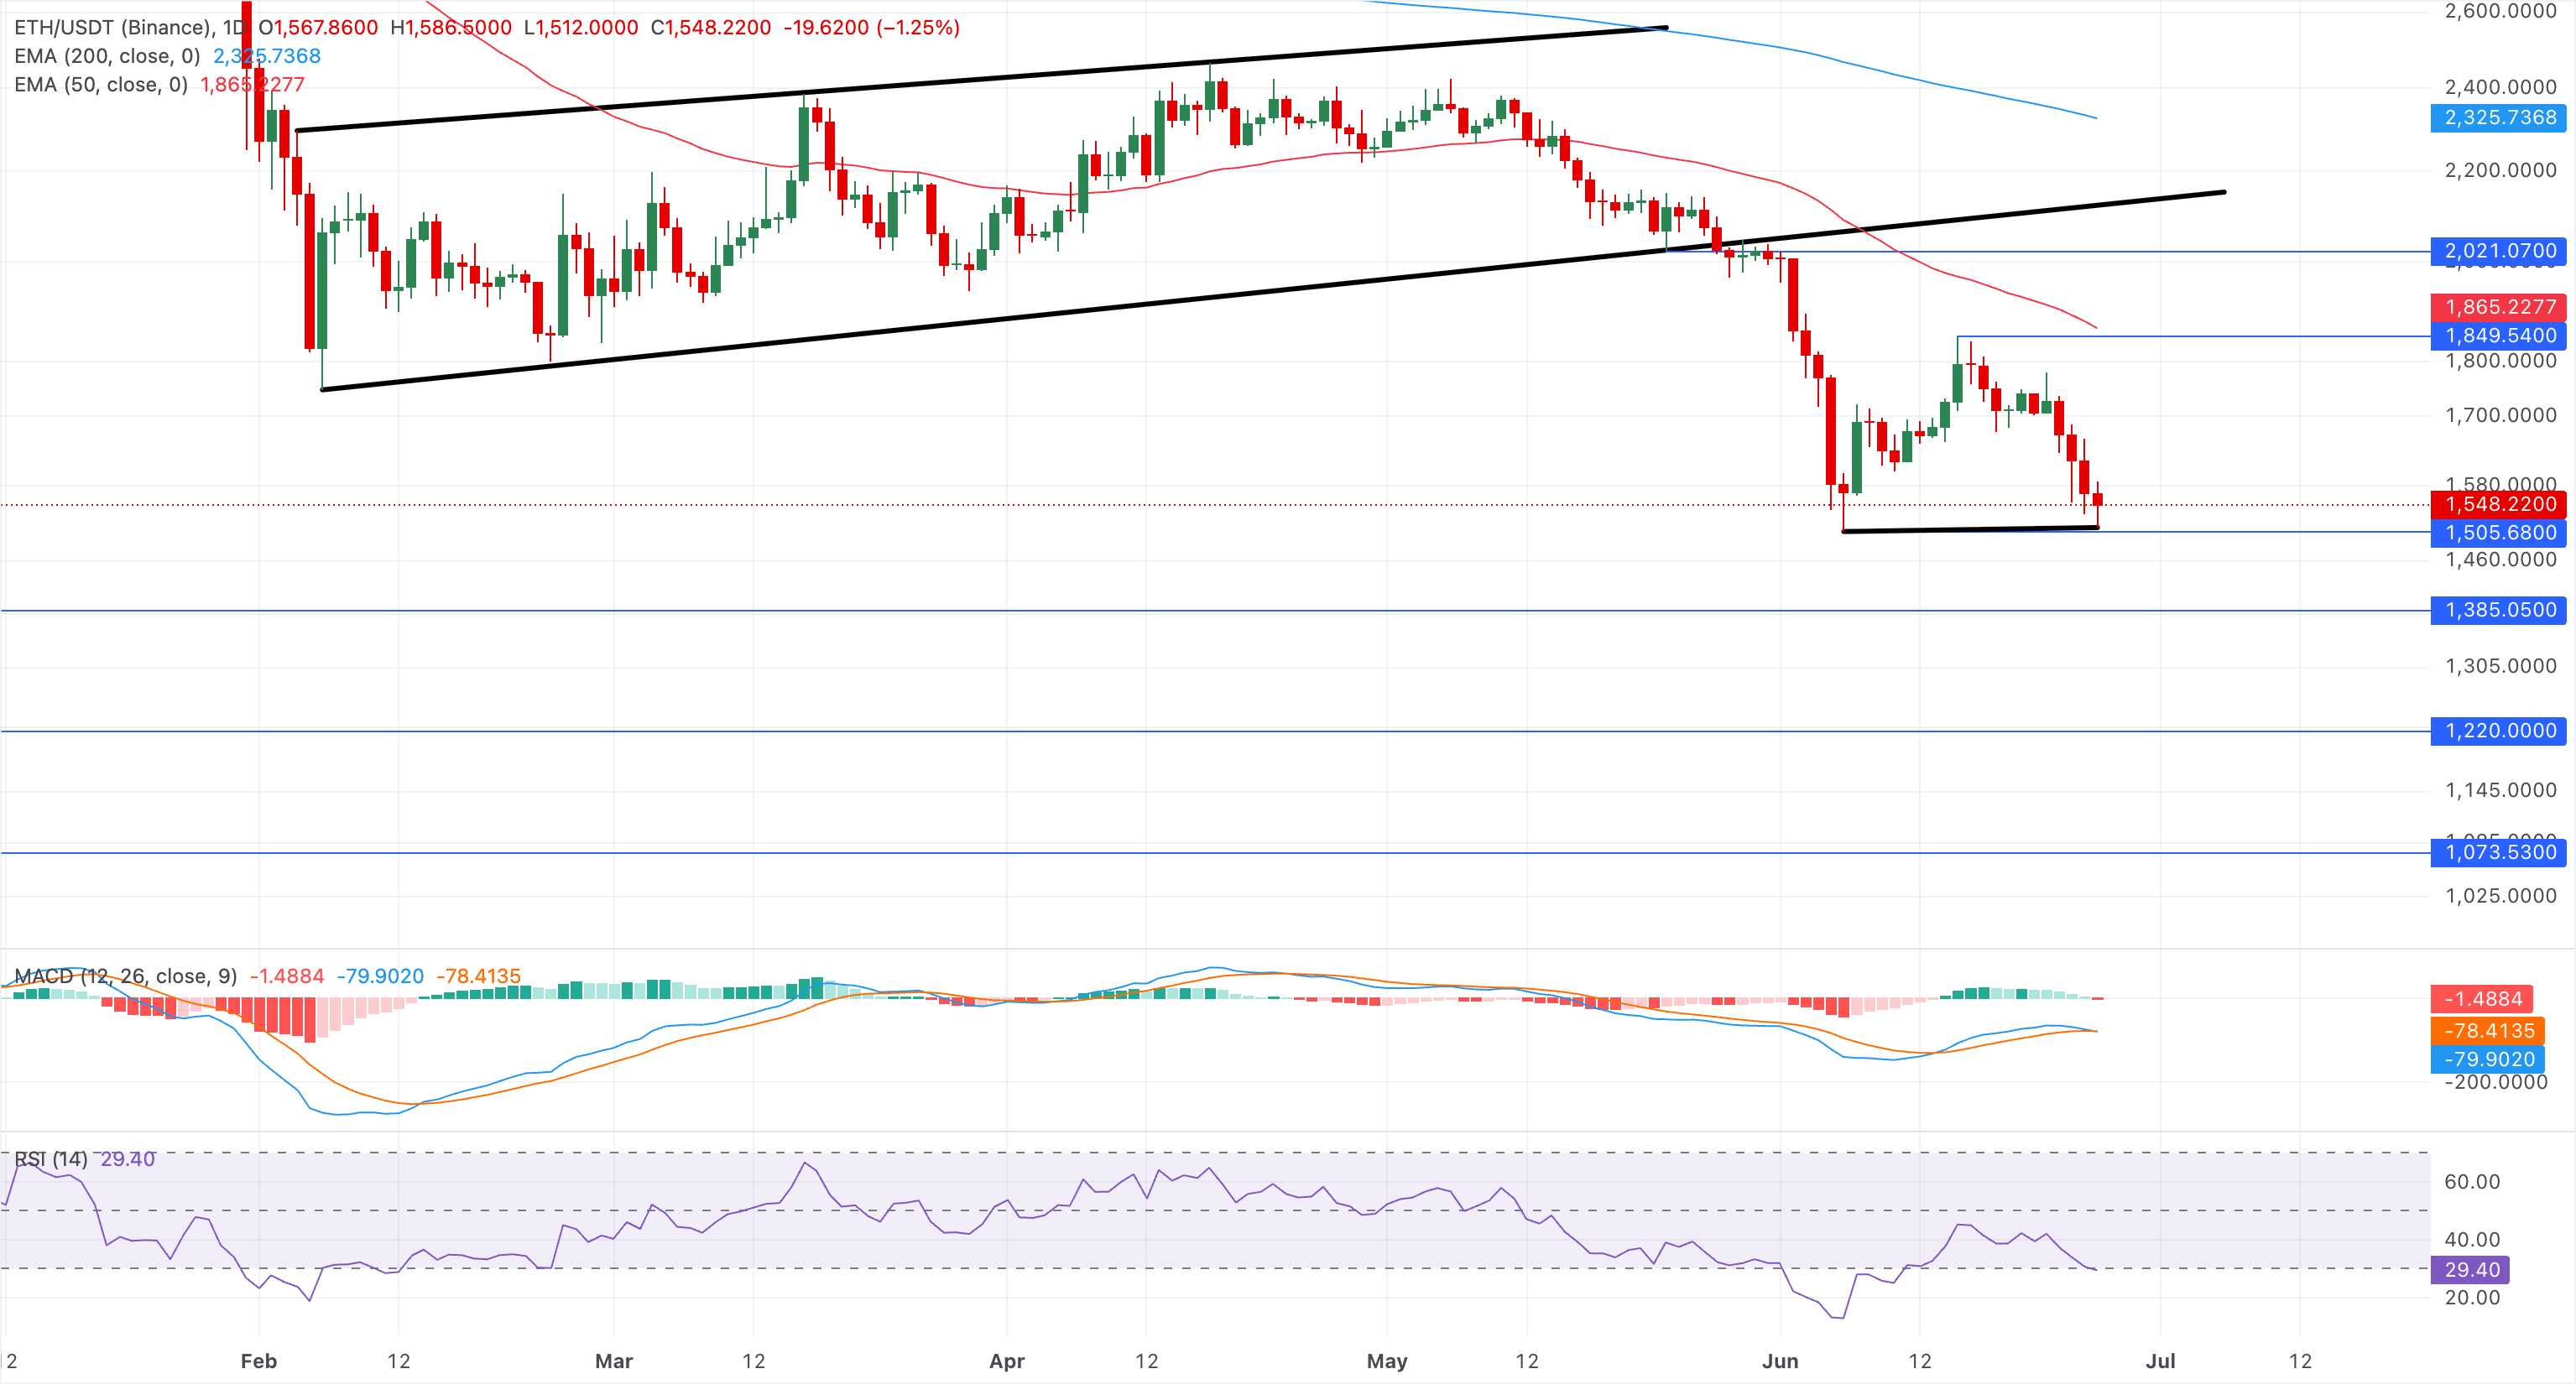
Ethereum defends the last line of defense at $1,500
Ethereum hovers above $1,500 on Friday, extending its losses for the fourth consecutive day. The major altcoin shows a clear bearish bias, with price well below both the 50‑day EMA at $1,865 and the 200‑day EMA at $2,325.
From a technical perspective, Ethereum's hold above its June 6 low of $1,505 keeps the possibility of a potential double-bottom formation on the table if buying pressure remains firm. A rebound in ETH should clear the June 15 high at $1,849 and the 50-day EMA at $1,865 to confirm the bullish breakout.
The RSI at 29 reflects an oversold condition, but the higher reading compared to the June 6 low of 12 suggests a possible hidden bullish divergence. Still, the MACD and signal line remain at risk of a bearish crossover, reaffirming the sell-side dominance.
A slip below $1,500 could extend the decline toward the April 9, 2025, low of $1,385, marking a 14-month low.
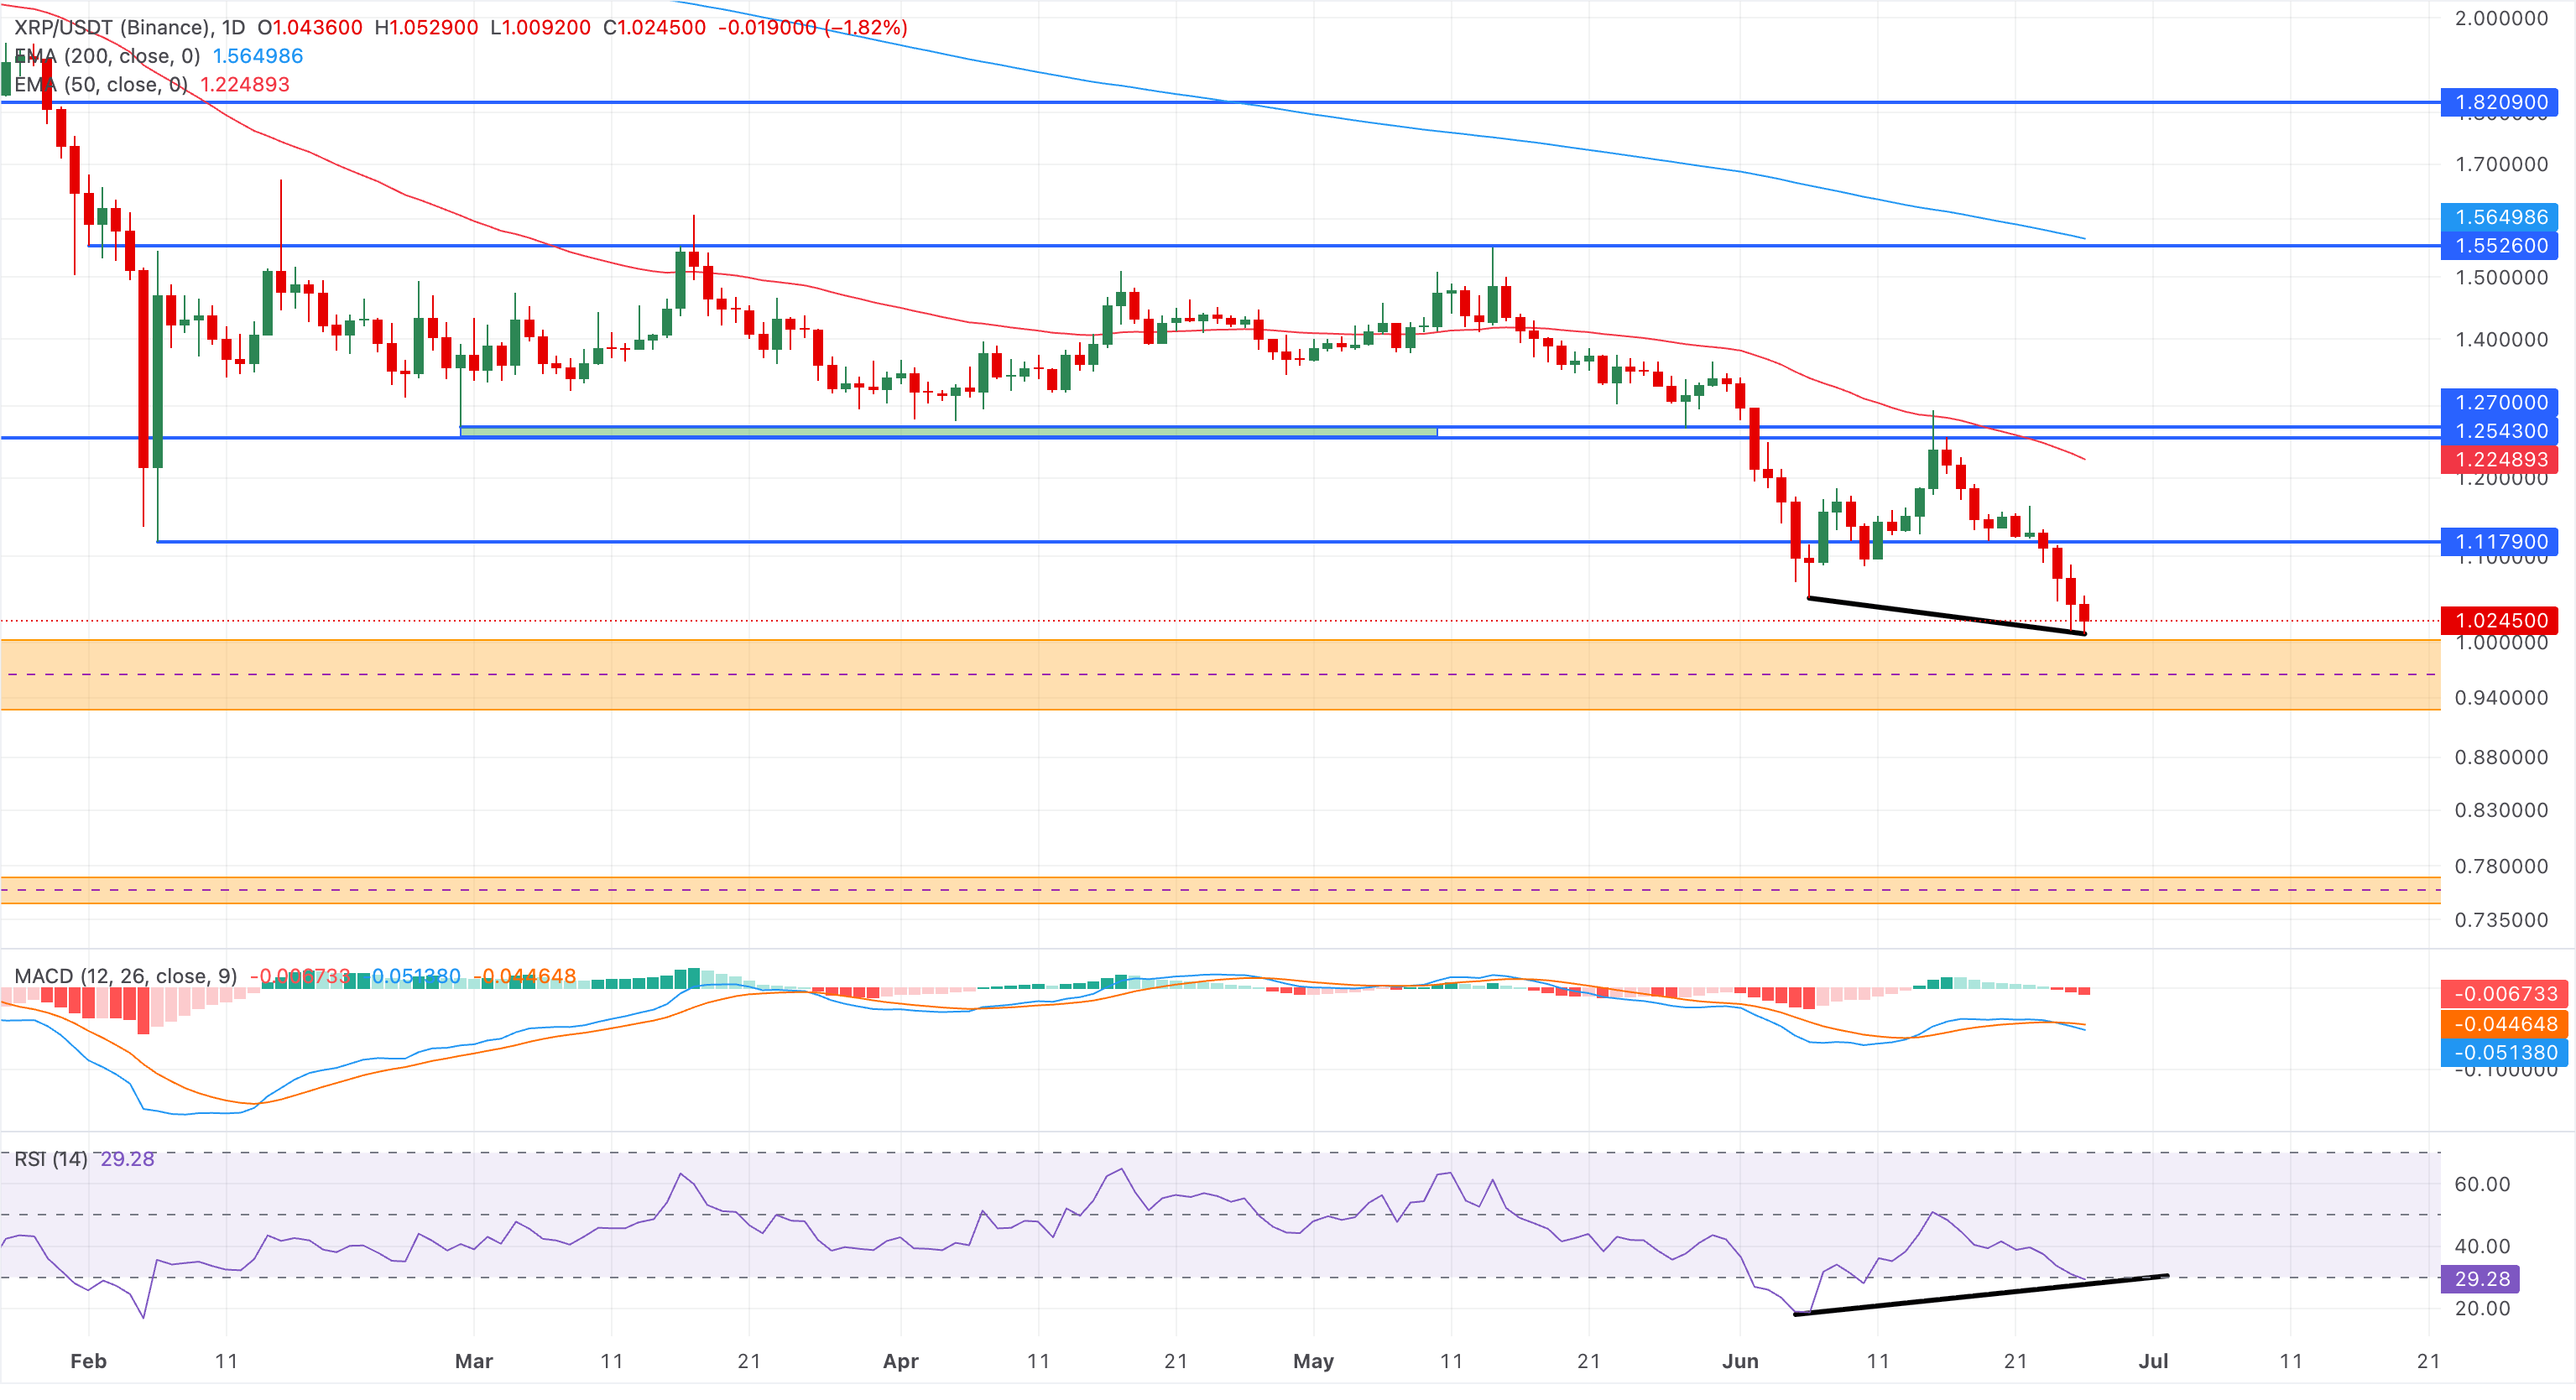
Ripple stands at a crossroads
Ripple trades around $1.03 at press time on Friday, maintaining a steady decline after the 50-day EMA capped its recovery around $1.28 on June 15. The reversal in XRP now extends toward the $1.00 psychological support, which forms a Fair Value Gap (FVG) between $0.92 and $1.00.
The consistent lower-price rejection in daily candles reflects minor dip-buying pressure, while the RSI shows a clear bullish divergence, hinting at a potential double-bottom rebound. However, the MACD is trending below its signal line, suggesting a short-term bearish bias.
Looking up, a rebound in XRP price above the February 6 low of $1.11 could extend its recovery to the 50-day EMA at $1.22.
However, a daily close below $1.00 could trigger a steeper correction toward the lower FVG support at $0.92, followed by the next FVG at around $0.77.
(The technical analysis of this story was written with the help of an AI tool.)

超過一百萬用戶依賴 FXStreet 獲取即時市場數據、圖表工具、專家洞見與外匯新聞。其全面的經濟日曆與教育網路研討會協助交易者保持資訊領先、做出審慎決策。FXStreet 擁有約 60 人的團隊,分布於巴塞隆納總部及全球各地。
閱讀更多


