
Dogecoin Price Forecast: Rally nears key resistance as overbought signals emerge
作者 Vishal Dixit
更新: 5 May 2026


熱門文章

Dogecoin (DOGE) maintains a steady rise above $0.1100 at press time on Tuesday, extending the roughly 10% gains from the previous week. The meme coin is losing retail confidence in the derivatives market despite the broader market sentiment improving.
- Dogecoin extends gains above $0.1100 on Tuesday, approaching a key resistance to test upside breakout.
- DOGE futures are losing retail confidence, with Open Interest down 4% over the past 24 hours.
- Dogecoin should clear the $0.1160 zone for an extended recovery, while the RSI signals an overbought condition.
Dogecoin (DOGE) maintains a steady rise above $0.1100 at press time on Tuesday, extending the roughly 10% gains from the previous week. The meme coin is losing retail confidence in the derivatives market despite the broader market sentiment improving. The technical outlook is cautiously bullish for DOGE, with bulls aiming to surpass the $0.1160 resistance zone amid overbought conditions that signal reversal risk.
Demand falters in Dogecoin derivatives
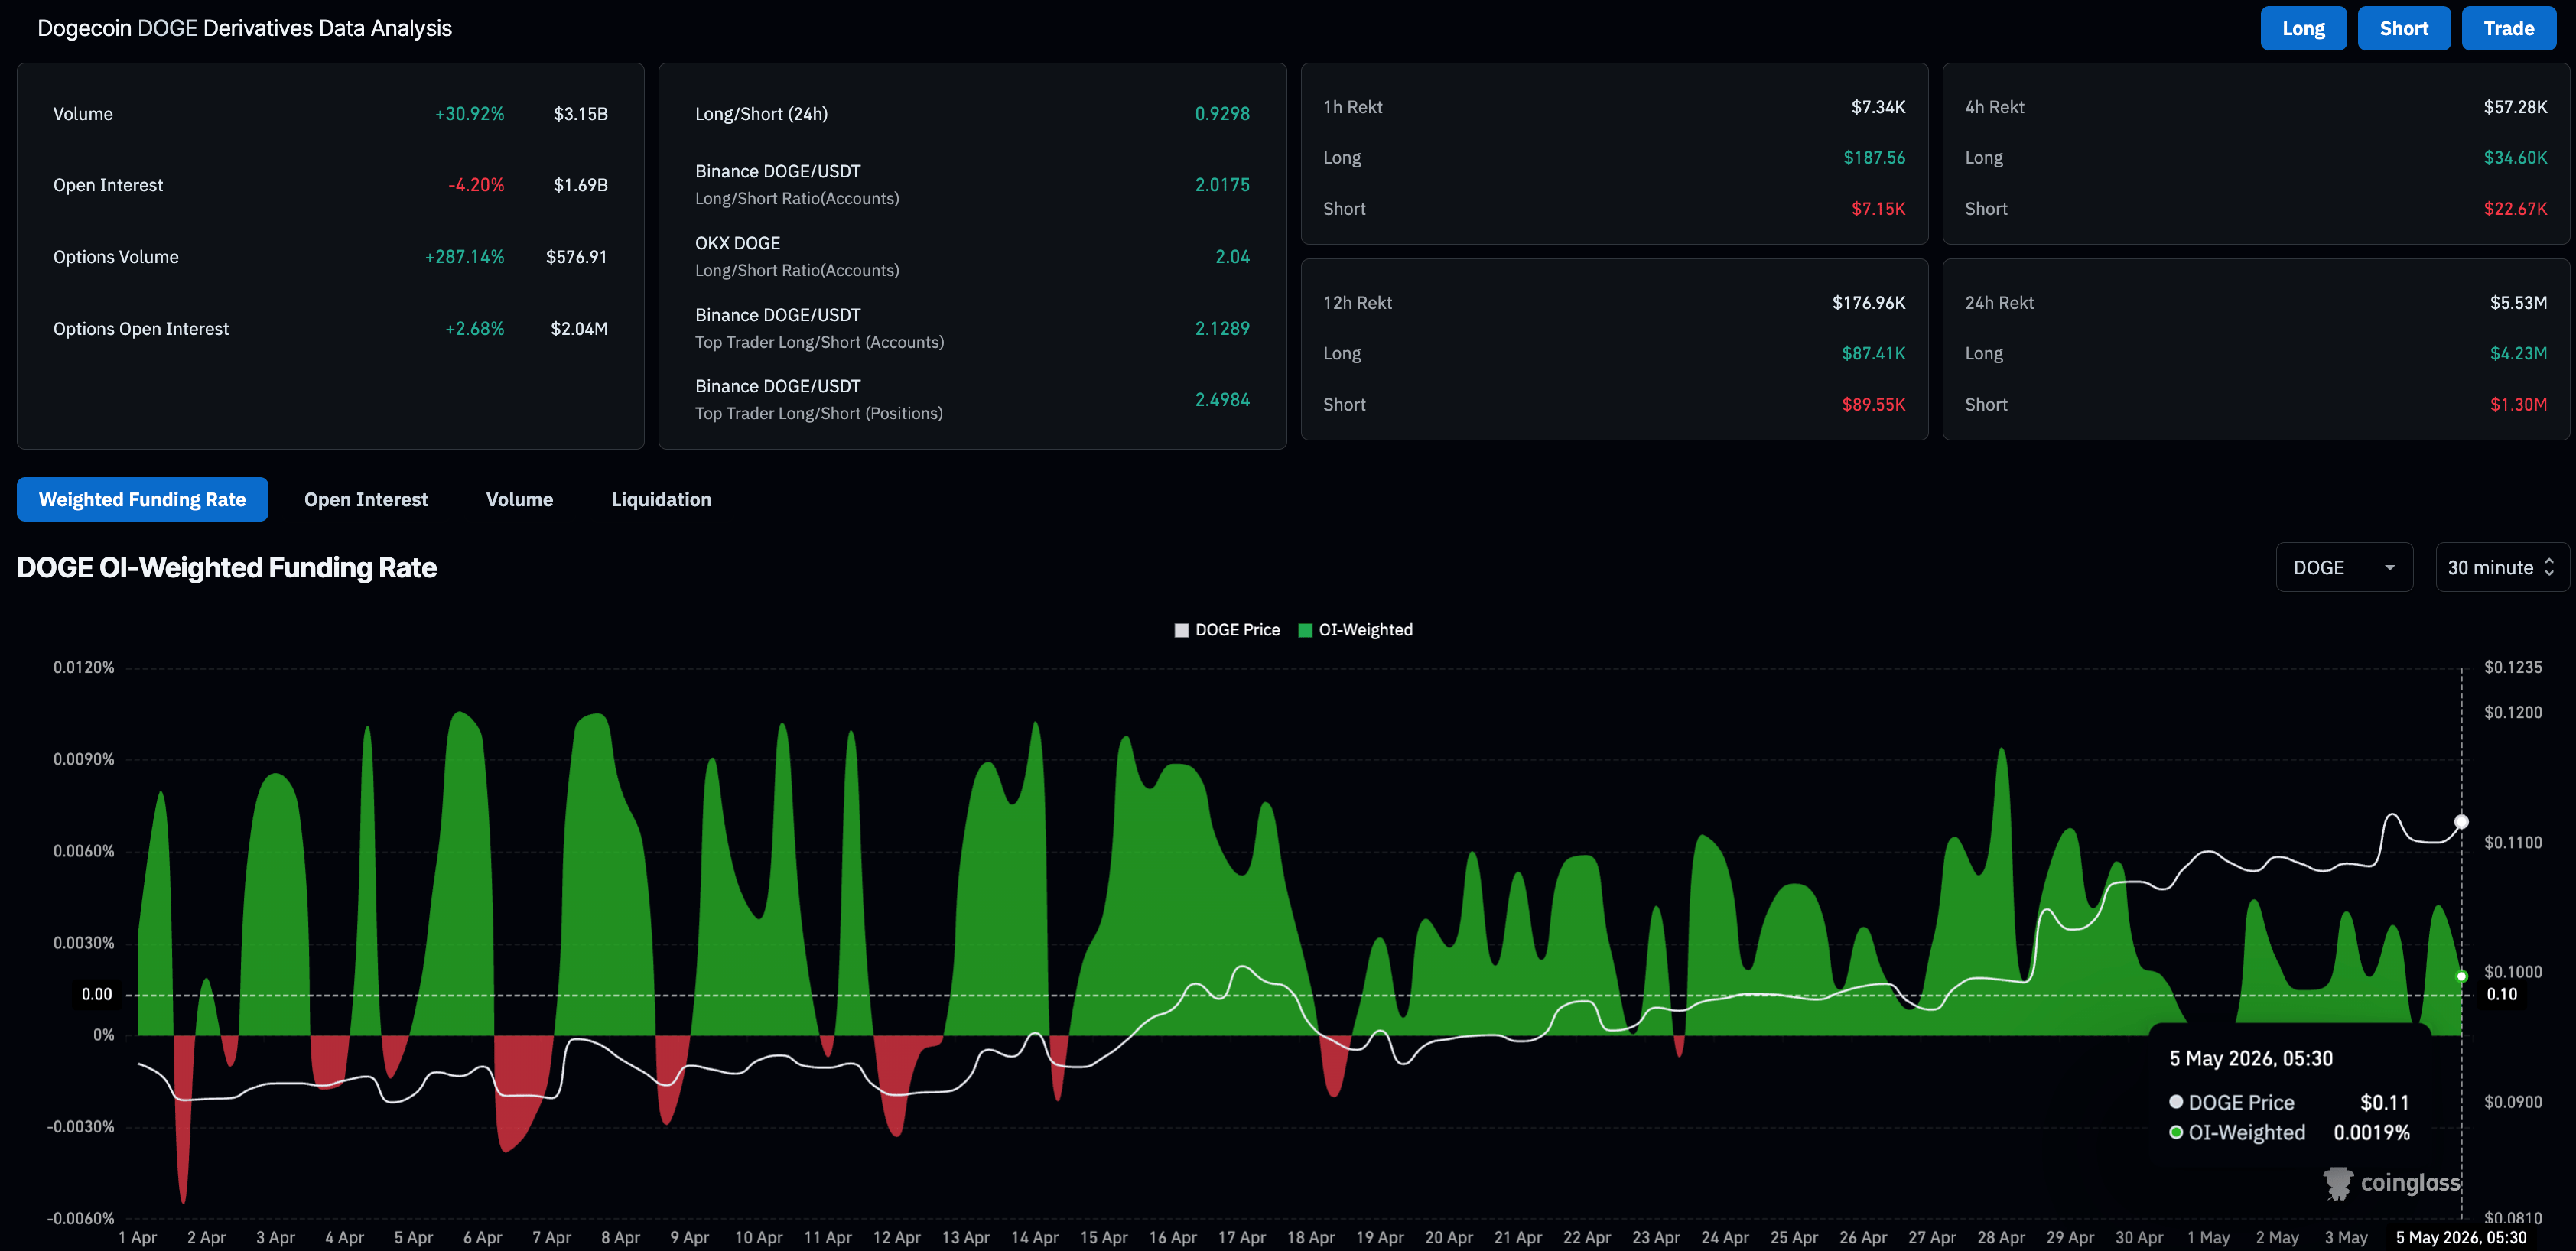
Dogecoin derivatives are facing a positional wipeout, signaling reduced risk appetite among traders. CoinGlass data shows the DOGE futures Open Interest (OI) is down over 4% in the last 24 hours to $1.69 billion, indicating a reduced notional value of outstanding contracts.
Meanwhile, the drop in the OI-weighted funding rate to 0.0019% from 0.0043% at the peak on Monday indicates reduced bullish interest among traders in holding long positions.
Will Dogecoin price exceed $0.12?
Dogecoin trades around $0.1115 at press time on Tuesday, extending a bullish near‑term bias as price holds above the 50-day Exponential Moving Average (EMA) at $0.0993 while remaining capped well below the 200-day EMA at $0.1254.
The breakaway from the 50-day EMA suggests improving underlying demand, but the Relative Strength Index (RSI) at 76 signals overbought conditions, hinting that upside momentum reflected in the Moving Average Convergence Divergence (MACD) could be prone to consolidation or a corrective pause before any sustained test of higher levels.
On the topside, the supply zone near $0.1160, previously tested on February 15, is the next notable resistance and a key barometer for assessing whether the broader downtrend is being challenged. A break above this zone could test the 200-day EMA at $0.1254, the next notable resistance.
On the downside, immediate support lies at the $0.1000 psychological threshold, with stronger technical backing at the 50-day EMA around $0.0993, where buyers would be expected to regroup on a deeper pullback.
(The technical analysis of this story was written with the help of an AI tool.)

超過一百萬用戶依賴 FXStreet 獲取即時市場數據、圖表工具、專家洞見與外匯新聞。其全面的經濟日曆與教育網路研討會協助交易者保持資訊領先、做出審慎決策。FXStreet 擁有約 60 人的團隊,分布於巴塞隆納總部及全球各地。
閱讀更多


