
EUR/USD Price Forecast: Consolidates around 1.1530 in countdown to Trump’s deadline
作者 Sagar Dua
更新: 7 Apr 2026


熱門文章

The EUR/USD pair ticks marginally lower around 1.1530 during the Asian trading session on Tuesday, but is broadly sideways, wobbling inside Monday’s trading range.
- EUR/USD edges lower to near 1.1530 while investors remain uncertain over Iran’s final decision to the US proposal.
- Iran calls on US President Trump to surrender or his allies will return to the Paleolithic Age.
- The US FOMC minutes of the March policy meeting will be released on Wednesday.
The EUR/USD pair ticks marginally lower around 1.1530 during the Asian trading session on Tuesday, but is broadly sideways, wobbling inside Monday’s trading range. The major currency pair consolidates while investors await Iran’s final decision on the ceasefire proposal by the United States (US), which has a deadline of Tuesday, 08:00 PM ET.
As of writing, the US Dollar Index (DXY), which tracks the Greenback’s value against six major currencies, trades slightly higher to near 100.10.
Ahead of US President Donald Trump’s deadline, an advisor to Iran's Parliament Speaker Mohammad Bagher Ghalibaf has stated that Trump has about 20 hours to either surrender to Iran or his allies will return to the Paleolithic Age, emphasizing that Tehran will not back down. He called Trump’s threats “delusional” and added that they won’t make up for the “disgrace and humiliation” of the US in the region.
On the domestic front, investors await the release of the Federal Open Market Committee (FOMC) minutes of the March policy meeting, which will be released on Wednesday. In the meeting, the Fed left interest rates unchanged in the range of 3.50%-3.75%.
EUR/USD technical analysis
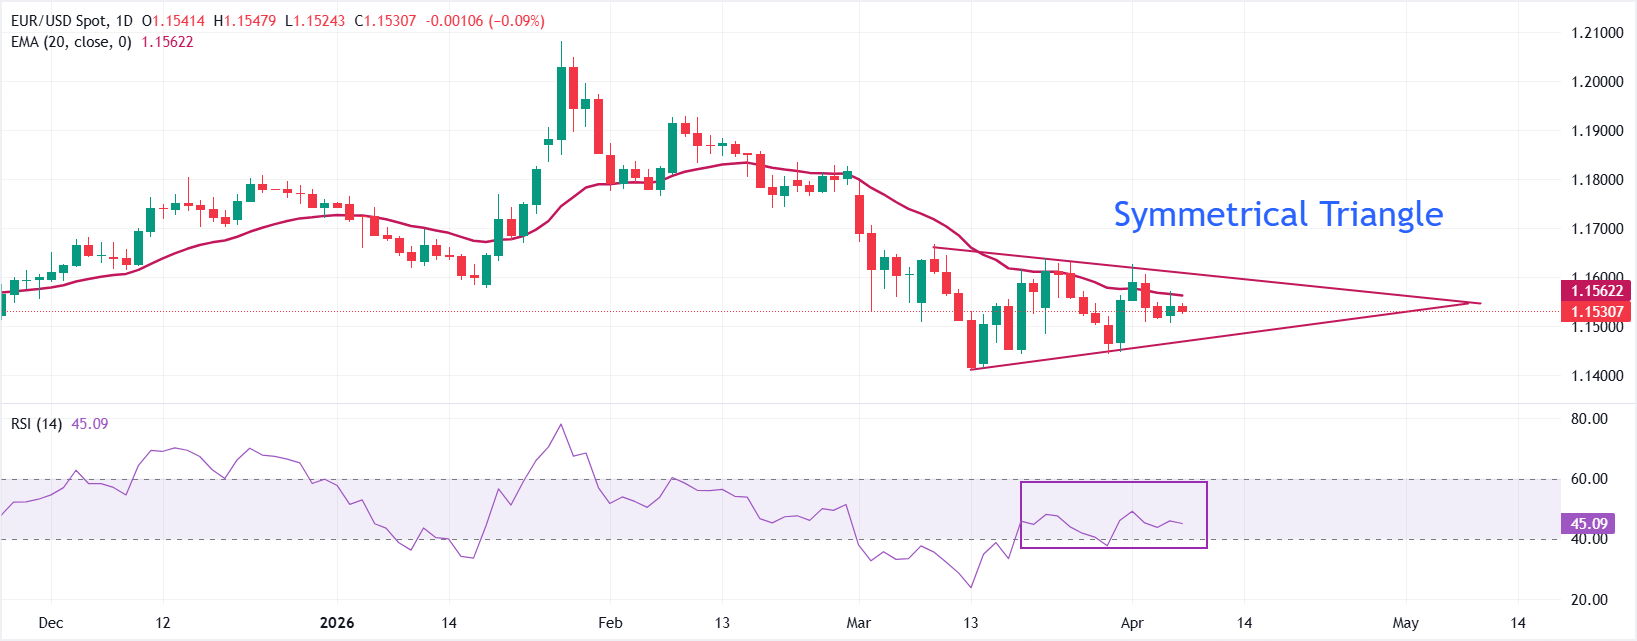
EUR/USD edges down to near 1.1530 in the opening trade on Tuesday. Price sits marginally below the 20-day Exponential Moving Average (EMA) near 1.1560, keeping the short-term tone mildly bearish as the pair struggles to reclaim that dynamic cap.
The 14-day Relative Strength Index (RSI) hovers in the mid-40s, showing negative but not extreme momentum, consistent with a market leaning lower inside a broader consolidation. A downward-sloping resistance trend line from around 1.1660 continues to limit rebounds, while the recent sequence of lower closes under that line confirms sellers retain the near-term advantage.
Initial resistance is now located at the 20-day EMA around 1.1560, with a break above exposing the descending trend-line barrier near 1.1600 and then the March 10 high at 1.1666. On the downside, the rising support trend line coming from the 1.1410 region underpins the market around 1.1470, with a daily close below that level opening the way toward 1.1410 as the next support. As long as the pair trades below 1.1600, rallies are likely to meet selling interest, keeping focus on whether the 1.1470–1.1410 support band can contain the current bearish pressure.
(The technical analysis of this story was written with the help of an AI tool.)
US Dollar FAQs
The US Dollar (USD) is the official currency of the United States of America, and the ‘de facto’ currency of a significant number of other countries where it is found in circulation alongside local notes. It is the most heavily traded currency in the world, accounting for over 88% of all global foreign exchange turnover, or an average of $6.6 trillion in transactions per day, according to data from 2022. Following the second world war, the USD took over from the British Pound as the world’s reserve currency. For most of its history, the US Dollar was backed by Gold, until the Bretton Woods Agreement in 1971 when the Gold Standard went away.
The most important single factor impacting on the value of the US Dollar is monetary policy, which is shaped by the Federal Reserve (Fed). The Fed has two mandates: to achieve price stability (control inflation) and foster full employment. Its primary tool to achieve these two goals is by adjusting interest rates. When prices are rising too quickly and inflation is above the Fed’s 2% target, the Fed will raise rates, which helps the USD value. When inflation falls below 2% or the Unemployment Rate is too high, the Fed may lower interest rates, which weighs on the Greenback.
In extreme situations, the Federal Reserve can also print more Dollars and enact quantitative easing (QE). QE is the process by which the Fed substantially increases the flow of credit in a stuck financial system. It is a non-standard policy measure used when credit has dried up because banks will not lend to each other (out of the fear of counterparty default). It is a last resort when simply lowering interest rates is unlikely to achieve the necessary result. It was the Fed’s weapon of choice to combat the credit crunch that occurred during the Great Financial Crisis in 2008. It involves the Fed printing more Dollars and using them to buy US government bonds predominantly from financial institutions. QE usually leads to a weaker US Dollar.
Quantitative tightening (QT) is the reverse process whereby the Federal Reserve stops buying bonds from financial institutions and does not reinvest the principal from the bonds it holds maturing in new purchases. It is usually positive for the US Dollar.

超過一百萬用戶依賴 FXStreet 獲取即時市場數據、圖表工具、專家洞見與外匯新聞。其全面的經濟日曆與教育網路研討會協助交易者保持資訊領先、做出審慎決策。FXStreet 擁有約 60 人的團隊,分布於巴塞隆納總部及全球各地。
閱讀更多


