
Fear-hope cycle picks up speed, and Dow Jones futures are paying the price
作者 Joshua Gibson
更新: 2 Apr 2026


熱門文章
Futures contracts on the Dow Jones Industrial Average (DJIA) shed a meager half-percent on Thursday, but that number tells almost none of the story. At the session lows, the DJIA was down more than 600 points, the S&P 500 had shed 1.5%, and the Nasdaq Composite was off 2.2%.
Futures contracts on the Dow Jones Industrial Average (DJIA) shed a meager half-percent on Thursday, but that number tells almost none of the story. At the session lows, the DJIA was down more than 600 points, the S&P 500 had shed 1.5%, and the Nasdaq Composite was off 2.2%. Then, in the span of roughly an hour, all three indices clawed back the entire move and briefly turned green before sellers stepped back in ahead of the close.
The CBOE Volatility Index (VIX) climbed above 25, its highest level in weeks, and with equity markets closed on Friday for Good Friday, traders are heading into a long Easter weekend carrying a lot of unresolved risk.
Hope one day, fear the next
This has become the defining pattern of the past two weeks, and it is exhausting. On Tuesday, President Trump told reporters he expected US forces to leave Iran within two to three weeks, sending equities sharply higher. On Wednesday, the DJIA added more than 200 points after Trump posted on Truth Social that Iran's president had asked for a ceasefire. WTI Crude Oil fell below $100 per barrel, and for a brief moment, it felt like the market had found a floor. Then came Wednesday night's prime-time address. Instead of a clear de-escalation signal, Trump pledged to hit Iran "extremely hard" over the next two to three weeks and vowed to bring the country "back to the Stone Age." By Thursday morning, the optimism from earlier in the week was gone. Asian markets tanked, with South Korea's Kospi dropping more than 4% and Japan's Nikkei 225 falling over 2%. DJIA futures were indicated down roughly 600 points ahead of the US open.
The midday reversal came on a single headline: Iranian state media reported that Tehran is working with Oman to draft a protocol that would allow commercial vessels to transit the Strait of Hormuz for a fee, essentially a toll-based safe passage arrangement. It was enough to flip the entire session. The DJIA swung from down 600 points to briefly positive in under two hours. The S&P 500 crossed back above the flatline, and the Nasdaq recovered from a 2.2% deficit to post a brief gain. But the rally did not hold. Indices oscillated between gains and losses for the rest of the afternoon before settling modestly lower.
Melissa Brown, head of investment decision research at SimCorp, told CNBC that investors are having "knee-jerk reactions," wanting the news to be good but then deciding the uncertainty is still too high. That is a fair description of Thursday's price action, and frankly, of every session this month. CrossCheck Management CIO Todd Schoenberger added that reopening the Strait matters beyond Crude Oil, pointing to helium as "more valuable than foreign oil" given its irreplaceable role in semiconductor manufacturing.
Crude Oil is still running the show
As long as the Strait of Hormuz remains effectively closed, Oil prices will continue to dictate the direction of equity indices. WTI Crude Oil futures surged around 8% to near $110 per barrel on Thursday, while Brent Crude jumped roughly 5% to above $105. Energy was the top-performing S&P 500 sector by a wide margin, returning more than 36% year-to-date. On the losing side, consumer discretionary was the worst-performing sector. Cruise operators, airlines, and fuel-sensitive consumer names all fell sharply, but the individual stock moves are secondary to the bigger picture: until Crude Oil stabilizes, equity index volatility is not going anywhere.
Going into the long weekend with unanswered questions
Thursday's jobless claims data was strong, with filings dropping to 202K versus the 212K consensus, the lowest reading in nearly two years. Under normal circumstances, that would be a meaningful signal heading into Friday's Nonfarm Payrolls (NFP) report. But equity markets are closed for Good Friday, meaning only the bond market will react to NFP in real time, and frankly, labor data is taking a back seat to the geopolitical cycle right now.
The bigger question heading into next week is whether the Iran-Oman Strait of Hormuz protocol gains traction or fizzles, and whether Trump's "two to three weeks" timeline means anything concrete. For now, Dow Jones futures traders should expect more of the same: headline-driven swings, thin conviction, and a market that cannot decide whether the war is ending or just getting started.
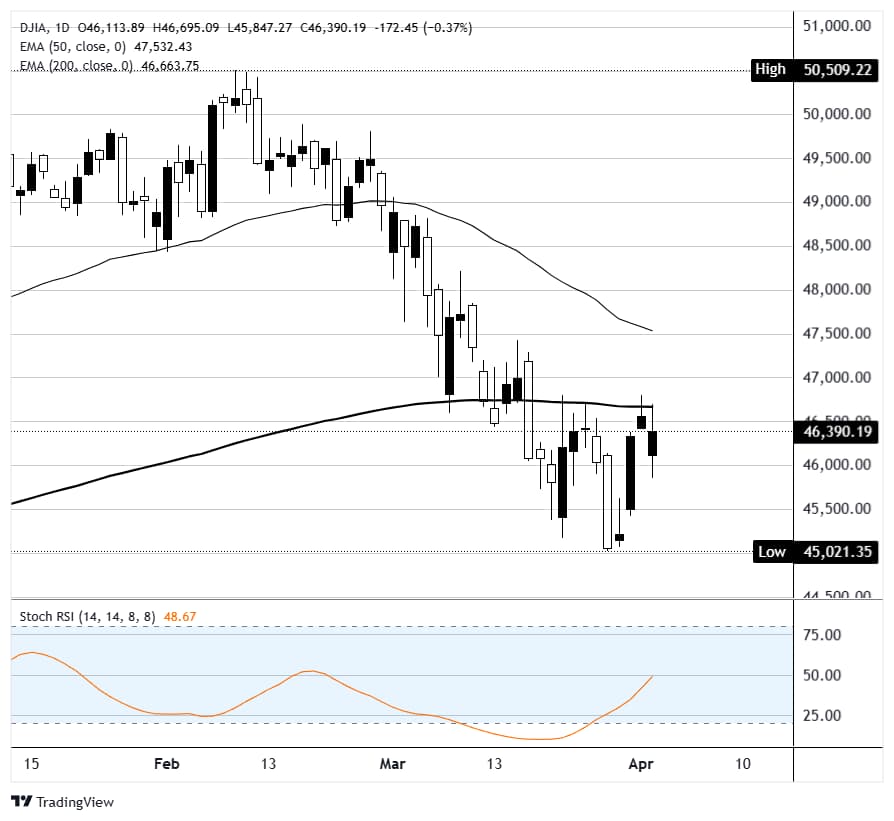
Dow Jones daily chart
Dow Jones FAQs
The Dow Jones Industrial Average, one of the oldest stock market indices in the world, is compiled of the 30 most traded stocks in the US. The index is price-weighted rather than weighted by capitalization. It is calculated by summing the prices of the constituent stocks and dividing them by a factor, currently 0.152. The index was founded by Charles Dow, who also founded the Wall Street Journal. In later years it has been criticized for not being broadly representative enough because it only tracks 30 conglomerates, unlike broader indices such as the S&P 500.
Many different factors drive the Dow Jones Industrial Average (DJIA). The aggregate performance of the component companies revealed in quarterly company earnings reports is the main one. US and global macroeconomic data also contributes as it impacts on investor sentiment. The level of interest rates, set by the Federal Reserve (Fed), also influences the DJIA as it affects the cost of credit, on which many corporations are heavily reliant. Therefore, inflation can be a major driver as well as other metrics which impact the Fed decisions.
Dow Theory is a method for identifying the primary trend of the stock market developed by Charles Dow. A key step is to compare the direction of the Dow Jones Industrial Average (DJIA) and the Dow Jones Transportation Average (DJTA) and only follow trends where both are moving in the same direction. Volume is a confirmatory criteria. The theory uses elements of peak and trough analysis. Dow’s theory posits three trend phases: accumulation, when smart money starts buying or selling; public participation, when the wider public joins in; and distribution, when the smart money exits.
There are a number of ways to trade the DJIA. One is to use ETFs which allow investors to trade the DJIA as a single security, rather than having to buy shares in all 30 constituent companies. A leading example is the SPDR Dow Jones Industrial Average ETF (DIA). DJIA futures contracts enable traders to speculate on the future value of the index and Options provide the right, but not the obligation, to buy or sell the index at a predetermined price in the future. Mutual funds enable investors to buy a share of a diversified portfolio of DJIA stocks thus providing exposure to the overall index.

超過一百萬用戶依賴 FXStreet 獲取即時市場數據、圖表工具、專家洞見與外匯新聞。其全面的經濟日曆與教育網路研討會協助交易者保持資訊領先、做出審慎決策。FXStreet 擁有約 60 人的團隊,分布於巴塞隆納總部及全球各地。
閱讀更多


