
GBP/JPY Price Forecast: Drifts lower as ‘bearish flag’ emerges
作者 Christian Borjon Valencia
發布日期: 24 Feb 2026 | 修改日期: 24 Feb 2026


熱門文章

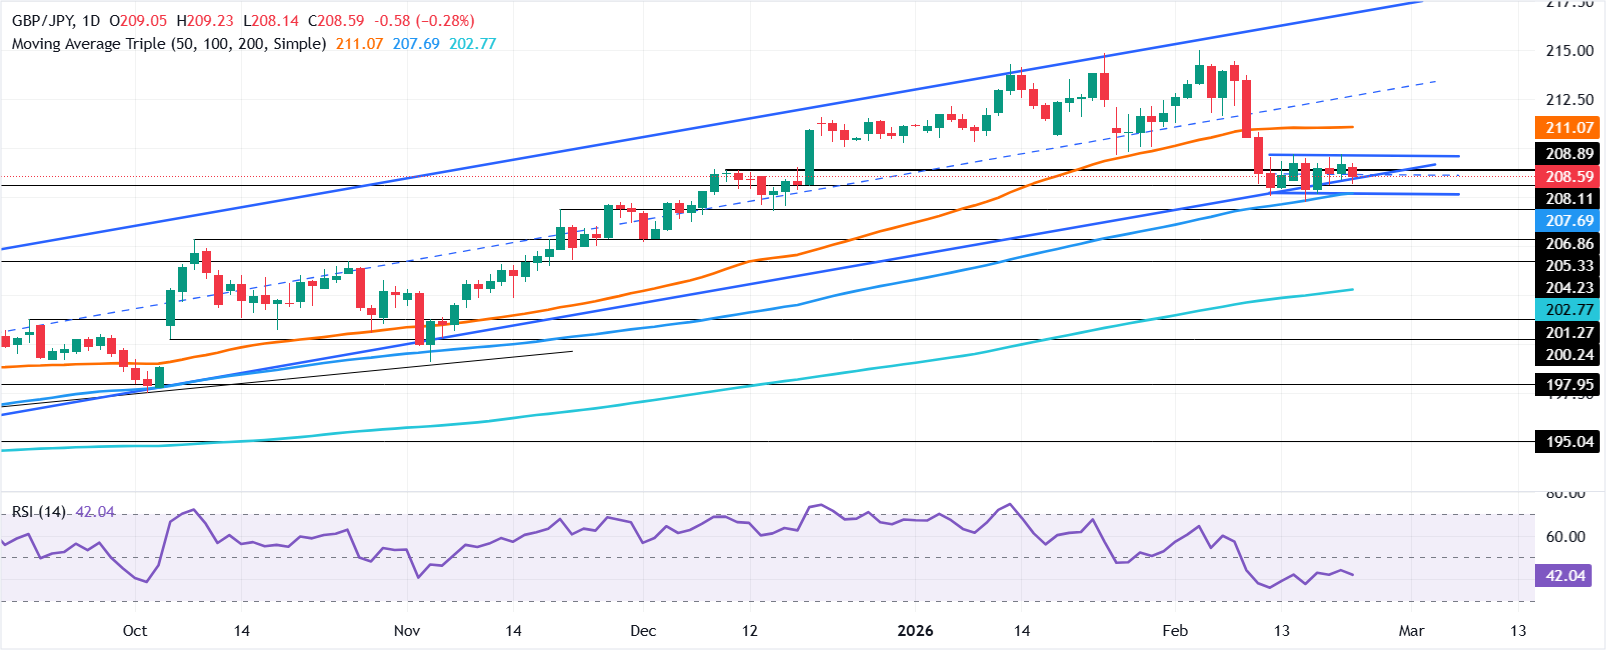
GBP/JPY retreats on Monday, down 0.22%, yet it remains consolidated within the 208.00-209.25 range, with traders eyeing a key break of support level seen at around 207.75. At the time of writing, the cross trades at 208.57 after reaching a high of 209.23.
- GBP/JPY slips within the 208.00–209.25 range as sellers defend near-term resistance.
- Bearish flag pattern and weak RSI signal rising downside risks toward 207.50.
- A break below channel support exposes 205.32 and the 200-day SMA near 202.60.
GBP/JPY retreats on Monday, down 0.22%, yet it remains consolidated within the 208.00-209.25 range, with traders eyeing a key break of support level seen at around 207.75. At the time of writing, the cross trades at 208.57 after reaching a high of 209.23.
GBP/JPY Price Forecast: Technical outlook
The technical picture shows consolidation near the bottom of an ascending uptrend channel. Although the convergence of the support trendline and the 100-day Simple Moving Average (SMA) at around 207.60 has kept GBP/JPY from falling, downside risks are emerging amid the formation of a ‘bearish flag.’
Momentum shows that GBP/JPY shorts have the upper hand as the Relative Strength Index (RSI) remains depressed below its neutral level, aiming downwards. That said, further downside is seen.
If GBP/JPY tumbles below 208.00, the next key support would be around 207.50. On further weakness, the next stop would be the October 8 swing high turned support at 205.32, ahead of the 200-day Simple Moving Average (SMA) at 202.60.
Upwards, GBP/JPY buyers need to push prices past the 209.50 area, followed by 210.00. If they clear the stir resistance at the confluence of the 20- and 50-day SMAs around 210.73/210.98, GBP/JPY could be poised to test the February 10 high at 213.82.
GBP/JPY Price Chart – Daily
Pound Sterling Price This Month
The table below shows the percentage change of British Pound (GBP) against listed major currencies this month. British Pound was the strongest against the New Zealand Dollar.
| USD | EUR | GBP | JPY | CAD | AUD | NZD | CHF | |
|---|---|---|---|---|---|---|---|---|
| USD | 1.47% | 2.34% | 0.97% | 1.53% | -0.16% | 2.01% | 1.16% | |
| EUR | -1.47% | 0.85% | -0.47% | 0.06% | -1.60% | 0.53% | -0.30% | |
| GBP | -2.34% | -0.85% | -1.34% | -0.79% | -2.43% | -0.32% | -1.15% | |
| JPY | -0.97% | 0.47% | 1.34% | 0.54% | -1.14% | 1.00% | 0.17% | |
| CAD | -1.53% | -0.06% | 0.79% | -0.54% | -1.67% | 0.47% | -0.36% | |
| AUD | 0.16% | 1.60% | 2.43% | 1.14% | 1.67% | 2.16% | 1.32% | |
| NZD | -2.01% | -0.53% | 0.32% | -1.00% | -0.47% | -2.16% | -0.83% | |
| CHF | -1.16% | 0.30% | 1.15% | -0.17% | 0.36% | -1.32% | 0.83% |
The heat map shows percentage changes of major currencies against each other. The base currency is picked from the left column, while the quote currency is picked from the top row. For example, if you pick the British Pound from the left column and move along the horizontal line to the US Dollar, the percentage change displayed in the box will represent GBP (base)/USD (quote).

超過一百萬用戶依賴 FXStreet 獲取即時市場數據、圖表工具、專家洞見與外匯新聞。其全面的經濟日曆與教育網路研討會協助交易者保持資訊領先、做出審慎決策。FXStreet 擁有約 60 人的團隊,分布於巴塞隆納總部及全球各地。
閱讀更多


