
GBP/USD Price Forecast: Trades above 1.3500 after rebounding from 50-day EMA
作者 Akhtar Faruqui
發布日期: 6 Feb 2026 | 修改日期: 6 Feb 2026


熱門文章

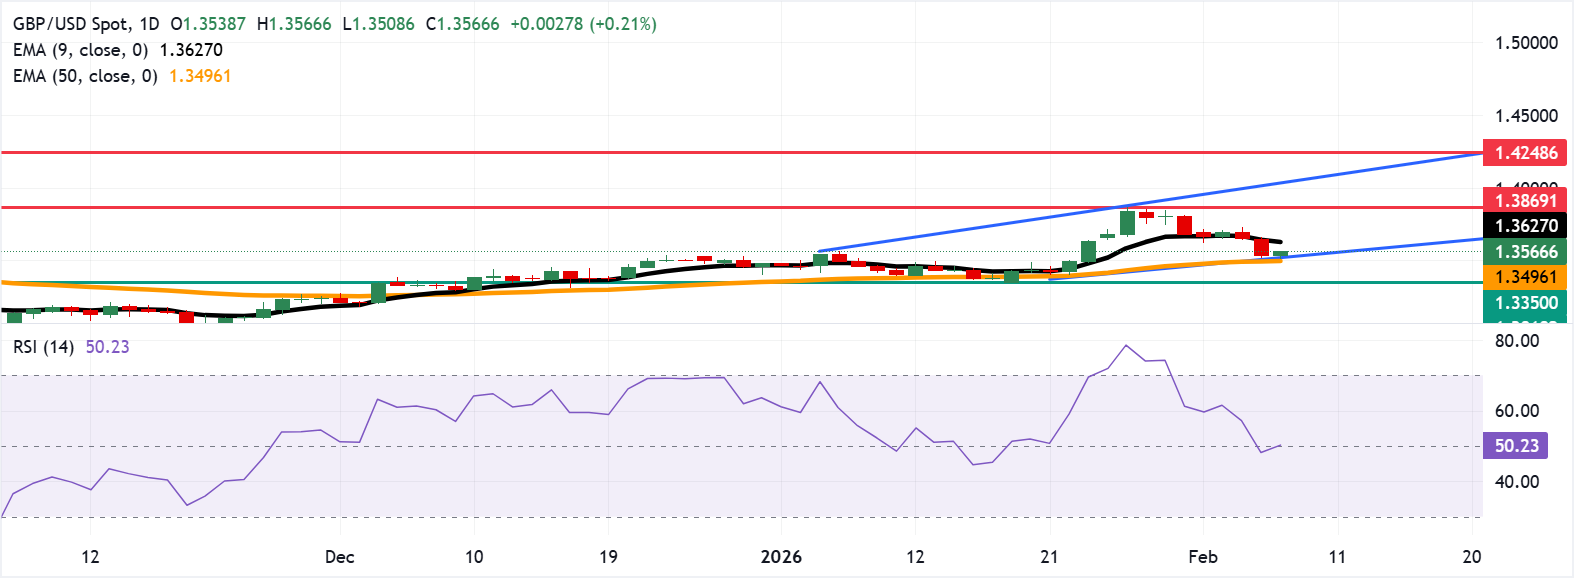
GBP/USD rebounds after two days of gains, trading around 1.3560 during the Asian hours on Friday. The technical analysis of the daily chart points to a potential bearish reversal as the pair is positioned near the lower boundary of an ascending channel pattern.
- GBP/USD rebounded from support near 1.3520 at the channel base, followed by the 50-day EMA.
- The 14-day Relative Strength Index holds at 50 signals neutral momentum.
- The initial resistance lies at the nine-day EMA of 1.3626.
GBP/USD rebounds after two days of gains, trading around 1.3560 during the Asian hours on Friday. The technical analysis of the daily chart points to a potential bearish reversal as the pair is positioned near the lower boundary of an ascending channel pattern.
The 14-day Relative Strength Index (RSI), a momentum indicator, at 50 is neutral. RSI hovering around the midline would turn more supportive on a move above 50 and weaken below it.
The GBP/USD pair holds above the rising 50-day Exponential Moving Average (EMA) at 1.3496, while capped by the nine-day EMA at 1.3626. The short-term average is rolling over, restraining upside as the medium-term slope stays positive. The moving average structure keeps the broader tone supported, yet near-term traction is fading and favors consolidation before direction resumes.
The immediate support is seen at the lower boundary of the ascending channel around 1.3520, followed by the 50-day EMA at 1.3496. A break beneath the longer average would strengthen the bearish bias and put downward pressure on the GBP/USD pair to test the support reversal zone around 1.3350.
On the upside, the GBP/USD pair may target the nine-day EMA of 1.3626. A daily close above the short-term average could unlock a move toward resistance at 1.3869, the highest since September 2021, reached on January 27. Further advances would support the pair to test the upper boundary of the ascending channel around 1.4050. A break above the channel could open a fresh leg higher toward 1.4248, the highest since April 2018.
(The technical analysis of this story was written with the help of an AI tool.)
Pound Sterling Price Today
The table below shows the percentage change of British Pound (GBP) against listed major currencies today. British Pound was the strongest against the US Dollar.
| USD | EUR | GBP | JPY | CAD | AUD | NZD | CHF | |
|---|---|---|---|---|---|---|---|---|
| USD | -0.14% | -0.21% | -0.20% | -0.03% | -0.11% | -0.22% | -0.22% | |
| EUR | 0.14% | -0.07% | -0.07% | 0.10% | 0.03% | -0.08% | -0.07% | |
| GBP | 0.21% | 0.07% | 0.00% | 0.19% | 0.10% | -0.01% | -0.01% | |
| JPY | 0.20% | 0.07% | 0.00% | 0.18% | 0.10% | -0.01% | 0.00% | |
| CAD | 0.03% | -0.10% | -0.19% | -0.18% | -0.08% | -0.19% | -0.17% | |
| AUD | 0.11% | -0.03% | -0.10% | -0.10% | 0.08% | -0.11% | -0.11% | |
| NZD | 0.22% | 0.08% | 0.01% | 0.01% | 0.19% | 0.11% | 0.00% | |
| CHF | 0.22% | 0.07% | 0.00% | 0.00% | 0.17% | 0.11% | -0.00% |
The heat map shows percentage changes of major currencies against each other. The base currency is picked from the left column, while the quote currency is picked from the top row. For example, if you pick the British Pound from the left column and move along the horizontal line to the US Dollar, the percentage change displayed in the box will represent GBP (base)/USD (quote).

超過一百萬用戶依賴 FXStreet 獲取即時市場數據、圖表工具、專家洞見與外匯新聞。其全面的經濟日曆與教育網路研討會協助交易者保持資訊領先、做出審慎決策。FXStreet 擁有約 60 人的團隊,分布於巴塞隆納總部及全球各地。
閱讀更多


