
Gold steadies as easing geopolitical tensions and firm US Dollar cap gains
作者 Vishal Chaturvedi
發布日期: 18 Feb 2026 | 修改日期: 18 Feb 2026


熱門文章

Gold (XAU/USD) trades firmer on Wednesday after sliding to its lowest level in nearly two weeks at $4,842 the previous day, as dip buyers stepped in to limit the downside and keep the pullback relatively shallow. At the time of writing, XAU/USD is trading around $4,952, up nearly 1.50% on the day.
- Gold holds firm on Wednesday after sliding more than 2% on Tuesday.
- Improving risk sentiment and a firmer US Dollar limit Gold’s upside.
- Technical outlook on the 4-hour chart shows a mild bearish tilt as price trades between the key 100- and 200-period SMAs.
Gold (XAU/USD) trades firmer on Wednesday after sliding to its lowest level in nearly two weeks at $4,842 the previous day, as dip buyers stepped in to limit the downside and keep the pullback relatively shallow. At the time of writing, XAU/USD is trading around $4,952, up nearly 1.50% on the day.
Despite the modest rebound, the yellow metal’s near-term outlook has turned mildly bearish, as evolving macro headwinds and a weakening technical structure continue to cap upside attempts.
Easing geopolitical risks and a firmer US Dollar cap upside momentum
Signs of progress in the latest US-Iran nuclear talks held in Geneva, along with ongoing US-led efforts to end the war between Russia and Ukraine, have helped ease geopolitical tensions, curbing safe haven flows into Bullion.
Iran’s Foreign Minister Abbas Araghchi said the two sides have reached a “general agreement on a set of guiding principles” for a potential nuclear deal. Reports also suggest that Iranian negotiators are expected to come back in two weeks with proposals for further discussion.
Meanwhile, a firmer US Dollar (USD) is also weighing on the precious metal, as resilient US labour market data has tempered expectations for an imminent Federal Reserve (Fed) interest rate cut. That said, moderating inflation has kept expectations of monetary policy easing alive in the second half of the year.
Fed Governor Michael Barr said on Tuesday that borrowing costs should stay unchanged for some time until there is clearer evidence that inflation is moving toward the 2% target. Meanwhile, Chicago Fed President Austan Goolsbee said further rate cuts could be possible this year if inflation continues to ease.
Data released earlier in the day showed US Durable Goods Orders fell 1.4% in December, below the 2.0% expected, following November’s strong 5.4% rise. Excluding Transportation, orders increased 0.9%, up from 0.5% previously.
Investors' attention now shifts to the US economic calendar, with January Industrial Production and the Federal Open Market Committee (FOMC) meeting minutes in focus.
On Friday, markets will also look to the advance estimate of US fourth-quarter Gross Domestic Product (GDP) and the Core Personal Consumption Expenditures (PCE) Price Index for further clues on the Fed's monetary policy path, which could offer fresh direction for Gold.
Overall, the broader uptrend remains intact for the precious metal, with the current price action more likely reflecting a consolidation phase or temporary pause rather than a structural shift in underlying bullish momentum, as persistent macro and geopolitical drivers continue to provide a supportive backdrop.
Technical analysis: Bears hold edge as RSI stays below 50
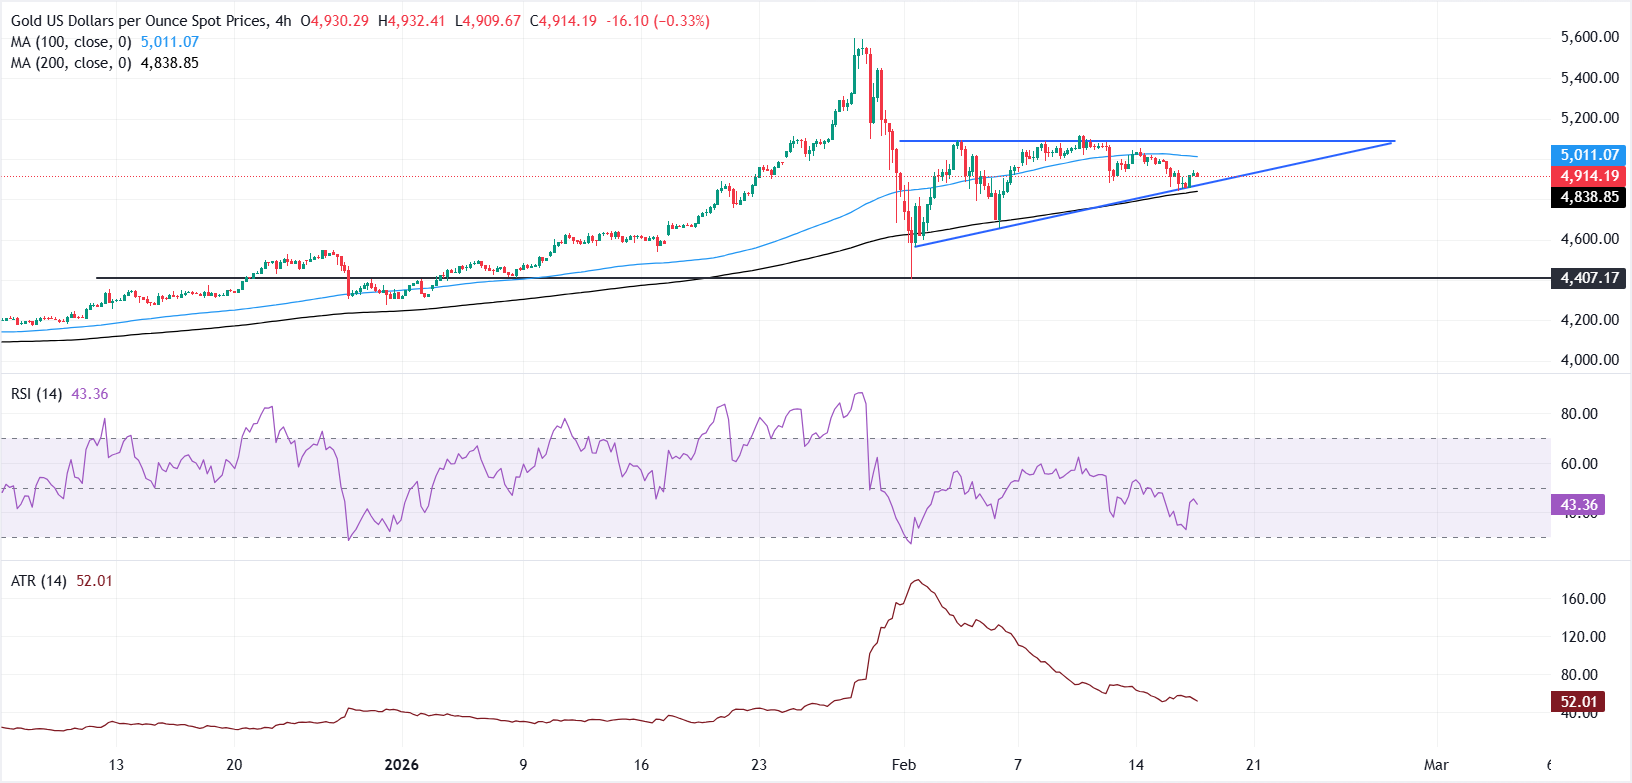
From a technical perspective, the 4-hour chart highlights a clear tug of war between bulls and bears, reflecting the market’s indecisiveness. Price trades beneath the 100-period Simple Moving Average (SMA) at $5,011.07 and holds above the 200 SMA at $4,838.85, leaving a mixed bias with a mild bearish tilt.
The Relative Strength Index (14) sits at 43, below the 50 midline, reinforcing soft momentum. The Average True Range (14) has eased to 52.01, indicating contracting ranges that could precede a decisive move.
A sustained close above the 100-period SMA at $5,011.07 would strengthen short-term bullish momentum and signal a potential recovery toward higher resistance levels. Conversely, a break and close below the 200-period SMA would intensify bearish pressure, exposing the next downside targets at $4,800, followed by $4,700.
(The technical analysis of this story was written with the help of an AI tool.)
US Dollar Price Today
The table below shows the percentage change of US Dollar (USD) against listed major currencies today. US Dollar was the strongest against the New Zealand Dollar.
| USD | EUR | GBP | JPY | CAD | AUD | NZD | CHF | |
|---|---|---|---|---|---|---|---|---|
| USD | 0.16% | -0.02% | 0.35% | 0.15% | 0.29% | 0.94% | 0.13% | |
| EUR | -0.16% | -0.18% | 0.18% | -0.01% | 0.13% | 0.79% | -0.03% | |
| GBP | 0.02% | 0.18% | 0.33% | 0.17% | 0.31% | 0.96% | 0.14% | |
| JPY | -0.35% | -0.18% | -0.33% | -0.19% | -0.05% | 0.59% | -0.21% | |
| CAD | -0.15% | 0.01% | -0.17% | 0.19% | 0.14% | 0.79% | -0.02% | |
| AUD | -0.29% | -0.13% | -0.31% | 0.05% | -0.14% | 0.66% | -0.16% | |
| NZD | -0.94% | -0.79% | -0.96% | -0.59% | -0.79% | -0.66% | -0.80% | |
| CHF | -0.13% | 0.03% | -0.14% | 0.21% | 0.02% | 0.16% | 0.80% |
The heat map shows percentage changes of major currencies against each other. The base currency is picked from the left column, while the quote currency is picked from the top row. For example, if you pick the US Dollar from the left column and move along the horizontal line to the Japanese Yen, the percentage change displayed in the box will represent USD (base)/JPY (quote).

超過一百萬用戶依賴 FXStreet 獲取即時市場數據、圖表工具、專家洞見與外匯新聞。其全面的經濟日曆與教育網路研討會協助交易者保持資訊領先、做出審慎決策。FXStreet 擁有約 60 人的團隊,分布於巴塞隆納總部及全球各地。
閱讀更多


