
Maple Finance Price Forecast: SYRUP holds firm as AUM reclaims $4 billion
作者 Vishal Dixit
發布日期: 13 Feb 2026 | 修改日期: 13 Feb 2026


熱門文章

Maple Finance (SYRUP) is trading near $0.2700 at press time on Friday, with bulls keeping the price buoyant above the S1 Pivot Point support at $0.2497.
- SYRUP hovers above $0.2700 on Friday, hinting at a potential rebound within a larger descending channel pattern.
- On-chain data shows that assets under management have risen above $4 billion, with monthly revenue remaining steady.
- The technical outlook for Maple Finance suggests a possible upward shift in trend momentum.
Maple Finance (SYRUP) is trading near $0.2700 at press time on Friday, with bulls keeping the price buoyant above the S1 Pivot Point support at $0.2497. The on-chain data indicate consistent user demand for the Decentralized Finance (DeFi) protocol, with its Assets Under Management (AUM) exceeding $4 billion and revenue remaining steady after reaching a monthly record high in January. The technical outlook for SYRUP indicates a rebound as selling pressure wanes.
Maple Finance retains revenue, whale interest
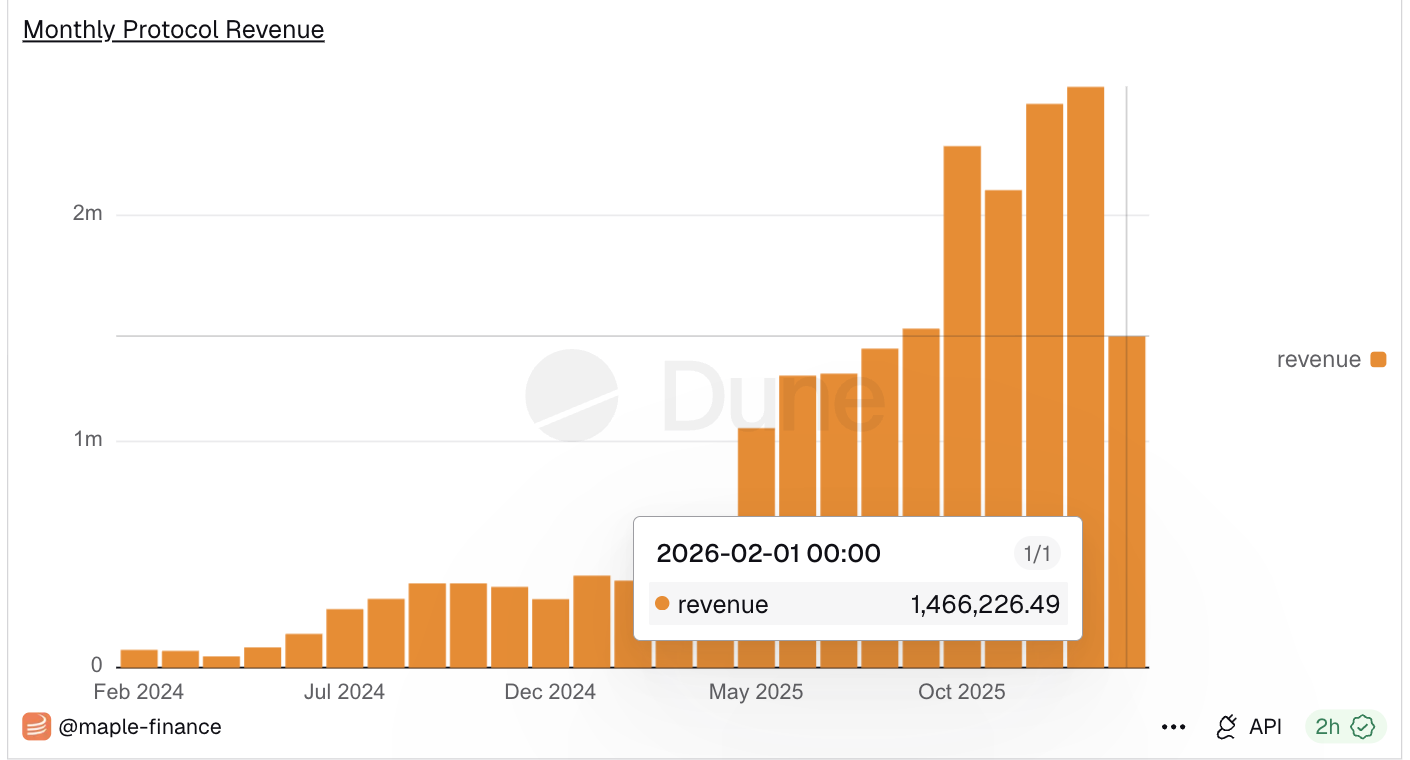
Dune dashboard data indicate that Maple Finance recorded revenue of $1.46 million so far this month, after reaching a record high of $2.57 million in revenue, primarily from lending fees and yield optimization. This reflects a steady increase in monthly revenues, building on the $2.49 million collected in December.
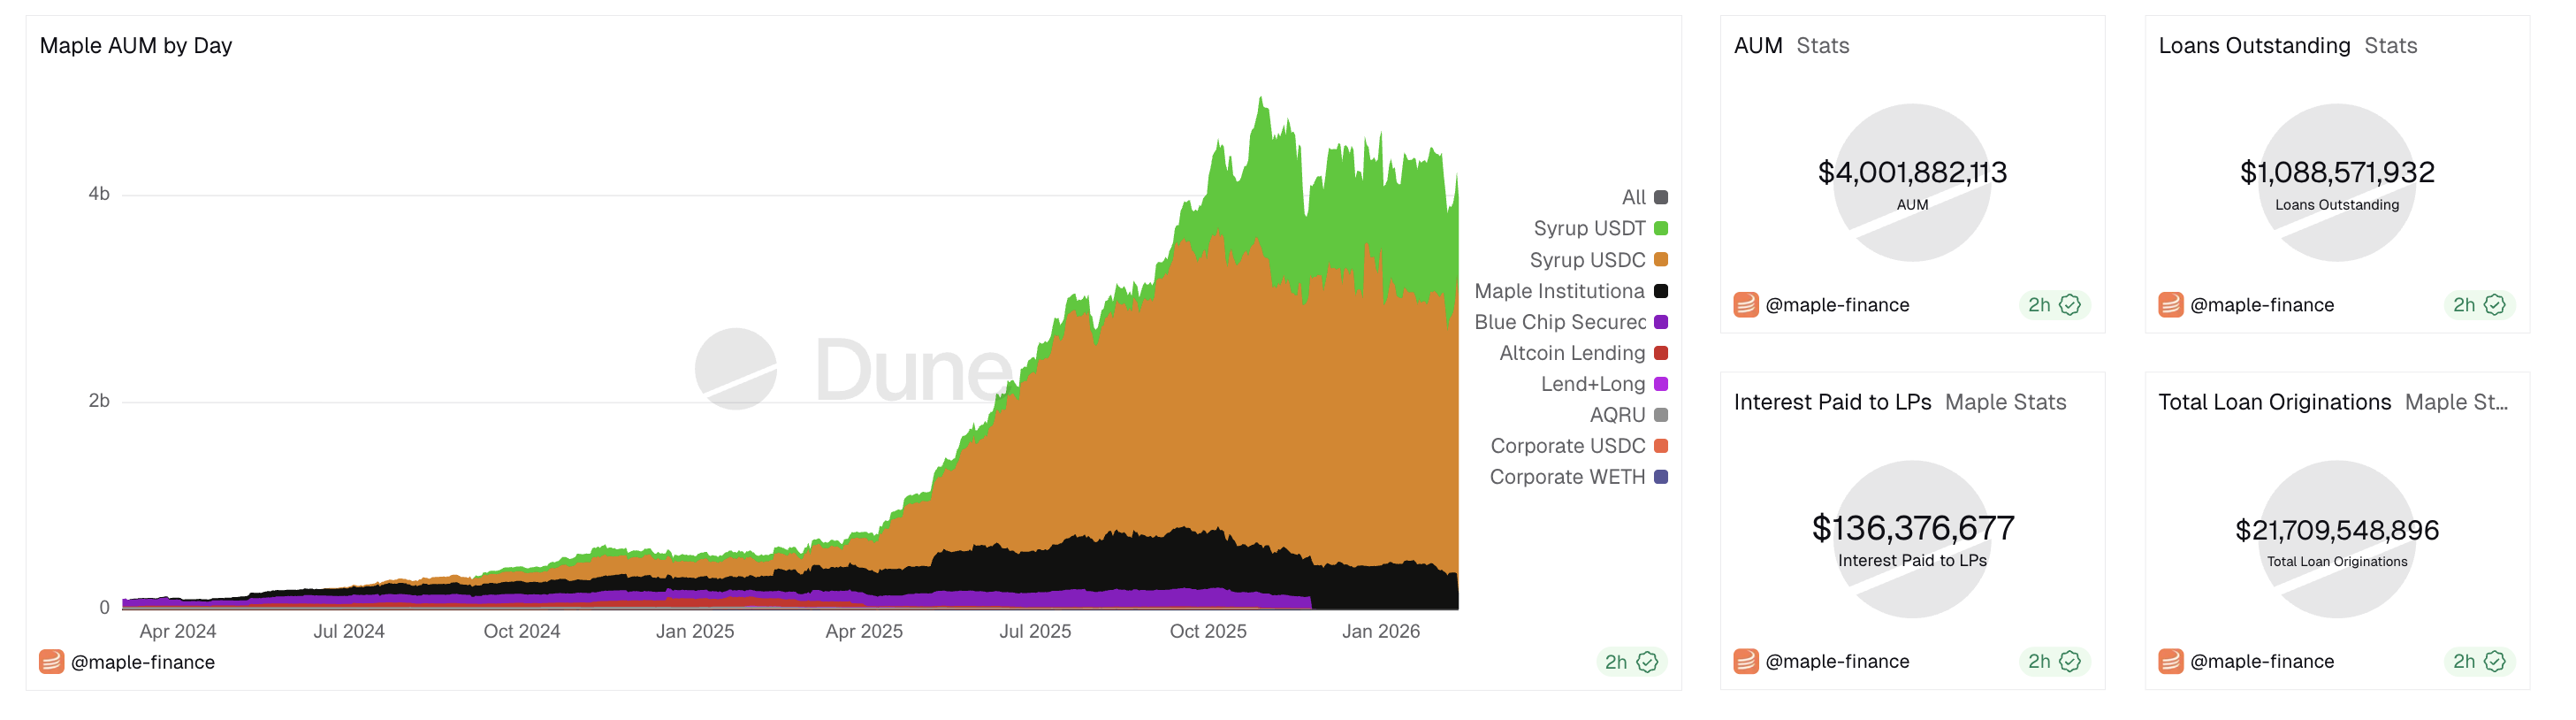
Additionally, the protocol's AUM has exceeded $4 billion, while outstanding loan balances account for $1.08 billion. The steady revenue and rising AUM suggest that Maple Finance's ecosystem continues to expand amid increasing market demand.
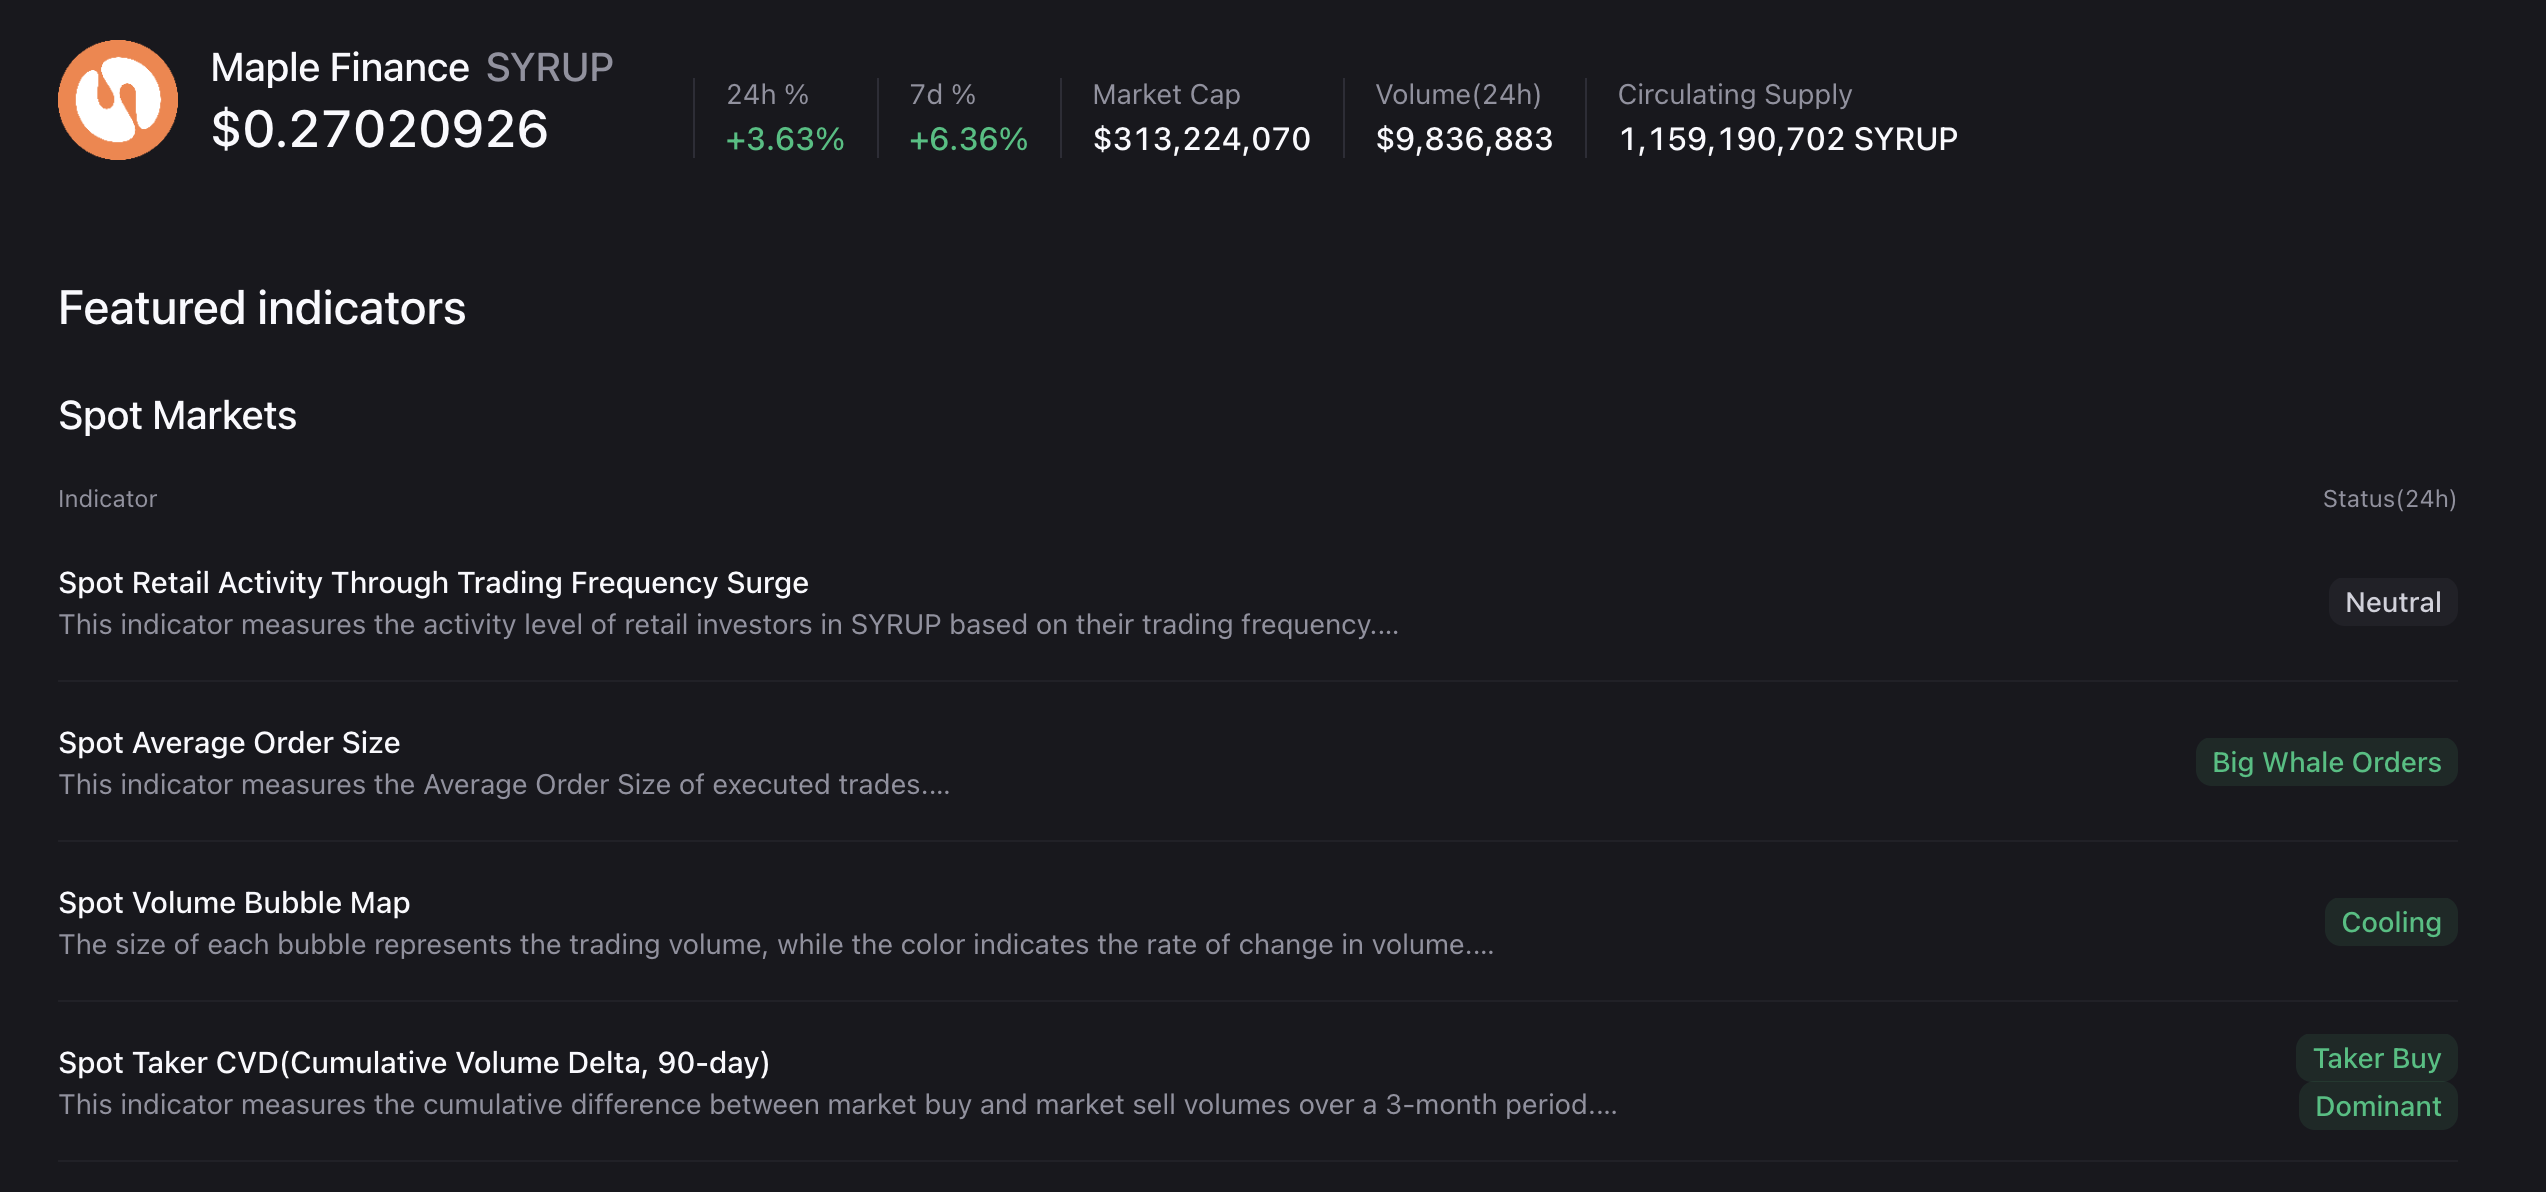
Corroborating the high demand, CryptoQuant data shows consistent interest from large wallet investors, commonly known as whales, based on the average SYRUP order size of executed spot-market trades.
Technical outlook: Will SYRUP rebound within the falling channel?
Maple Finance is above the S1 pivot point at $0.2497, serving as short-term support following a broader decline over the last 31 days, which has resulted in roughly a 35% loss. This decline reflects a downward trend within a larger descending channel pattern formed by two parallel lines on the daily chart.
A potential rebound in SYRUP could test the 50-day Exponential Moving Average (EMA) at $0.3176, followed by the 200-day EMA at $0.3666 near the overhead resistance line.
The technical indicators on the daily chart suggest that selling pressure is waning. The Relative Strength Index (RSI) is at 36, hovering above the oversold zone and taking a lateral shift after the prevailing decline. Additionally, the Moving Average Convergence Divergence (MACD) approaches the signal line as the histogram's negative component contracts, indicating a potential crossover that would confirm a return to bullish momentum.
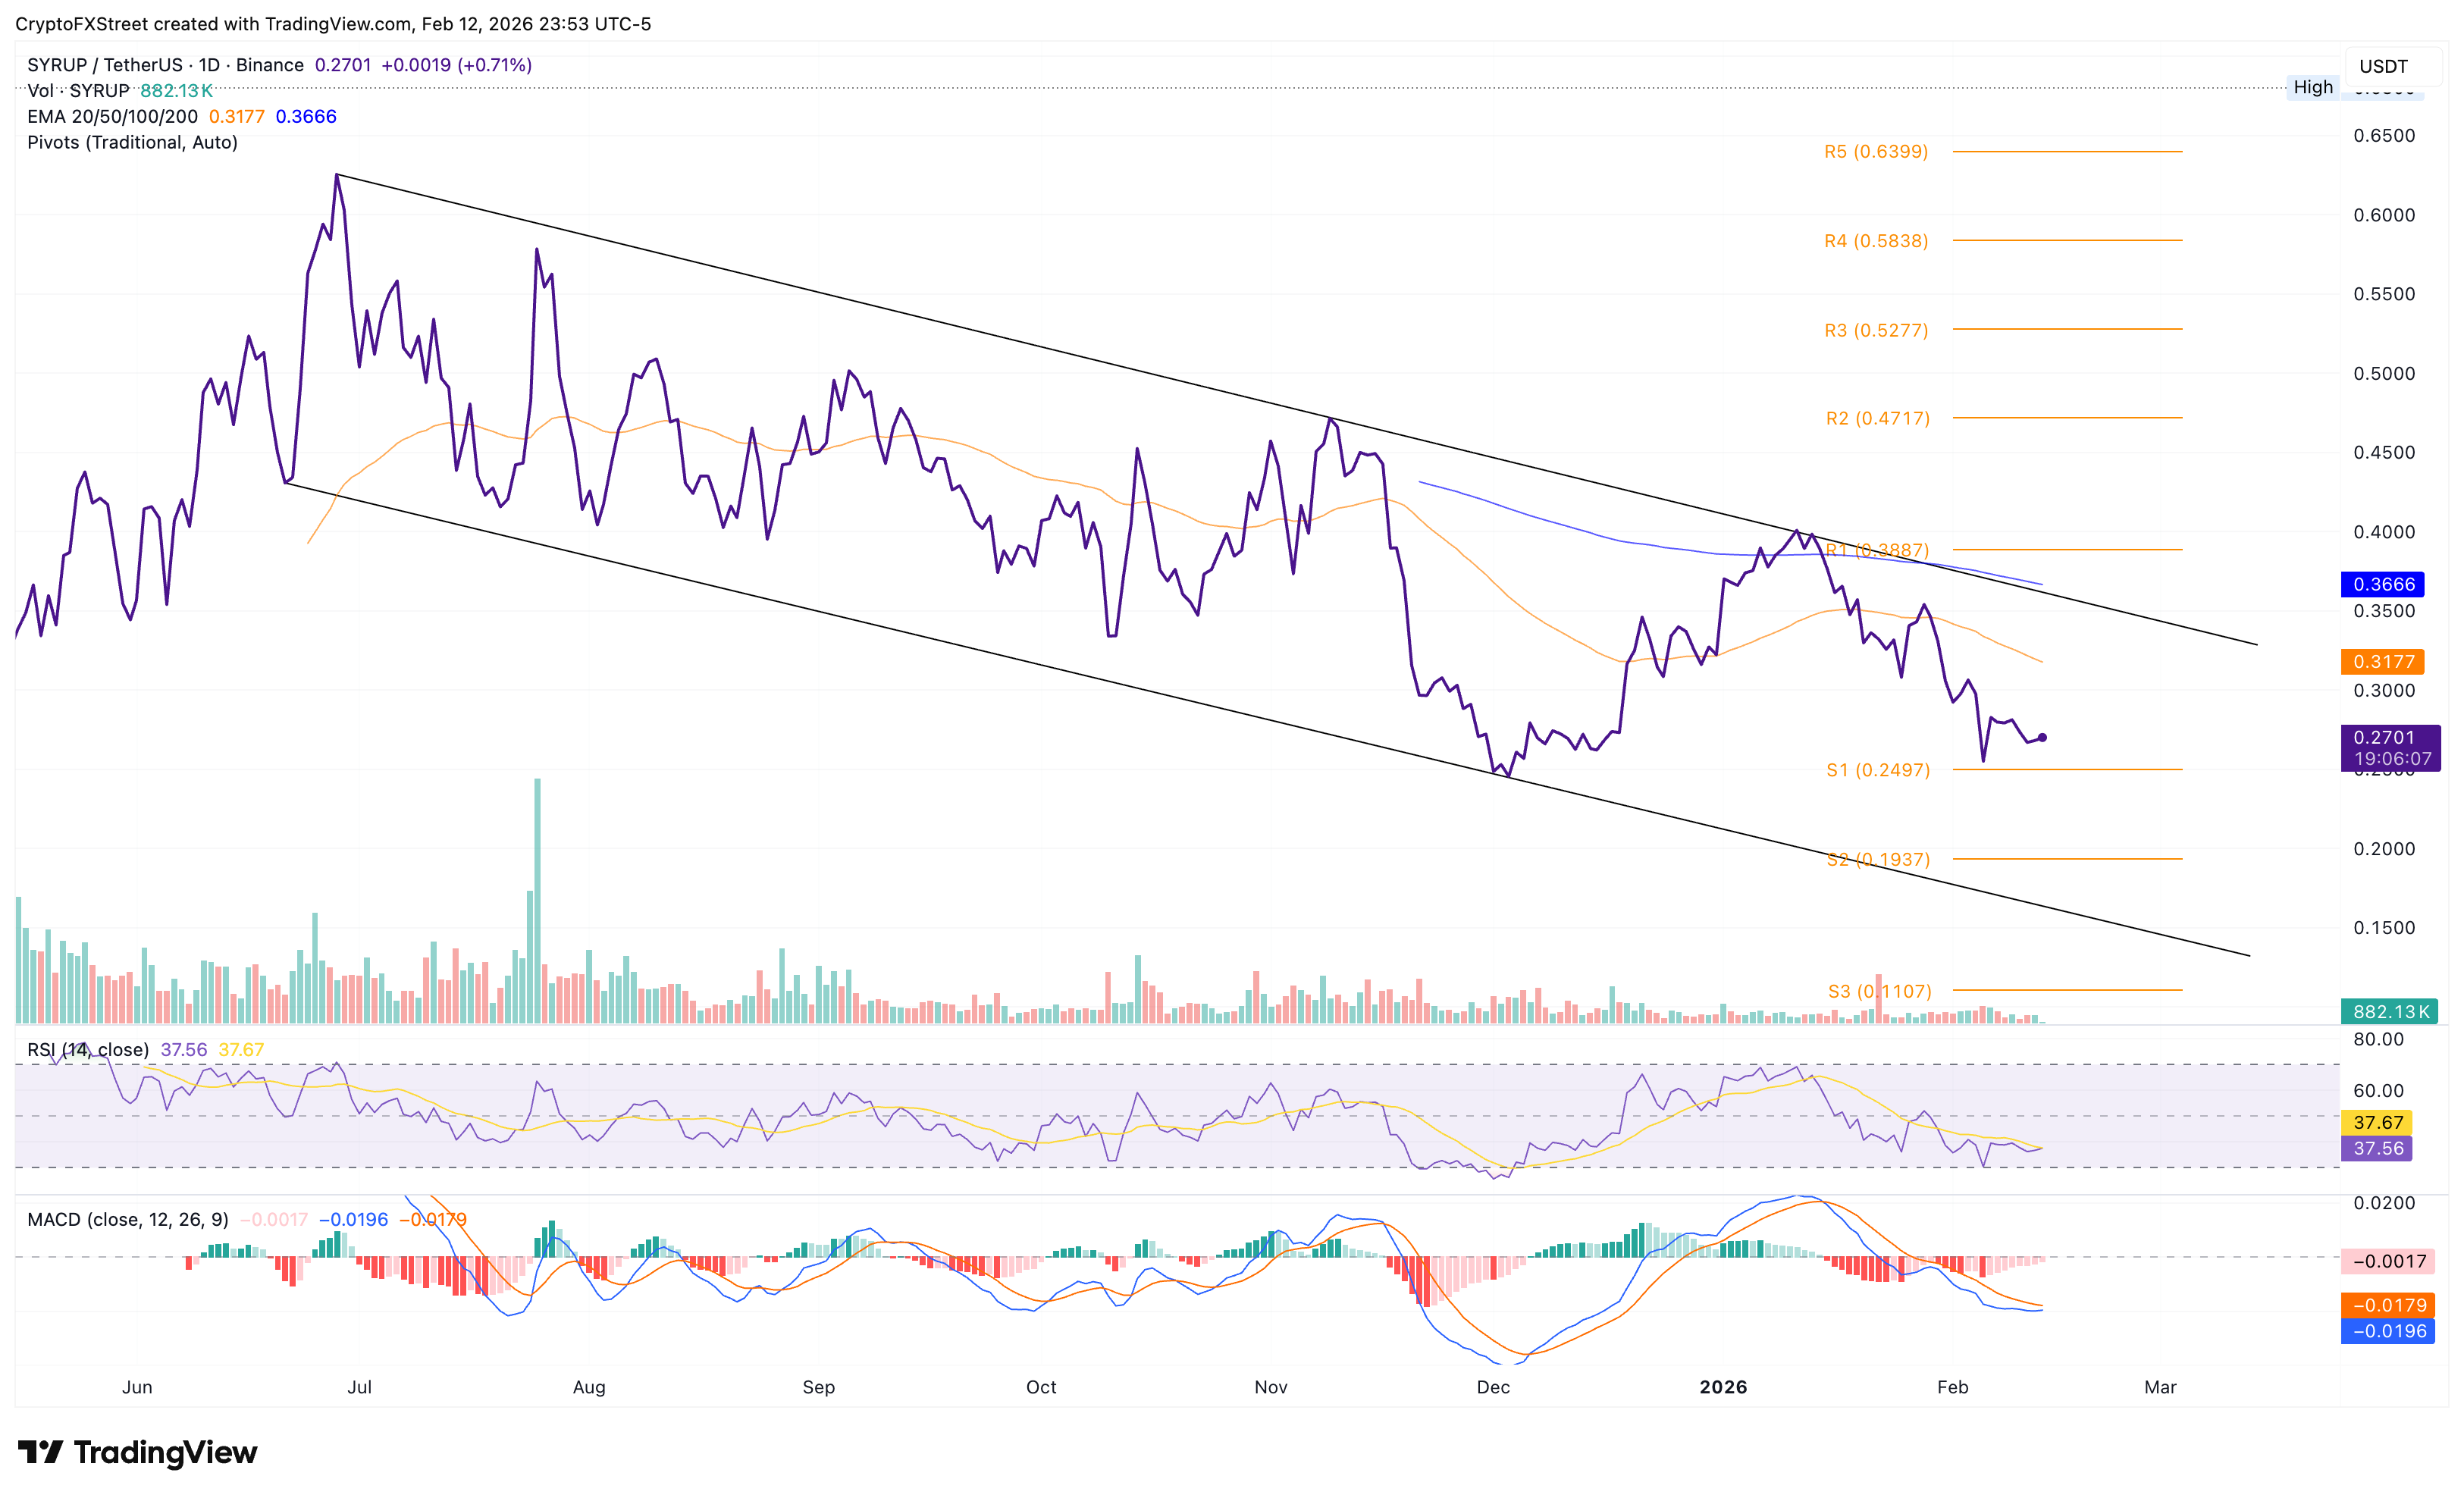
However, if SYRUP closes below the $0.2497, it could extend the decline to the S2 pivot point at $0.1937.

超過一百萬用戶依賴 FXStreet 獲取即時市場數據、圖表工具、專家洞見與外匯新聞。其全面的經濟日曆與教育網路研討會協助交易者保持資訊領先、做出審慎決策。FXStreet 擁有約 60 人的團隊,分布於巴塞隆納總部及全球各地。
閱讀更多


