
NZD/USD Price Forecast: Kiwi picks up to 0.5720 with bearish pressure easing
作者 Guillermo Alcala
更新: 6 Apr 2026


熱門文章

The New Zealand Dollar (NZD) is capitalising on a moderate US Dollar (USD) weakness on a calm trading session, with most markets closed on Easter Monday.
- NZD/USD trims losses and returns to 0.5720 as market sentiment improves.
- Hopes of a peace deal in Iran are weighing on the safe-haven USD.
- The Kiwi starts showing signs of a potential recovery.
The New Zealand Dollar (NZD) is capitalising on a moderate US Dollar (USD) weakness on a calm trading session, with most markets closed on Easter Monday. The pair has extended its rebound from four-month lows near 0.5680 earlier on the day to 0.5720, although the broader downward trend remains intact so far.
Risk-sensitive assets like the Kiwi are taking a breather on Monday amid news that negotiations for a peace deal in Iran are still in progress. A Reuters report affirms that Iran and the US have received a framework for a plan to end hostilities immediately, which might lead to the reopening of the Strait of Hormuz. Investors have reacted by cutting back long US Dollar positions.
Technical Analysis: Initial signs of recovery
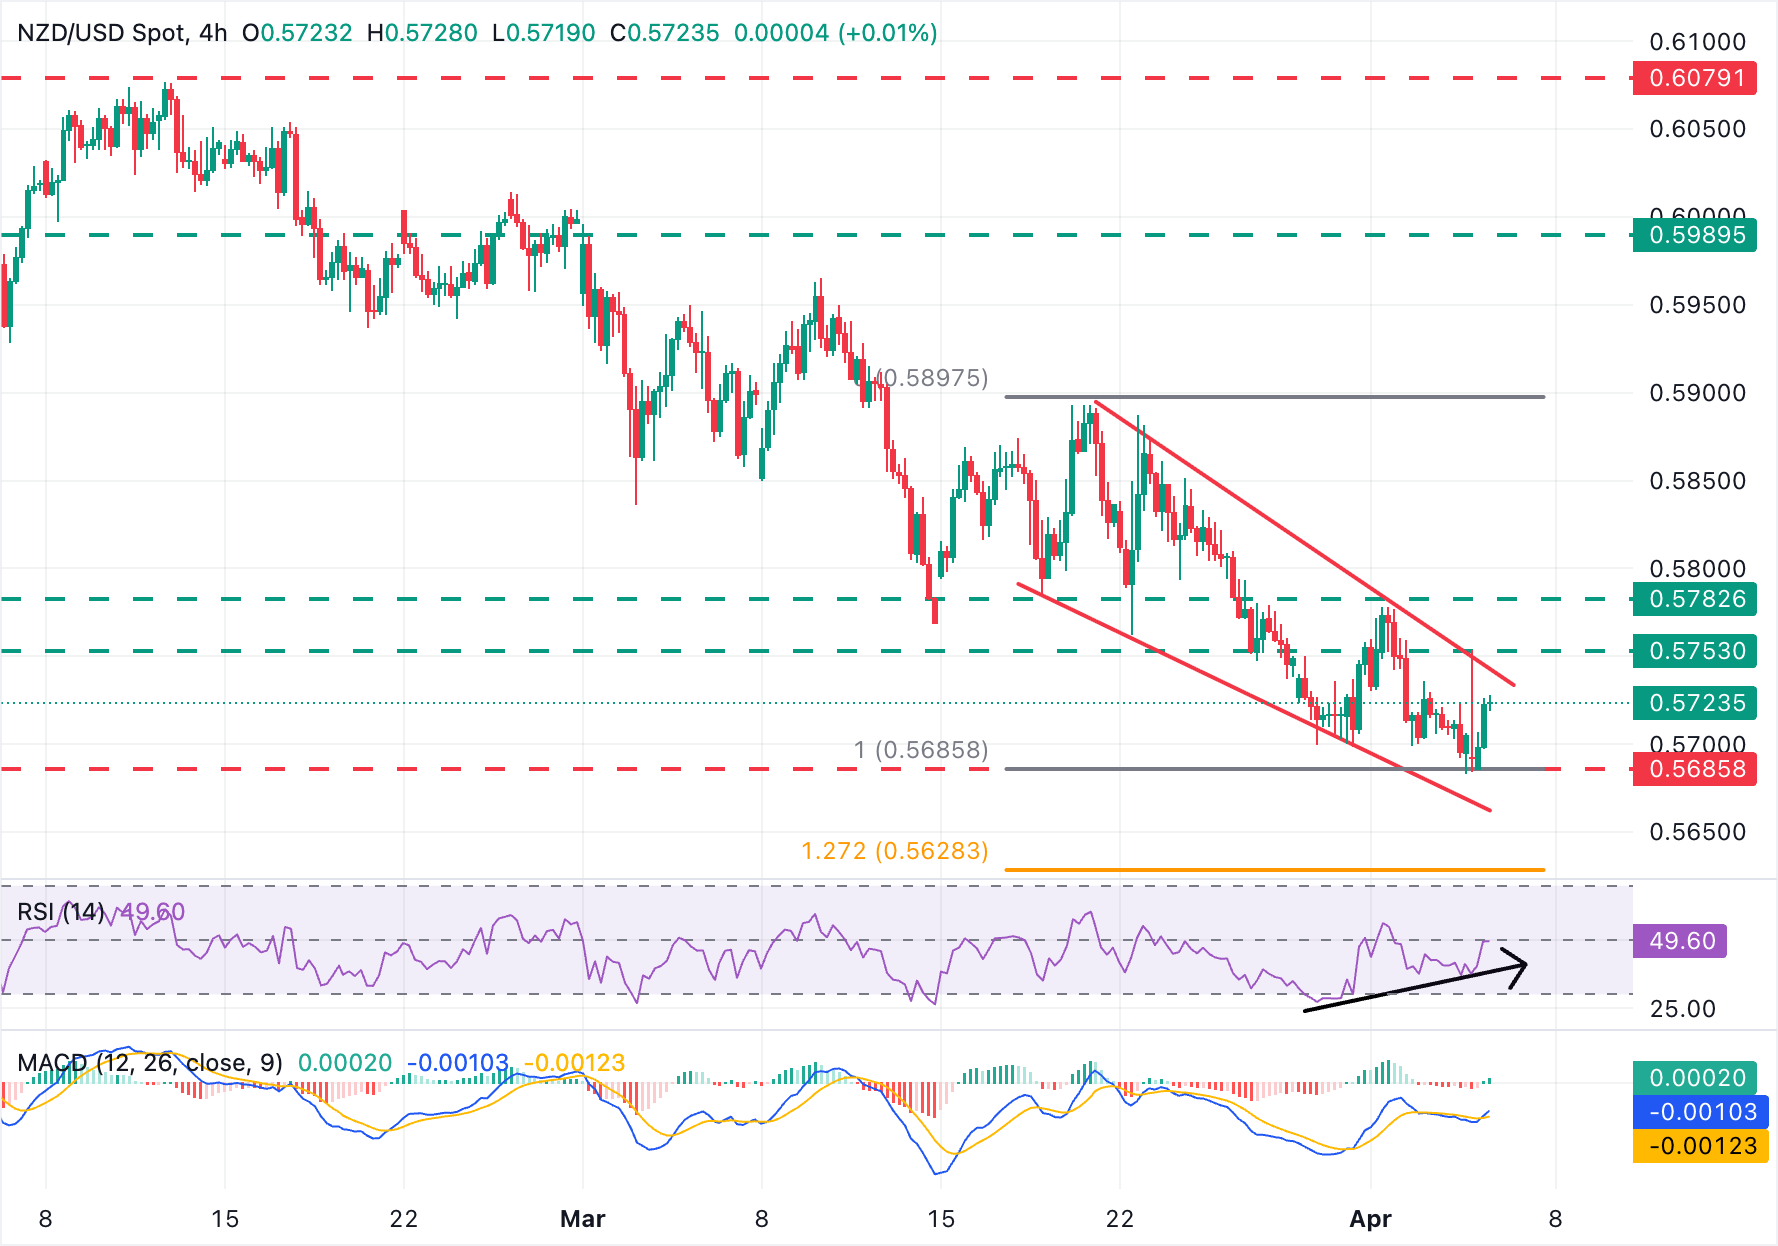
NZD/USD near-term bias remains negative, but recent price action suggests that bears might be running out of steam. The pair is trading in what looks like an ending wedge, after having depreciated more than 6% since late January.
Beyond that, the 4-hour Relative Strength Index (RSI) shows a bullish divergence, as it crawls to the key 50 area. The Moving Average Convergence Divergence (MACD) line is attempting to cross above the Signal line, with the histogram popping up above the zero line.
Bulls, however, would need to break the trendline resistance, now at 0.5740, and Friday's high at 0.5753, and preferably also the April 1 high, near 0.5780, to confirm a corrective reaction. To the downside, supports are at the mentioned session low, near 0.5680, and the wedge's bottom, around 0.5660.
(The technical analysis of this story was written with the help of an AI tool.)
US Dollar Price Today
The table below shows the percentage change of US Dollar (USD) against listed major currencies today. US Dollar was the strongest against the Japanese Yen.
| USD | EUR | GBP | JPY | CAD | AUD | NZD | CHF | |
|---|---|---|---|---|---|---|---|---|
| USD | -0.33% | -0.40% | -0.16% | -0.18% | -0.53% | -0.54% | -0.31% | |
| EUR | 0.33% | -0.06% | 0.15% | 0.16% | -0.22% | -0.23% | -0.00% | |
| GBP | 0.40% | 0.06% | 0.21% | 0.18% | -0.16% | -0.18% | 0.07% | |
| JPY | 0.16% | -0.15% | -0.21% | -0.02% | -0.39% | -0.41% | -0.17% | |
| CAD | 0.18% | -0.16% | -0.18% | 0.02% | -0.34% | -0.36% | -0.13% | |
| AUD | 0.53% | 0.22% | 0.16% | 0.39% | 0.34% | -0.03% | 0.22% | |
| NZD | 0.54% | 0.23% | 0.18% | 0.41% | 0.36% | 0.03% | 0.26% | |
| CHF | 0.31% | 0.00% | -0.07% | 0.17% | 0.13% | -0.22% | -0.26% |
The heat map shows percentage changes of major currencies against each other. The base currency is picked from the left column, while the quote currency is picked from the top row. For example, if you pick the US Dollar from the left column and move along the horizontal line to the Japanese Yen, the percentage change displayed in the box will represent USD (base)/JPY (quote).

超過一百萬用戶依賴 FXStreet 獲取即時市場數據、圖表工具、專家洞見與外匯新聞。其全面的經濟日曆與教育網路研討會協助交易者保持資訊領先、做出審慎決策。FXStreet 擁有約 60 人的團隊,分布於巴塞隆納總部及全球各地。
閱讀更多


