
Pepe Price Forecast: Open Interest surge backs bullish breakout setup
作者 Vishal Dixit
更新: 8 Apr 2026


熱門文章

Pepe (PEPE) is holding steady above $0.00000350 at press time on Wednesday, following a 12% jump the previous day, in line with the broader market recovery linked to the US-Iran ceasefire. Derivatives data show renewed interest in the frog-themed meme coin amid bullish speculations.
- Pepe holds steady on Wednesday after a 12% jump the previous day, which surpassed the 50-day EMA.
- A surge in PEPE futures Open Interest signals a risk-on sentiment leading to positional buildup.
- The technical outlook is bullish as PEPE breaks above the near-term resistance trendline.
Pepe (PEPE) is holding steady above $0.00000350 at press time on Wednesday, following a 12% jump the previous day, in line with the broader market recovery linked to the US-Iran ceasefire. Derivatives data show renewed interest in the frog-themed meme coin amid bullish speculations. PEPE is poised for further gains if it sustains above its 50-day Exponential Moving Average (EMA).
Retail support renewed for Pepe
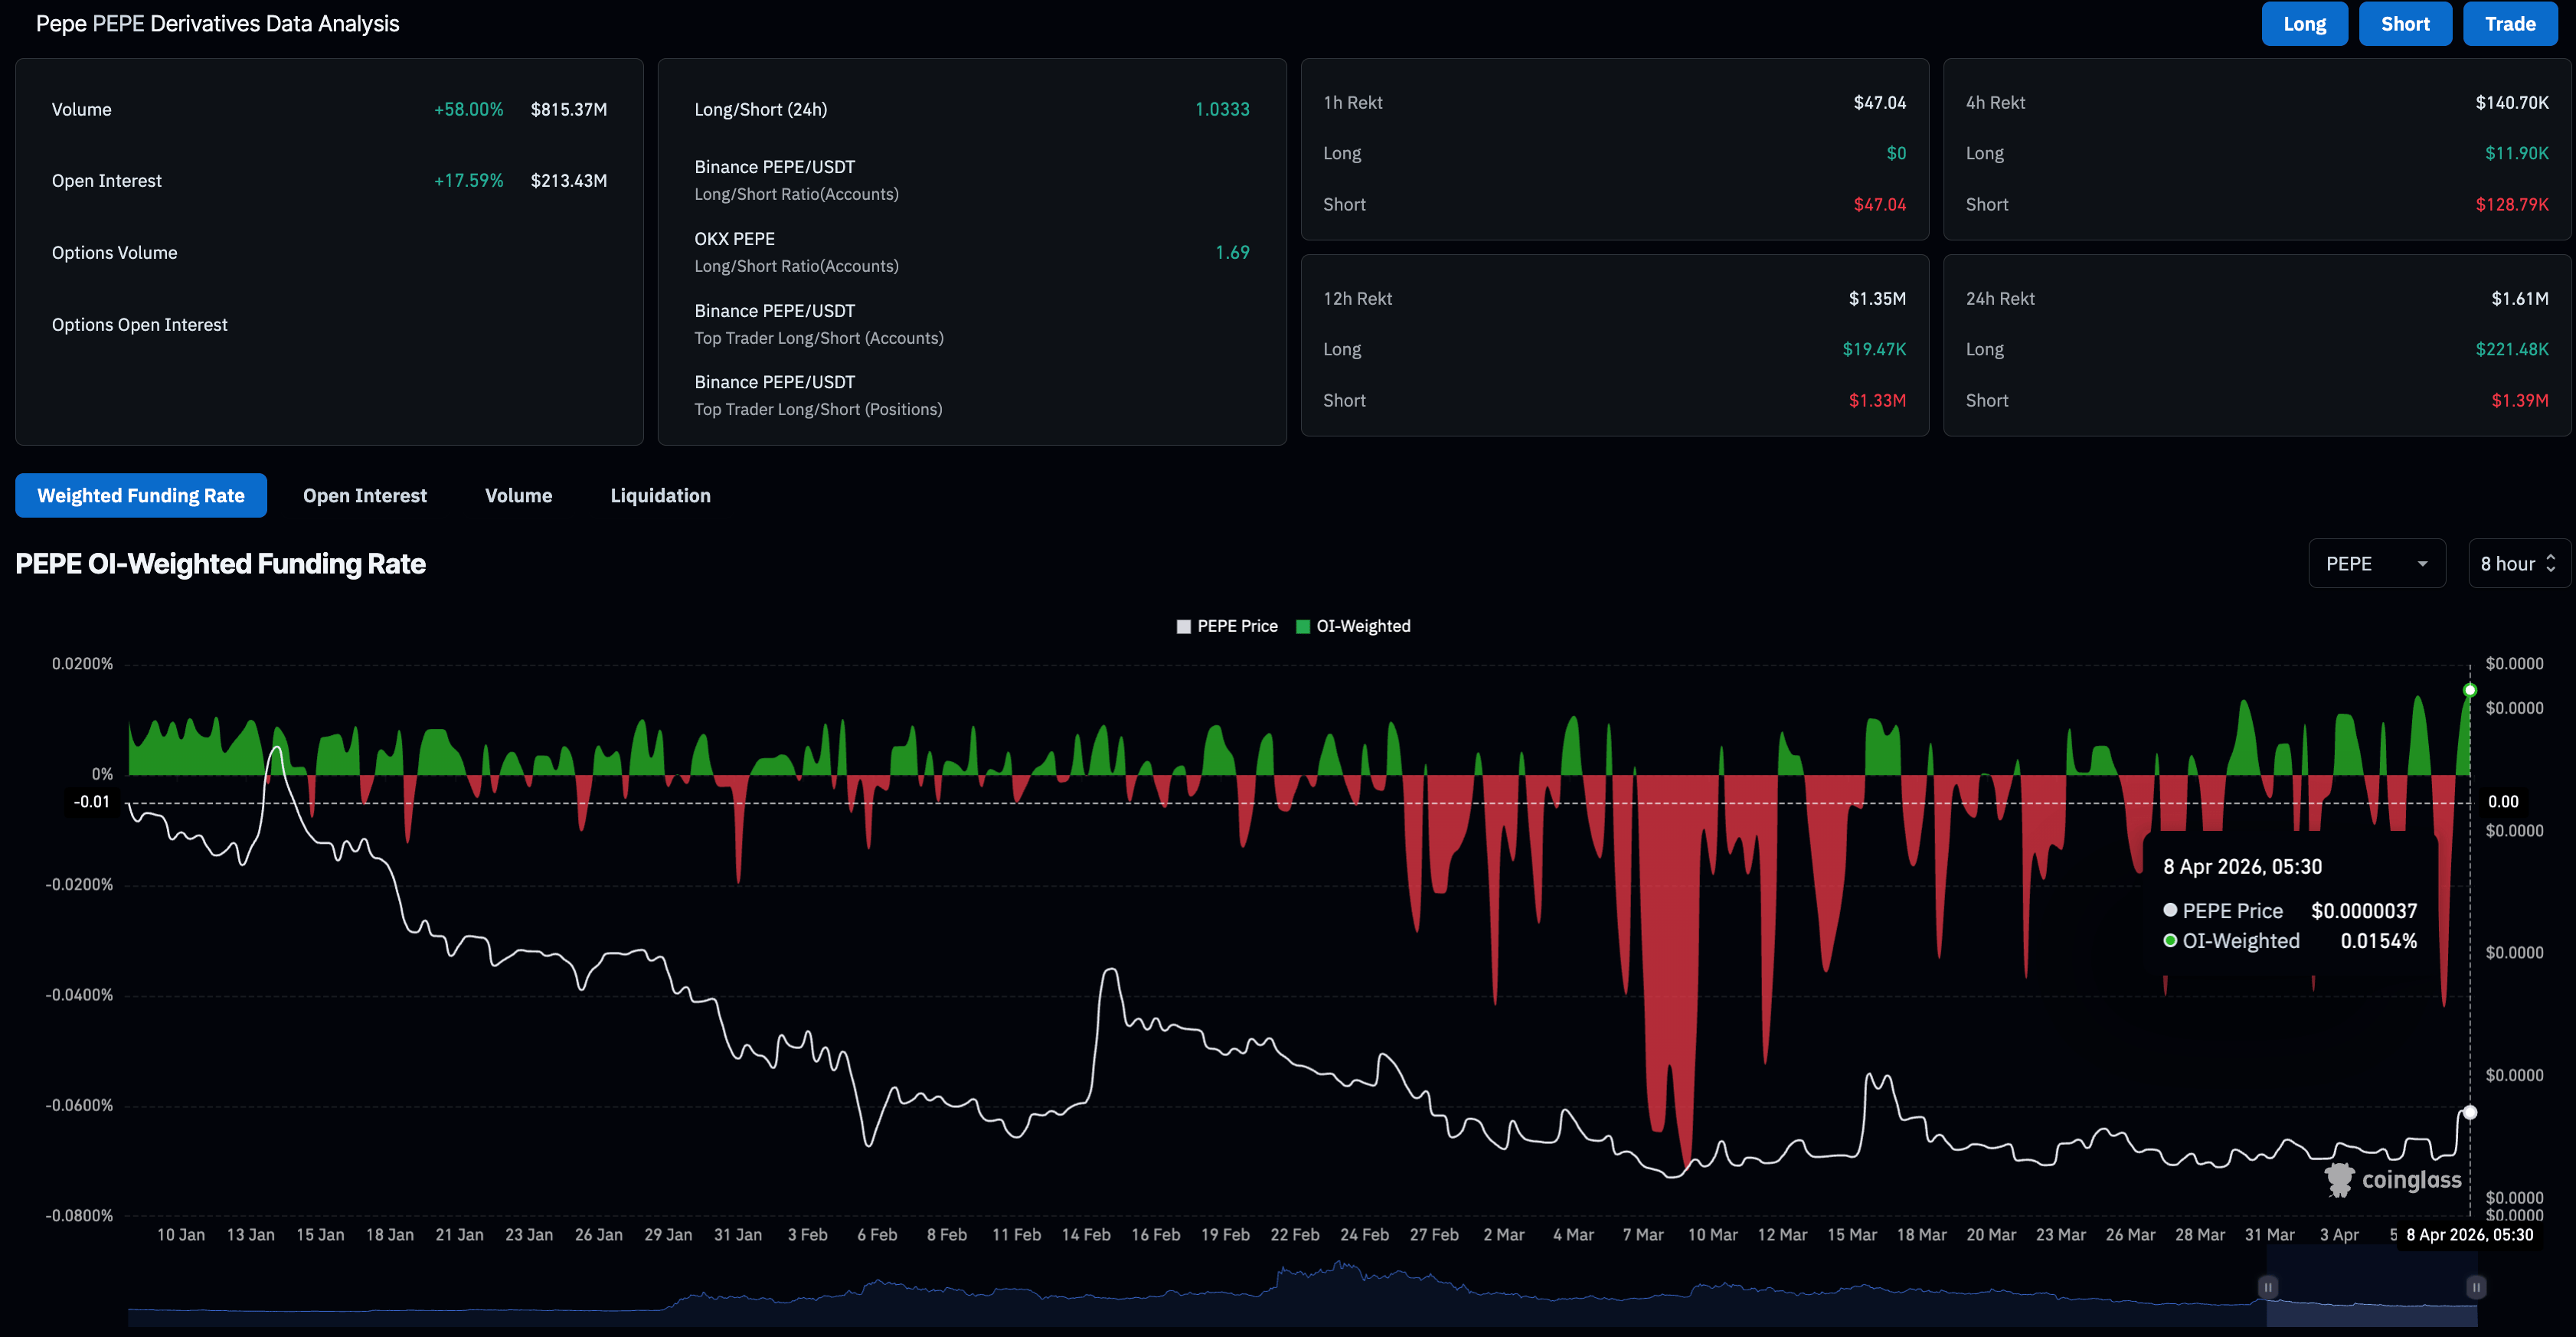
PEPE is gaining momentum on the retail front as easing geopolitical tensions in the Middle East are renewing broader market risk-on sentiment. CoinGlass data shows the PEPE futures Open Interest (OI) is at $213.43 million on Wednesday, up over 17% in the last 24 hours, suggesting heightened leverage exposure or positional buildup boosting the notional value of outstanding contracts.
Meanwhile, the OI-weighted funding rate has flipped positive to 0.0154%, and the 24-hour total liquidations in PEPE futures reached $1.61 million, led by $ 1.39 million in short liquidations, reaffirming the bullish bias among traders.
A sustained recovery in the broader market could fuel demand for PEPE and other meme coins, which typically rise amid investor speculation and greed.
Will Pepe rally again?
PEPE trades above its 50-day EMA at $0.00000364 and a broken descending resistance trendline at press time on Wednesday after a 12% jump the previous day. However, the price remains below the descending 100- and 200-day EMAs, reflecting a short-term recovery in the broader downward trend.
The Moving Average Convergence Divergence (MACD) line hovers around the zero line with no meaningful separation from its signal line, reinforcing the absence of clear bullish momentum. The Relative Strength Index (RSI) near 58 edges above its midline yet lacks follow‑through from price, suggesting only mild latent bullish pressure within an otherwise stalled structure.
On the topside, another decisive close above the 50-day EMA would confirm the breakout rally, which was previously capped twice in the last two months. This would open the path toward the 100-day EMA at $0.00000419 and carve out a more convincing bullish profile.
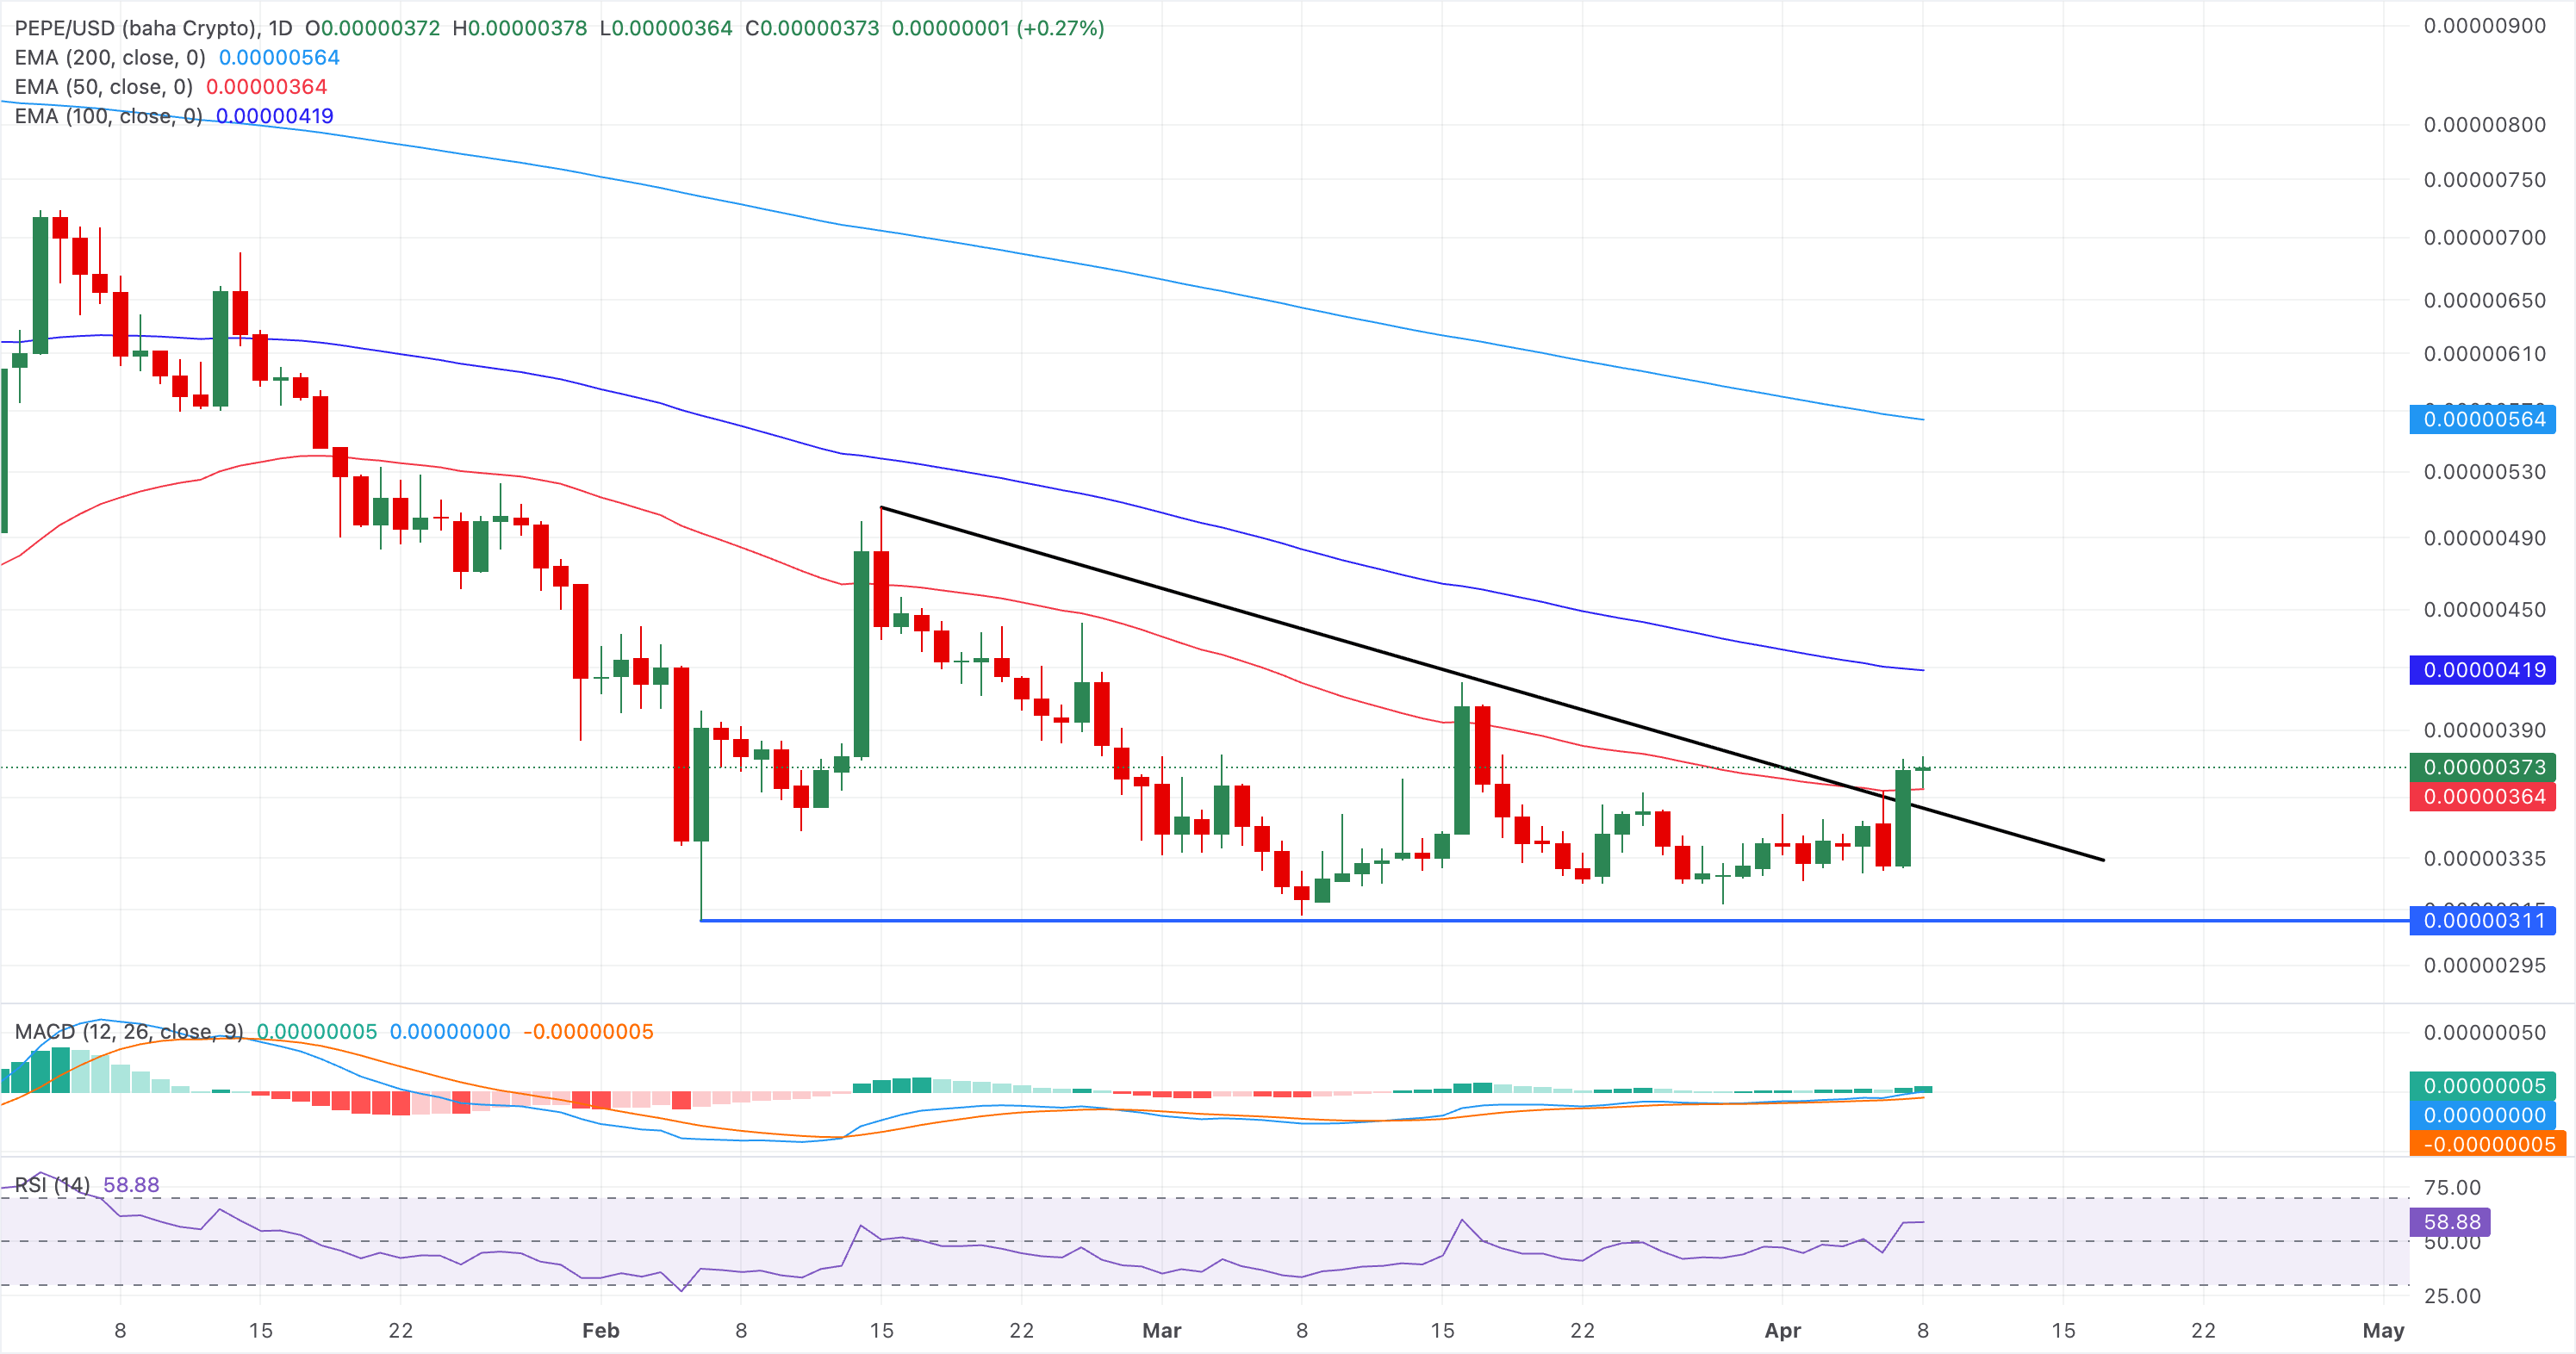
On the flip side, the 50-day EMA at $0.00000364 and the February 6 low at $0.00000311 are two crucial levels of support in sight.
(The technical analysis of this story was written with the help of an AI tool.)

超過一百萬用戶依賴 FXStreet 獲取即時市場數據、圖表工具、專家洞見與外匯新聞。其全面的經濟日曆與教育網路研討會協助交易者保持資訊領先、做出審慎決策。FXStreet 擁有約 60 人的團隊,分布於巴塞隆納總部及全球各地。
閱讀更多


