
Pi Network Price Forecast: PI extends decline as CEX outflows fail to offset bearish pressure
作者 Vishal Dixit
更新: 10 Jun 2026


熱門文章

Pi Network (PI) price edges lower on Wednesday, extending its decline for the third consecutive day this week.
- Pi Network edges lower on Wednesday, extending its third consecutive day of losses.
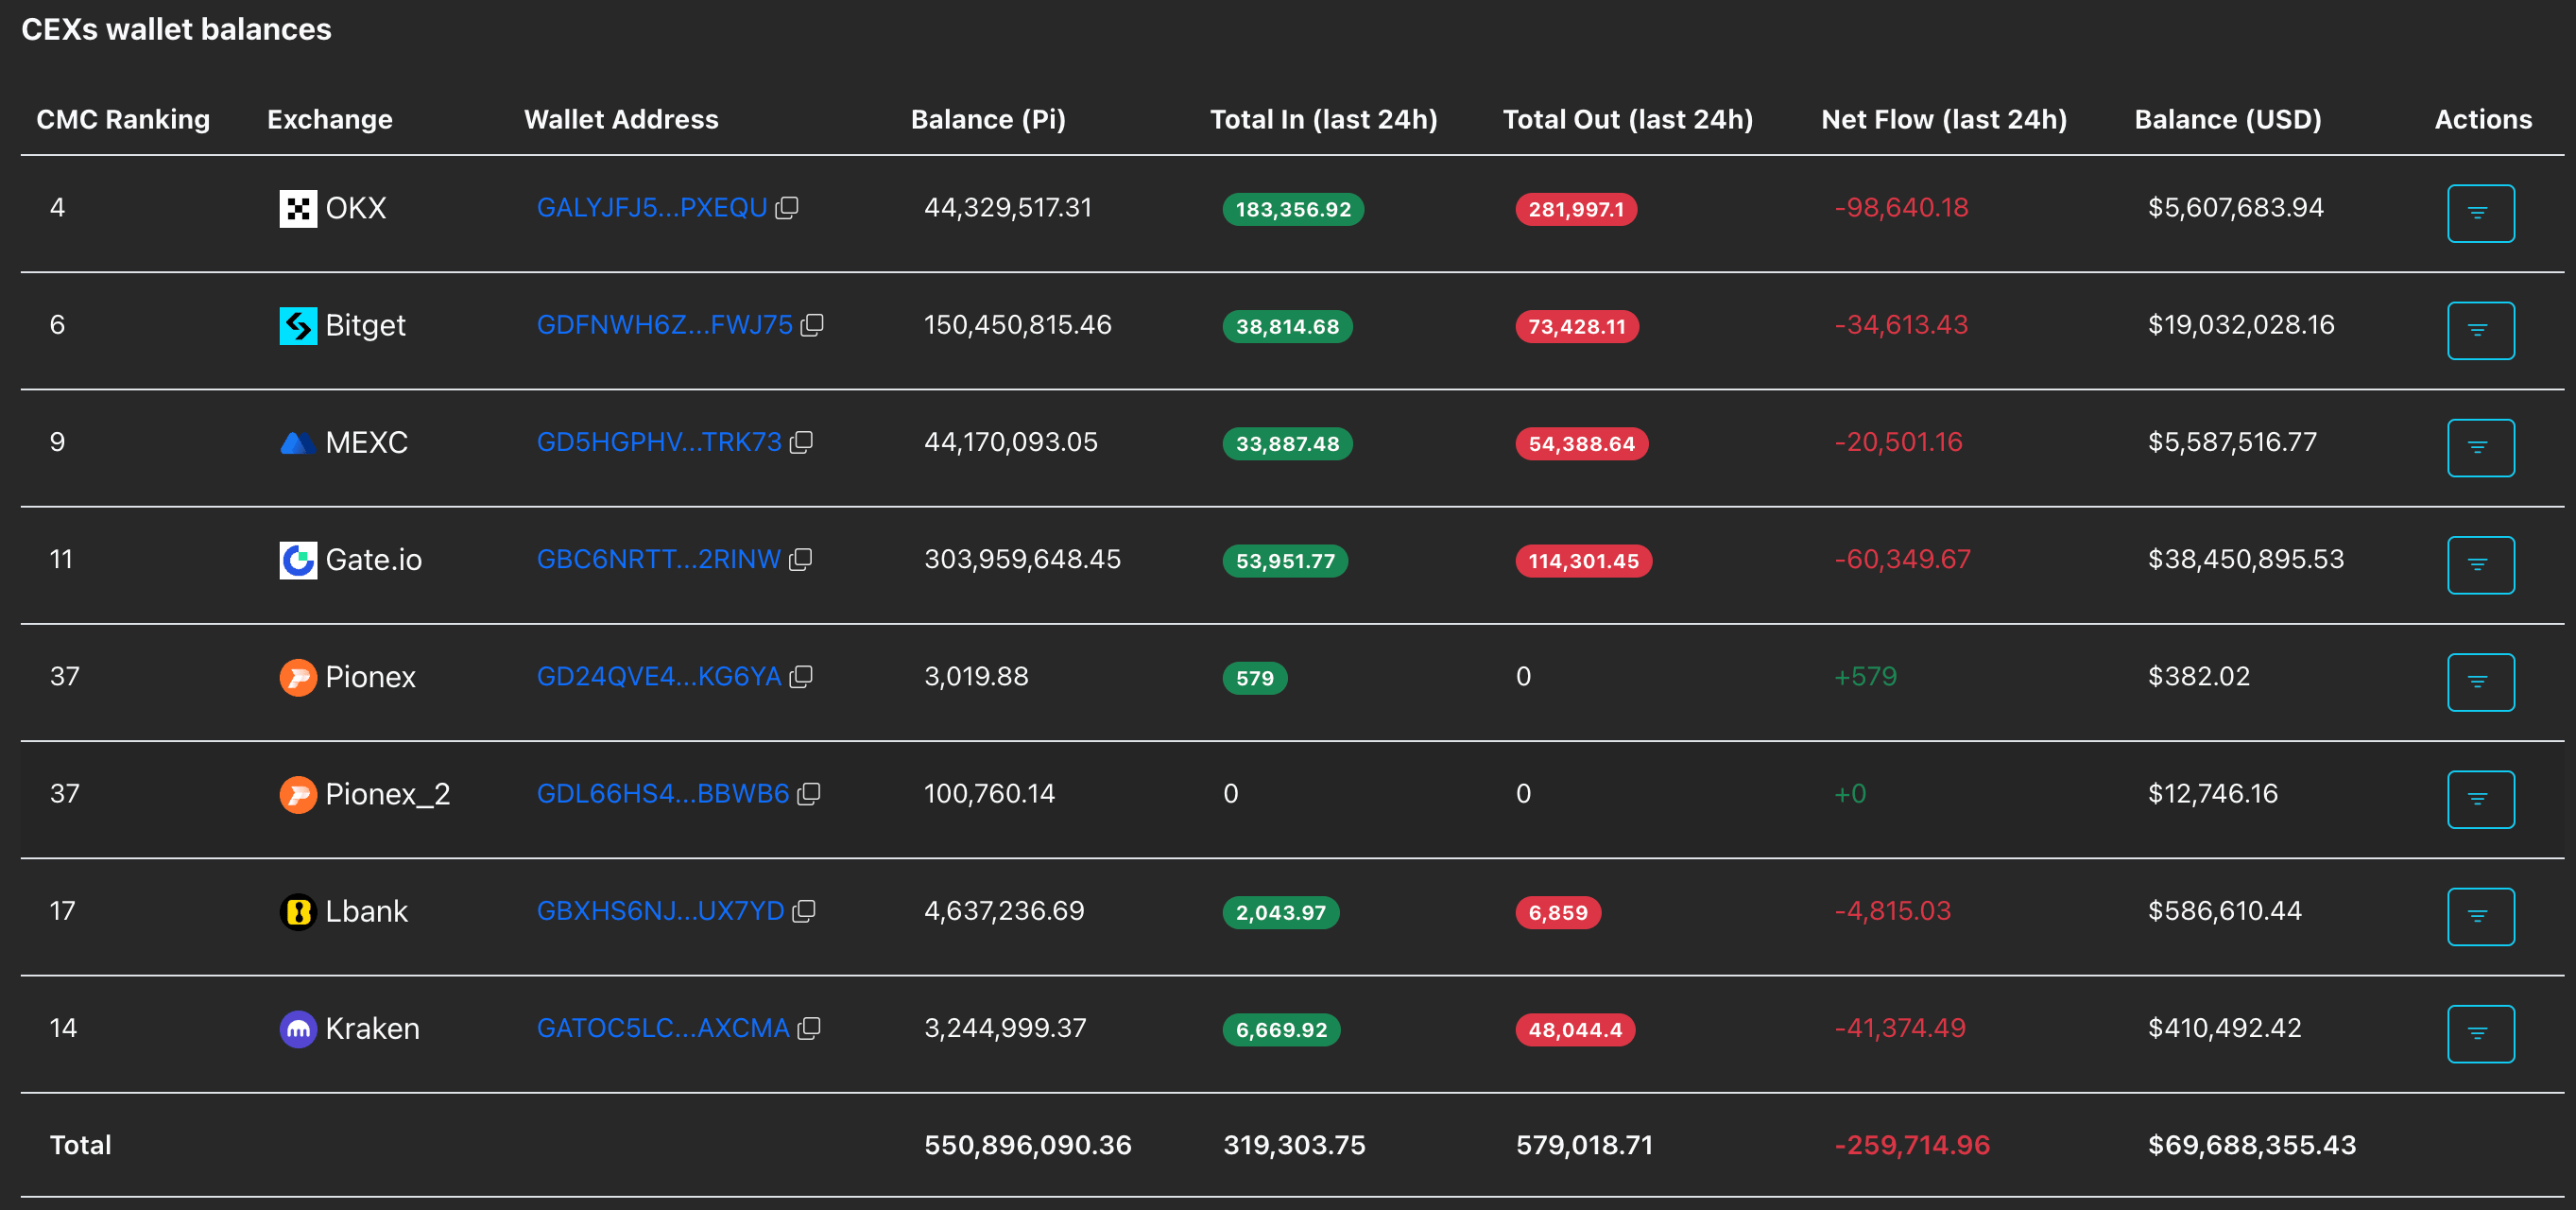
- PiScan data show mild CEX outflows, which fail to offset broader selling pressure.
- The technical outlook for PI is largely bearish, with a risk of a steeper correction below $0.1184.
Pi Network (PI) price edges lower on Wednesday, extending its decline for the third consecutive day this week. Mild outflows from Centralized Exchanges (CEXs) over the last 24 hours have failed to offset broader selling pressure, suggesting further downside risk below the newfound all-time low of $0.1184.
Pi Network's downfall overlooks CEXs flows
The declining demand for Pi Network is consistent with broader downside pressure in the cryptocurrency market, which limits demand for speculative, community-driven projects. That said, Pi Network continues to decline despite a mild outflow of roughly 260,000 PI tokens over the last 24 hours, which typically indicates a drop in available supply pressure on exchanges. This diverging trend suggests that broader selling pressure outweighs the mild buying activity, deepening the downside risk in PI.
Technical outlook: Will PI hold its potential bottom?
Pi Network trades above $0.1250 at press time on Wednesday, maintaining a bearish bias as price remains below a long-standing downward resistance trendline, near $0.1465. The trendline continues to cap recovery attempts, while the 50-, 100-, and 200-day Exponential Moving Averages (EMAs) clustered between roughly $0.15 and $0.20 remain fairly above the price, reaffirming the bearish trend.
That said, the Relative Strength Index (RSI) at 29 on the daily chart hints at oversold conditions but not yet triggering a sustained rebound. Meanwhile, the Moving Average Convergence Divergence (MACD) indicator remains marginally below its signal line, with a weak bearish tone that reinforces the broader downward pressure rather than signaling a decisive reversal.
Looking down, the $0.1184 low from Saturday remains the last line of defense, guarding the downside toward a new all-time low, which could threaten the $0.1000 psychological threshold.
On the topside, initial resistance is located at the $0.1310 horizontal level, which capped Sunday's recovery, followed by the trendline near $0.1465. To reinstate an upward trend, PI should clear the 50-day EMA at $0.1528 with a decisive daily close.
(The technical analysis of this story was written with the help of an AI tool.)
Bitcoin, altcoins, stablecoins FAQs
Bitcoin is the largest cryptocurrency by market capitalization, a virtual currency designed to serve as money. This form of payment cannot be controlled by any one person, group, or entity, which eliminates the need for third-party participation during financial transactions.
Altcoins are any cryptocurrency apart from Bitcoin, but some also regard Ethereum as a non-altcoin because it is from these two cryptocurrencies that forking happens. If this is true, then Litecoin is the first altcoin, forked from the Bitcoin protocol and, therefore, an “improved” version of it.
Stablecoins are cryptocurrencies designed to have a stable price, with their value backed by a reserve of the asset it represents. To achieve this, the value of any one stablecoin is pegged to a commodity or financial instrument, such as the US Dollar (USD), with its supply regulated by an algorithm or demand. The main goal of stablecoins is to provide an on/off-ramp for investors willing to trade and invest in cryptocurrencies. Stablecoins also allow investors to store value since cryptocurrencies, in general, are subject to volatility.
Bitcoin dominance is the ratio of Bitcoin's market capitalization to the total market capitalization of all cryptocurrencies combined. It provides a clear picture of Bitcoin’s interest among investors. A high BTC dominance typically happens before and during a bull run, in which investors resort to investing in relatively stable and high market capitalization cryptocurrency like Bitcoin. A drop in BTC dominance usually means that investors are moving their capital and/or profits to altcoins in a quest for higher returns, which usually triggers an explosion of altcoin rallies.

超過一百萬用戶依賴 FXStreet 獲取即時市場數據、圖表工具、專家洞見與外匯新聞。其全面的經濟日曆與教育網路研討會協助交易者保持資訊領先、做出審慎決策。FXStreet 擁有約 60 人的團隊,分布於巴塞隆納總部及全球各地。
閱讀更多


