
Pi Network Price Forecast: Recovery at risk with 16 million PI tokens ready for unlock
作者 Vishal Dixit
更新: 11 Jun 2026


熱門文章

Pi Network (PI) edges higher on Thursday after three days of consecutive losses earlier this week, extending the prevailing downtrend since late April. The scheduled unlocking of 16 million PI tokens on Thursday could add pressure to the intraday recovery.
- Pi Network edges higher on Thursday, after three consecutive days of losses.
- A fresh supply of 16 million PI tokens, to be unlocked on Thursday, could put pressure on the mild recovery.
- Pi Network maintains a bearish outlook, suggesting a potentially steeper decline below $0.1184.
Pi Network (PI) edges higher on Thursday after three days of consecutive losses earlier this week, extending the prevailing downtrend since late April. The scheduled unlocking of 16 million PI tokens on Thursday could add pressure to the intraday recovery. Technically, PI remains under bearish pressure, which could threaten the newly formed fragile low at $0.1184.
PI token unlock volume could smother the budding demand
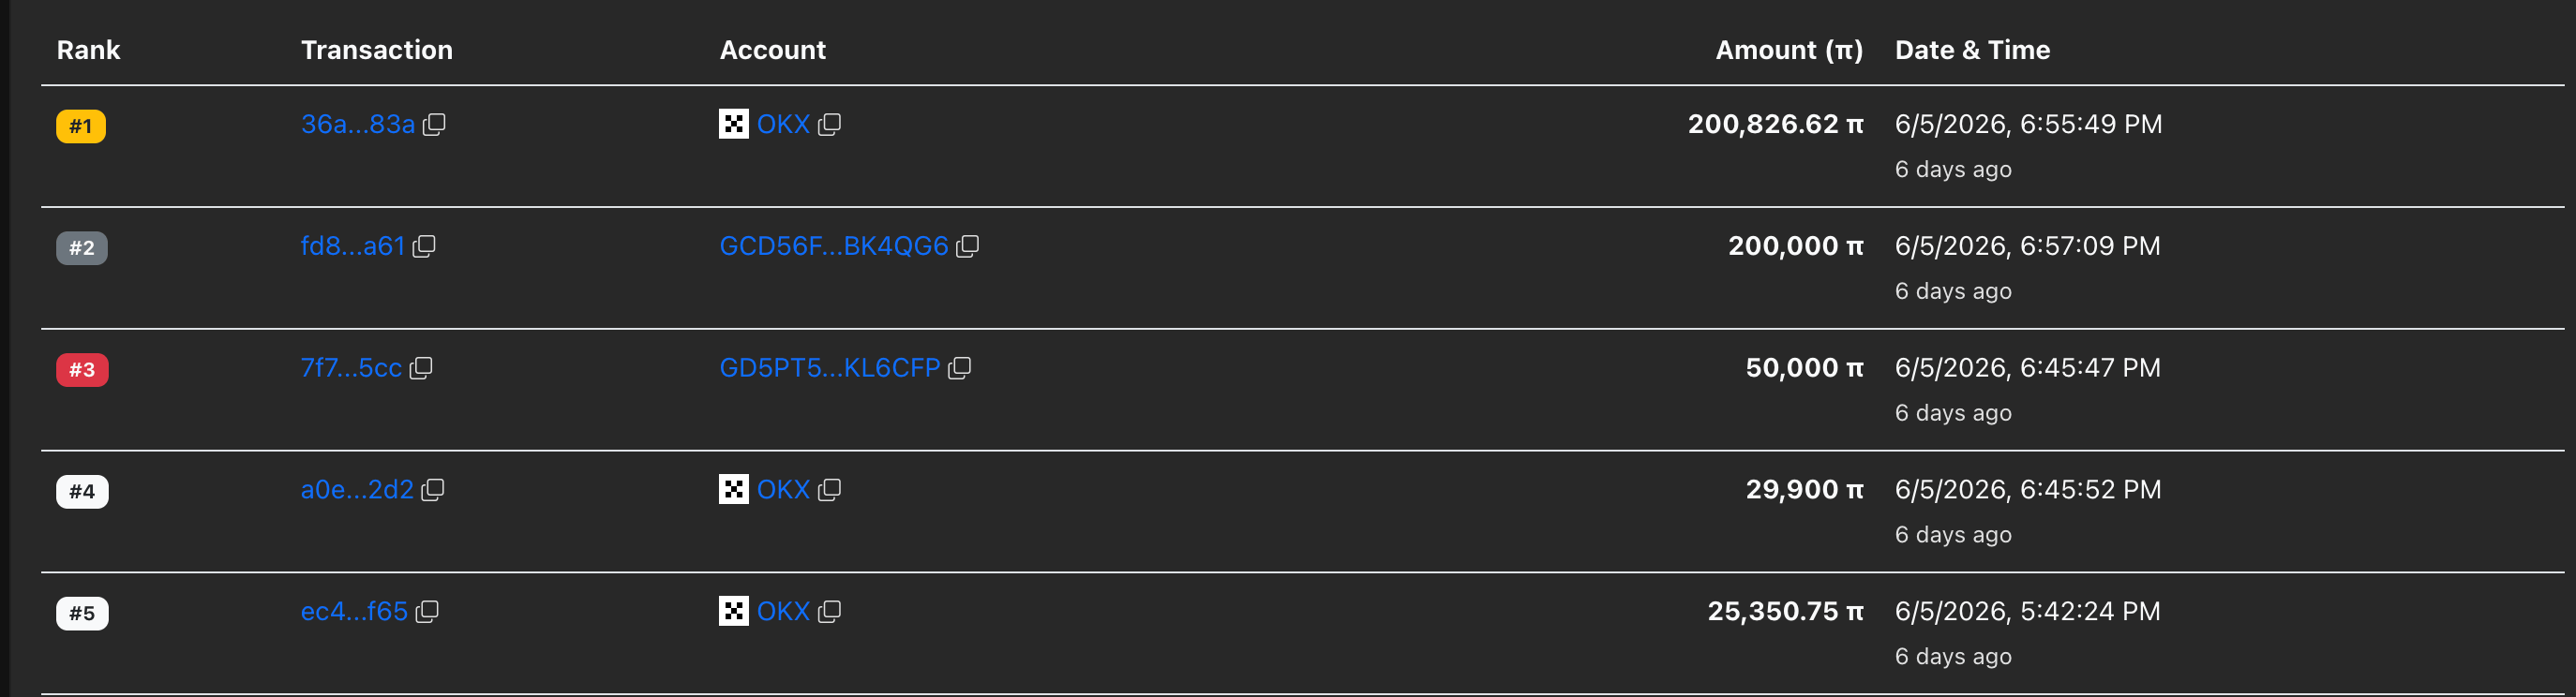
Pi Network shows a minor recovery on Thursday, coinciding with renewed heavy withdrawals. PiScan data shows that three of the five largest transactions on the network have cashed out 255,000 PI tokens over the last 24 hours. However, the looming token unlock could limit this budding demand.
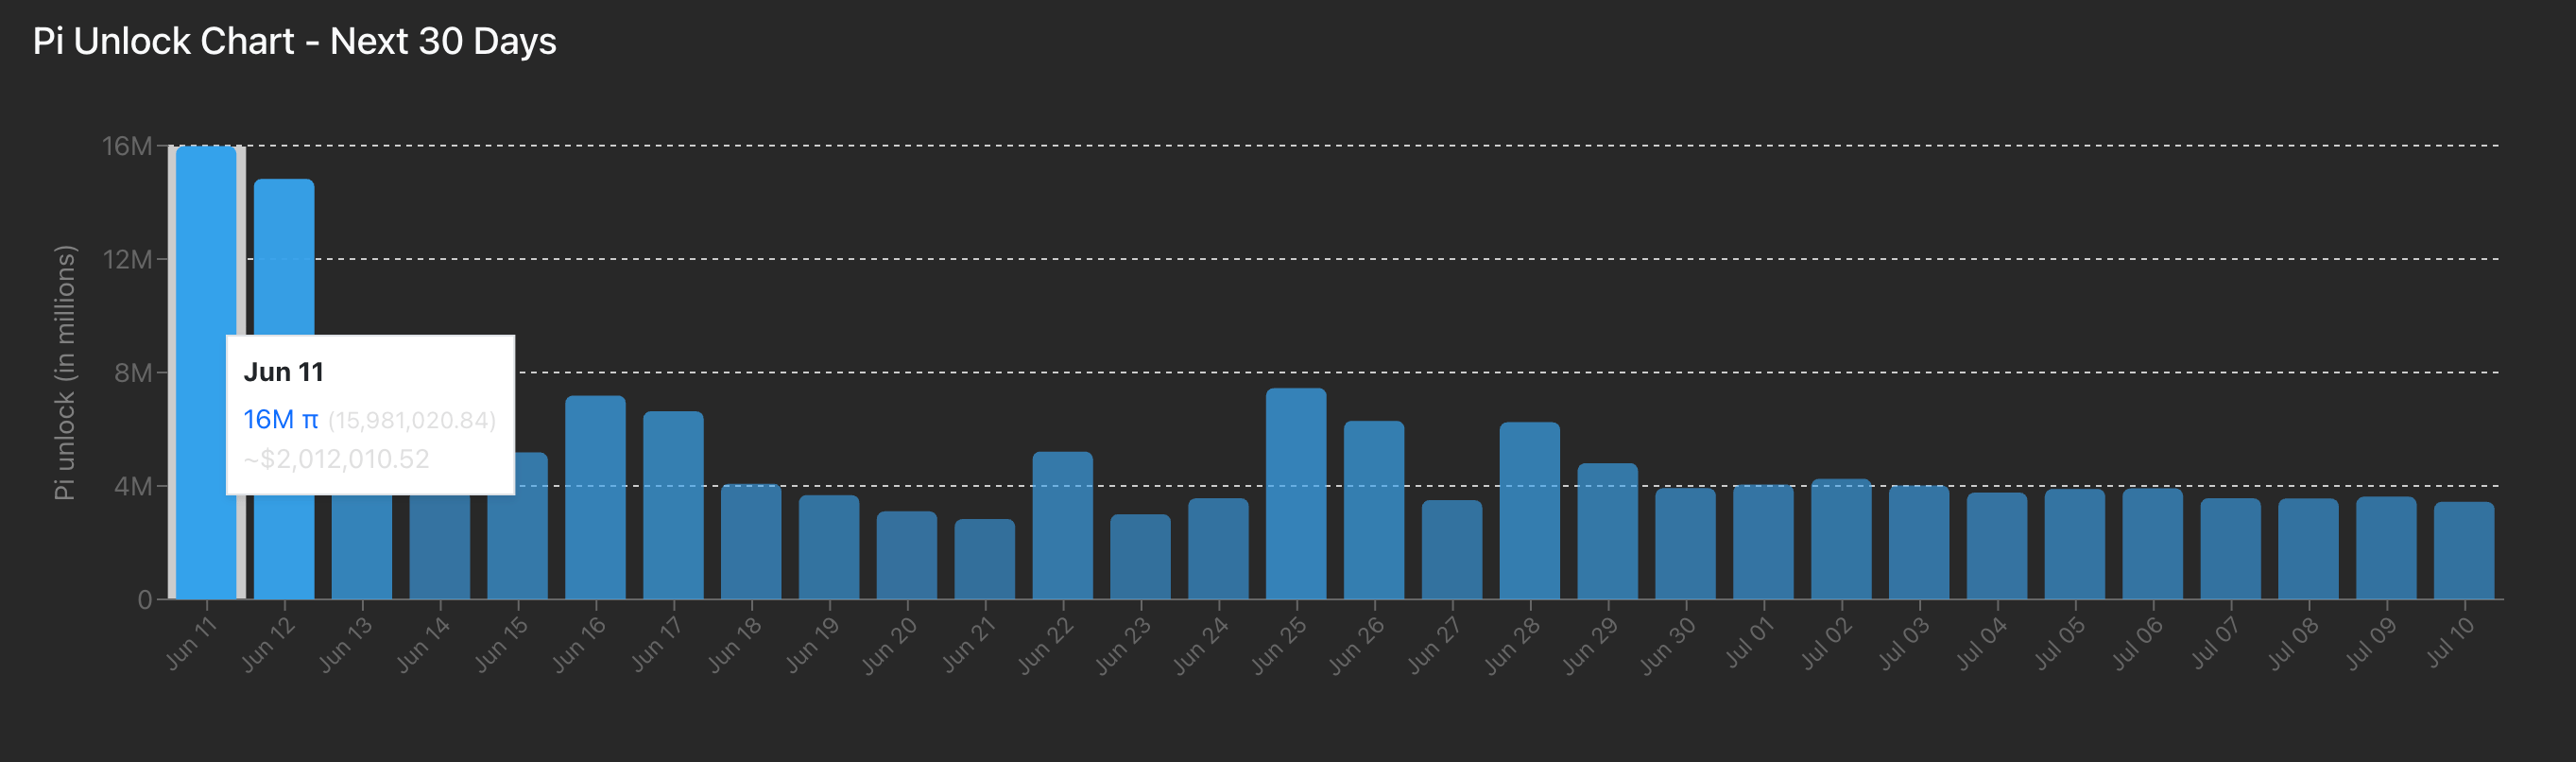
Data show that 16 million tokens will be unlocked on Thursday, followed by 14.8 million PI tokens becoming ready for mainnet migration on Friday. This unlocked supply, which is eligible for mainnet migration, increases the potential for deposits on Centralized Exchanges (CEXs), adding to downside pressure.
Pi Network's recovery could trap fresh buyers
Pi Network trades at above $0.1250 at press time on Thursday, retaining a bearish near-term bias as it holds beneath the 50-, 100-, and 200-period Exponential Moving Averages (EMAs) on the four-hour chart clustered between $0.1300 and $0.1459.
The Moving Average Convergence Divergence (MACD) and signal line hovers slightly in negative territory, while the Relative Strength Index (RSI) at around 43 suggests weak demand, reinforcing the view that bounces are likely to struggle while price remains capped below these dynamic moving averages.
To reinstate a steady recovery, PI should surpass the 50- and 100-period EMAs at $0.1299 and $0.1360, followed by a resistance trendline near $0.1400 that connects the highs of April 29 and May 6.
On the downside, the $0.1184 low formed on Saturday is the last price-tested support level. A slip below this level would expose PI to further weakness toward uncharted lower territory, likely to the $0.1000 psychological mark.
(The technical analysis of this story was written with the help of an AI tool.)
Cryptocurrency metrics FAQs
The developer or creator of each cryptocurrency decides on the total number of tokens that can be minted or issued. Only a certain number of these assets can be minted by mining, staking or other mechanisms. This is defined by the algorithm of the underlying blockchain technology. On the other hand, circulating supply can also be decreased via actions such as burning tokens, or mistakenly sending assets to addresses of other incompatible blockchains.
Market capitalization is the result of multiplying the circulating supply of a certain asset by the asset’s current market value.
Trading volume refers to the total number of tokens for a specific asset that has been transacted or exchanged between buyers and sellers within set trading hours, for example, 24 hours. It is used to gauge market sentiment, this metric combines all volumes on centralized exchanges and decentralized exchanges. Increasing trading volume often denotes the demand for a certain asset as more people are buying and selling the cryptocurrency.
Funding rates are a concept designed to encourage traders to take positions and ensure perpetual contract prices match spot markets. It defines a mechanism by exchanges to ensure that future prices and index prices periodic payments regularly converge. When the funding rate is positive, the price of the perpetual contract is higher than the mark price. This means traders who are bullish and have opened long positions pay traders who are in short positions. On the other hand, a negative funding rate means perpetual prices are below the mark price, and hence traders with short positions pay traders who have opened long positions.

超過一百萬用戶依賴 FXStreet 獲取即時市場數據、圖表工具、專家洞見與外匯新聞。其全面的經濟日曆與教育網路研討會協助交易者保持資訊領先、做出審慎決策。FXStreet 擁有約 60 人的團隊,分布於巴塞隆納總部及全球各地。
閱讀更多


