
Ripple Price Forecast: XRP recovery weakens below $1.50 as undervaluation signal persists
作者 John Isige
更新: 14 May 2026


熱門文章

Ripple (XRP) is struggling to hold above $1.42 short-term support at the time of writing on Thursday, down roughly 5% from the monthly peak around $1.51. The remittance token’s recovery appears lock-step, as risk-off sentiment and softening institutional demand weigh.
- XRP trades above $1.42 short-term support after rejection from the $1.50 supply area, amid muted ETF activity.
- The on-chain MVRV Z-Score metric holds at 0.04, indicating undervaluation and a potential bottom for XRP.
- The 50-day EMA holds as near-term support, but key moving averages cap upward price action.
Ripple (XRP) is struggling to hold above $1.42 short-term support at the time of writing on Thursday, down roughly 5% from the monthly peak around $1.51. The remittance token’s recovery appears lock-step, as risk-off sentiment and softening institutional demand weigh.
Why XRP could be undervalued
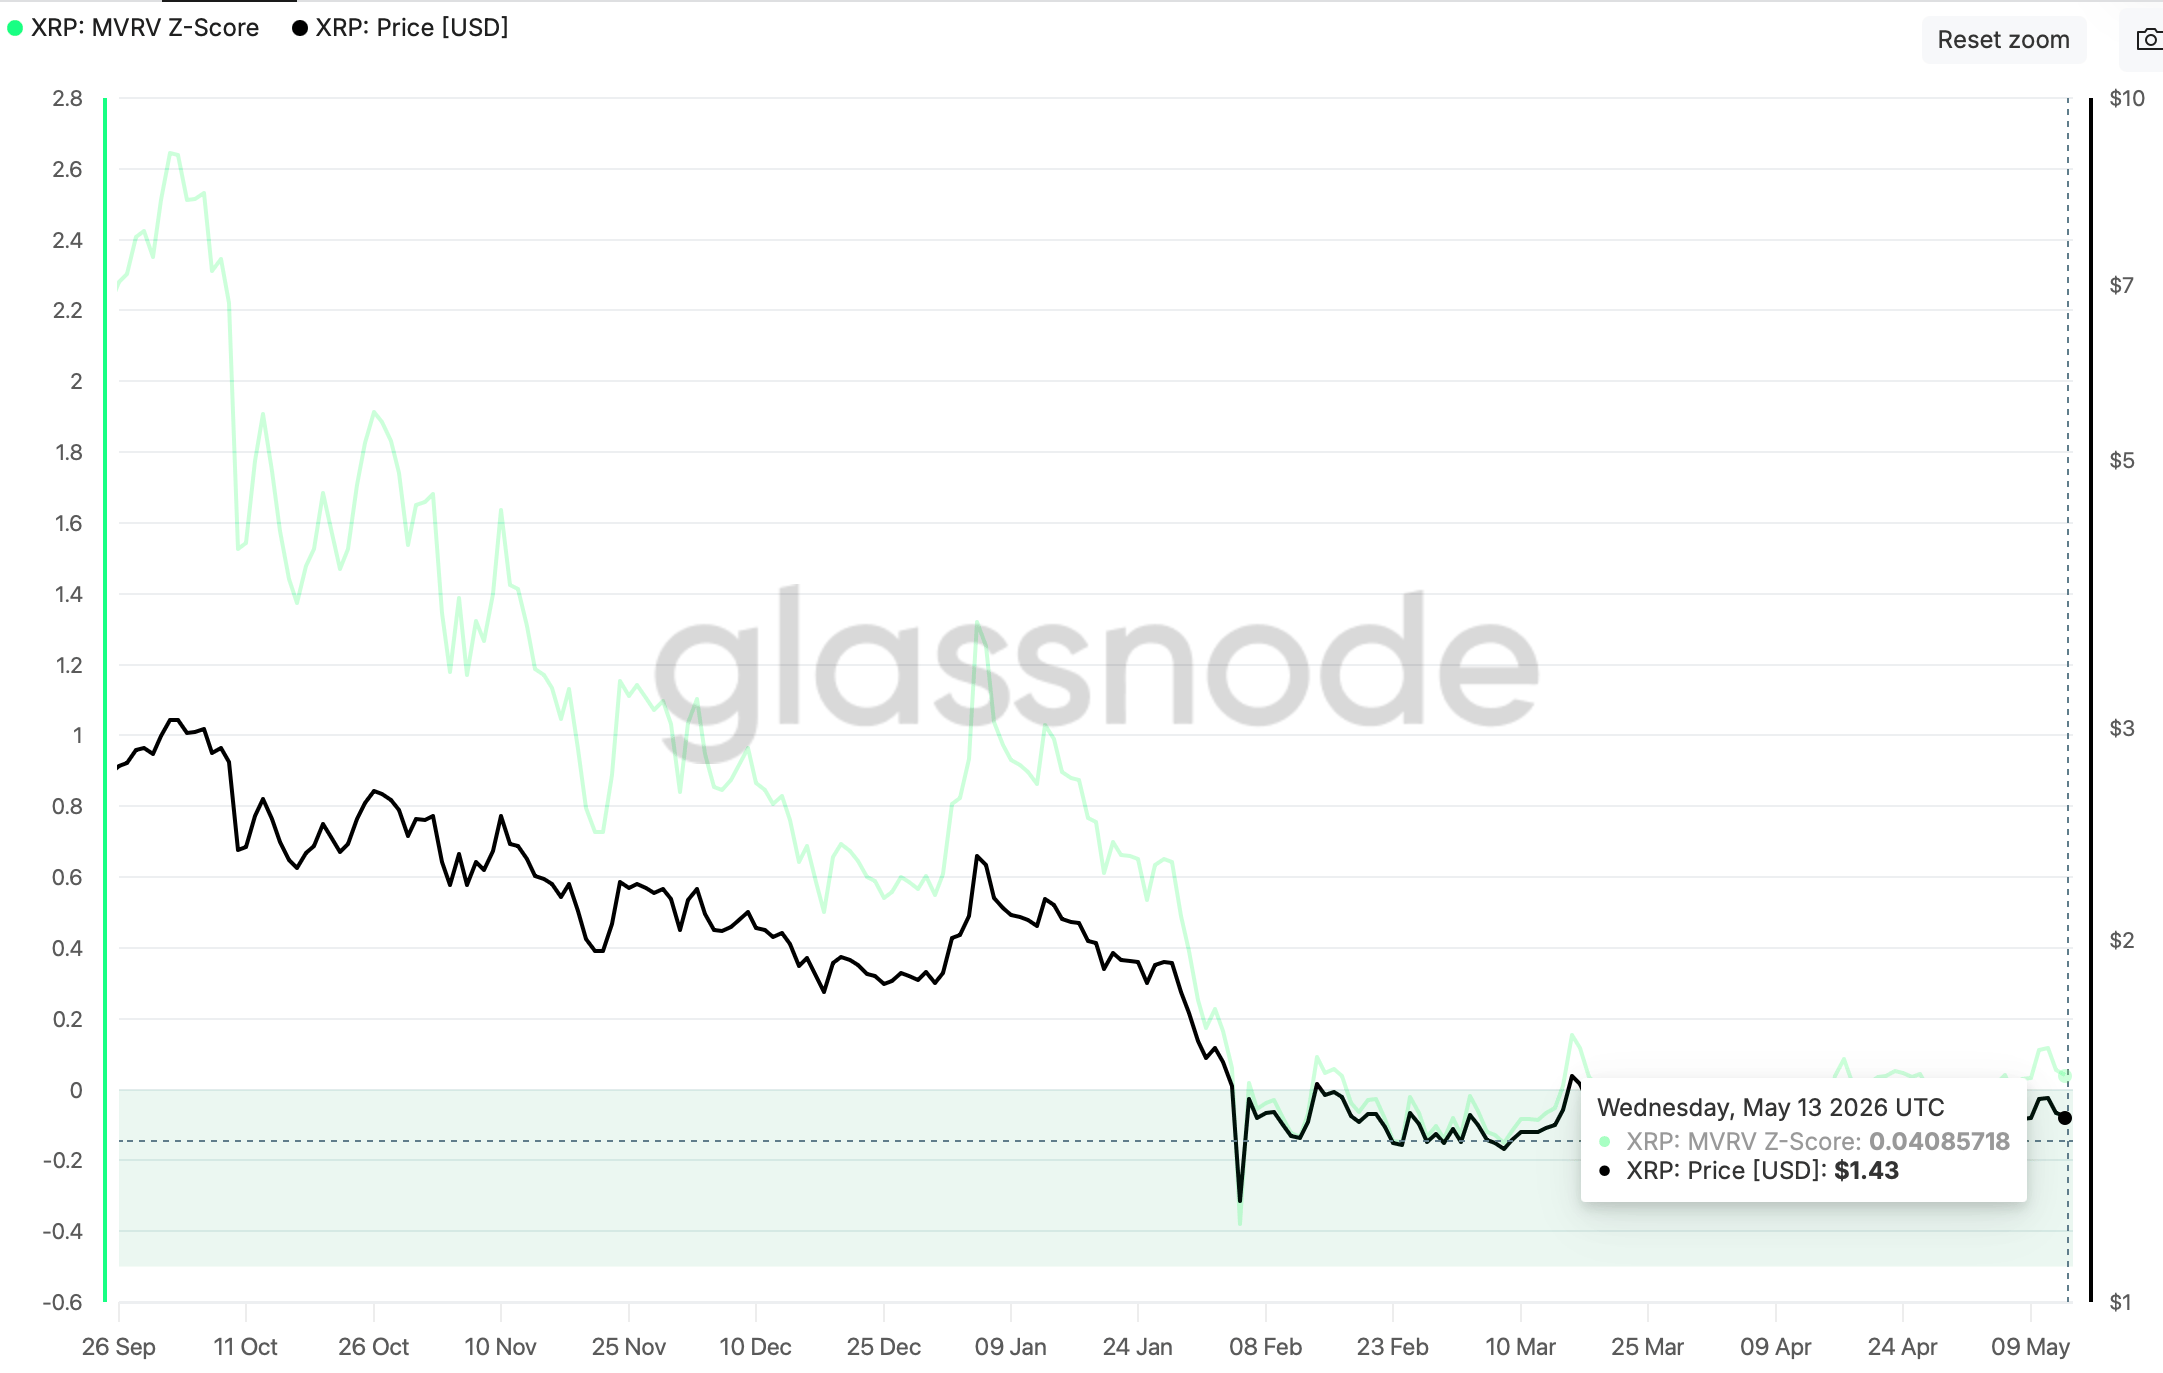
The XRP on-chain Z-Score metric extended its decline to 0.04 on Wednesday, remaining below the token’s realized value. According to Glassnode, the Market Value Realized Value (MVRV) Z-Score evaluates whether XRP is overvalued or undervalued relative to its “fair value.”
When XRP’s market value, calculated by multiplying the spot price by supply, is lower than the realized value, measured by cumulative capital inflows into the asset, it signals a local market bottom.
On the other hand, a market value above the realized value often signals a local market top. The chart below shows the MVRV Z-Score holding persistently slightly above the XRP fair value since early February, suggesting possible undervaluation and a likely local bottom.
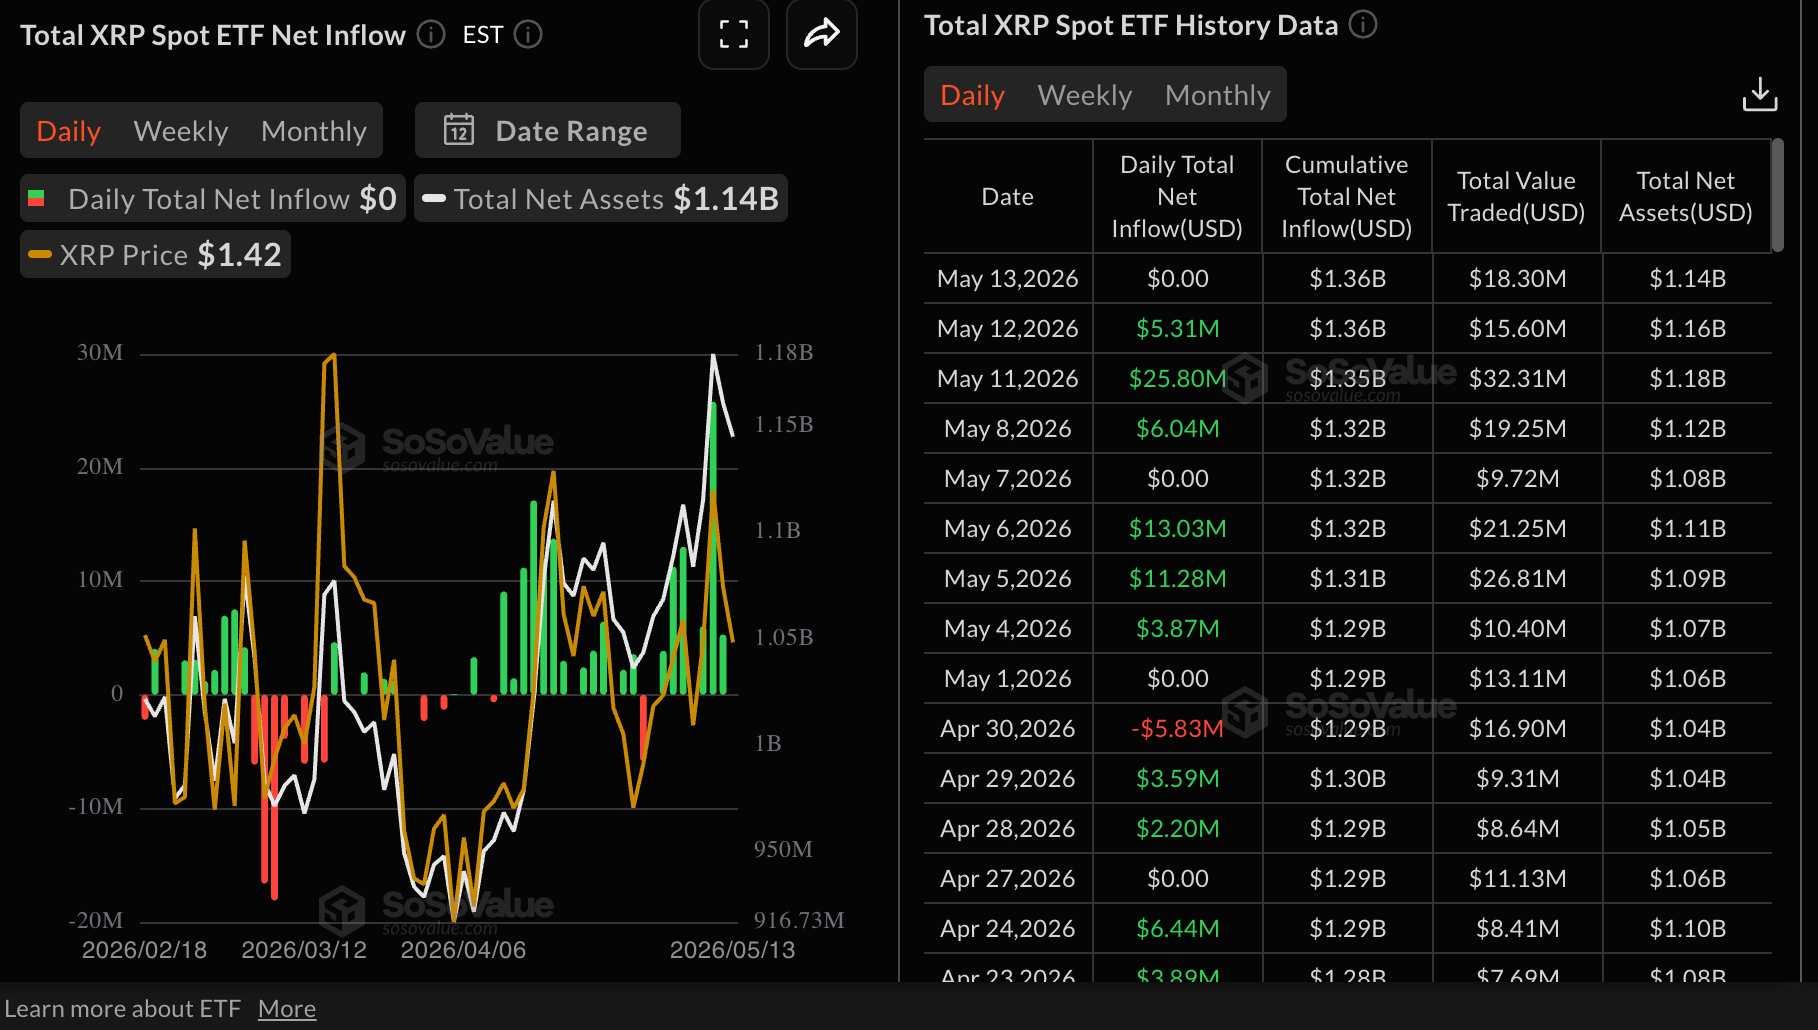
Still, XRP lacks the tailwind to trigger a reversal, despite being undervalued, especially amid faltering demand for spot Exchange-Traded Funds (ETFs). Institutional activity remained muted on Wednesday, with US-listed ETFs not recording any flows. SoSoValue data shows cumulative inflows steady at $1.36 billion, while net assets declined slightly to $1.14 billion, from $1.16 billion the previous day.
Technical analysis: XRP stages fresh recovery bid
XRP trades above $1.42, holding between major Exponential Moving Averages (EMAs), the 50-day EMA at $1.42 and the 100-day EMA at $1.49, leaving the near-term bias broadly neutral. The 200-day EMA, higher up at $1.70, continues to frame the broader bearish structure.
The Relative Strength Index (RSI) around 53 on the daily chart and a slightly positive Moving Average Convergence Divergence (MACD) histogram hint at modest, but not decisive, bullish momentum as price consolidates near the current range.
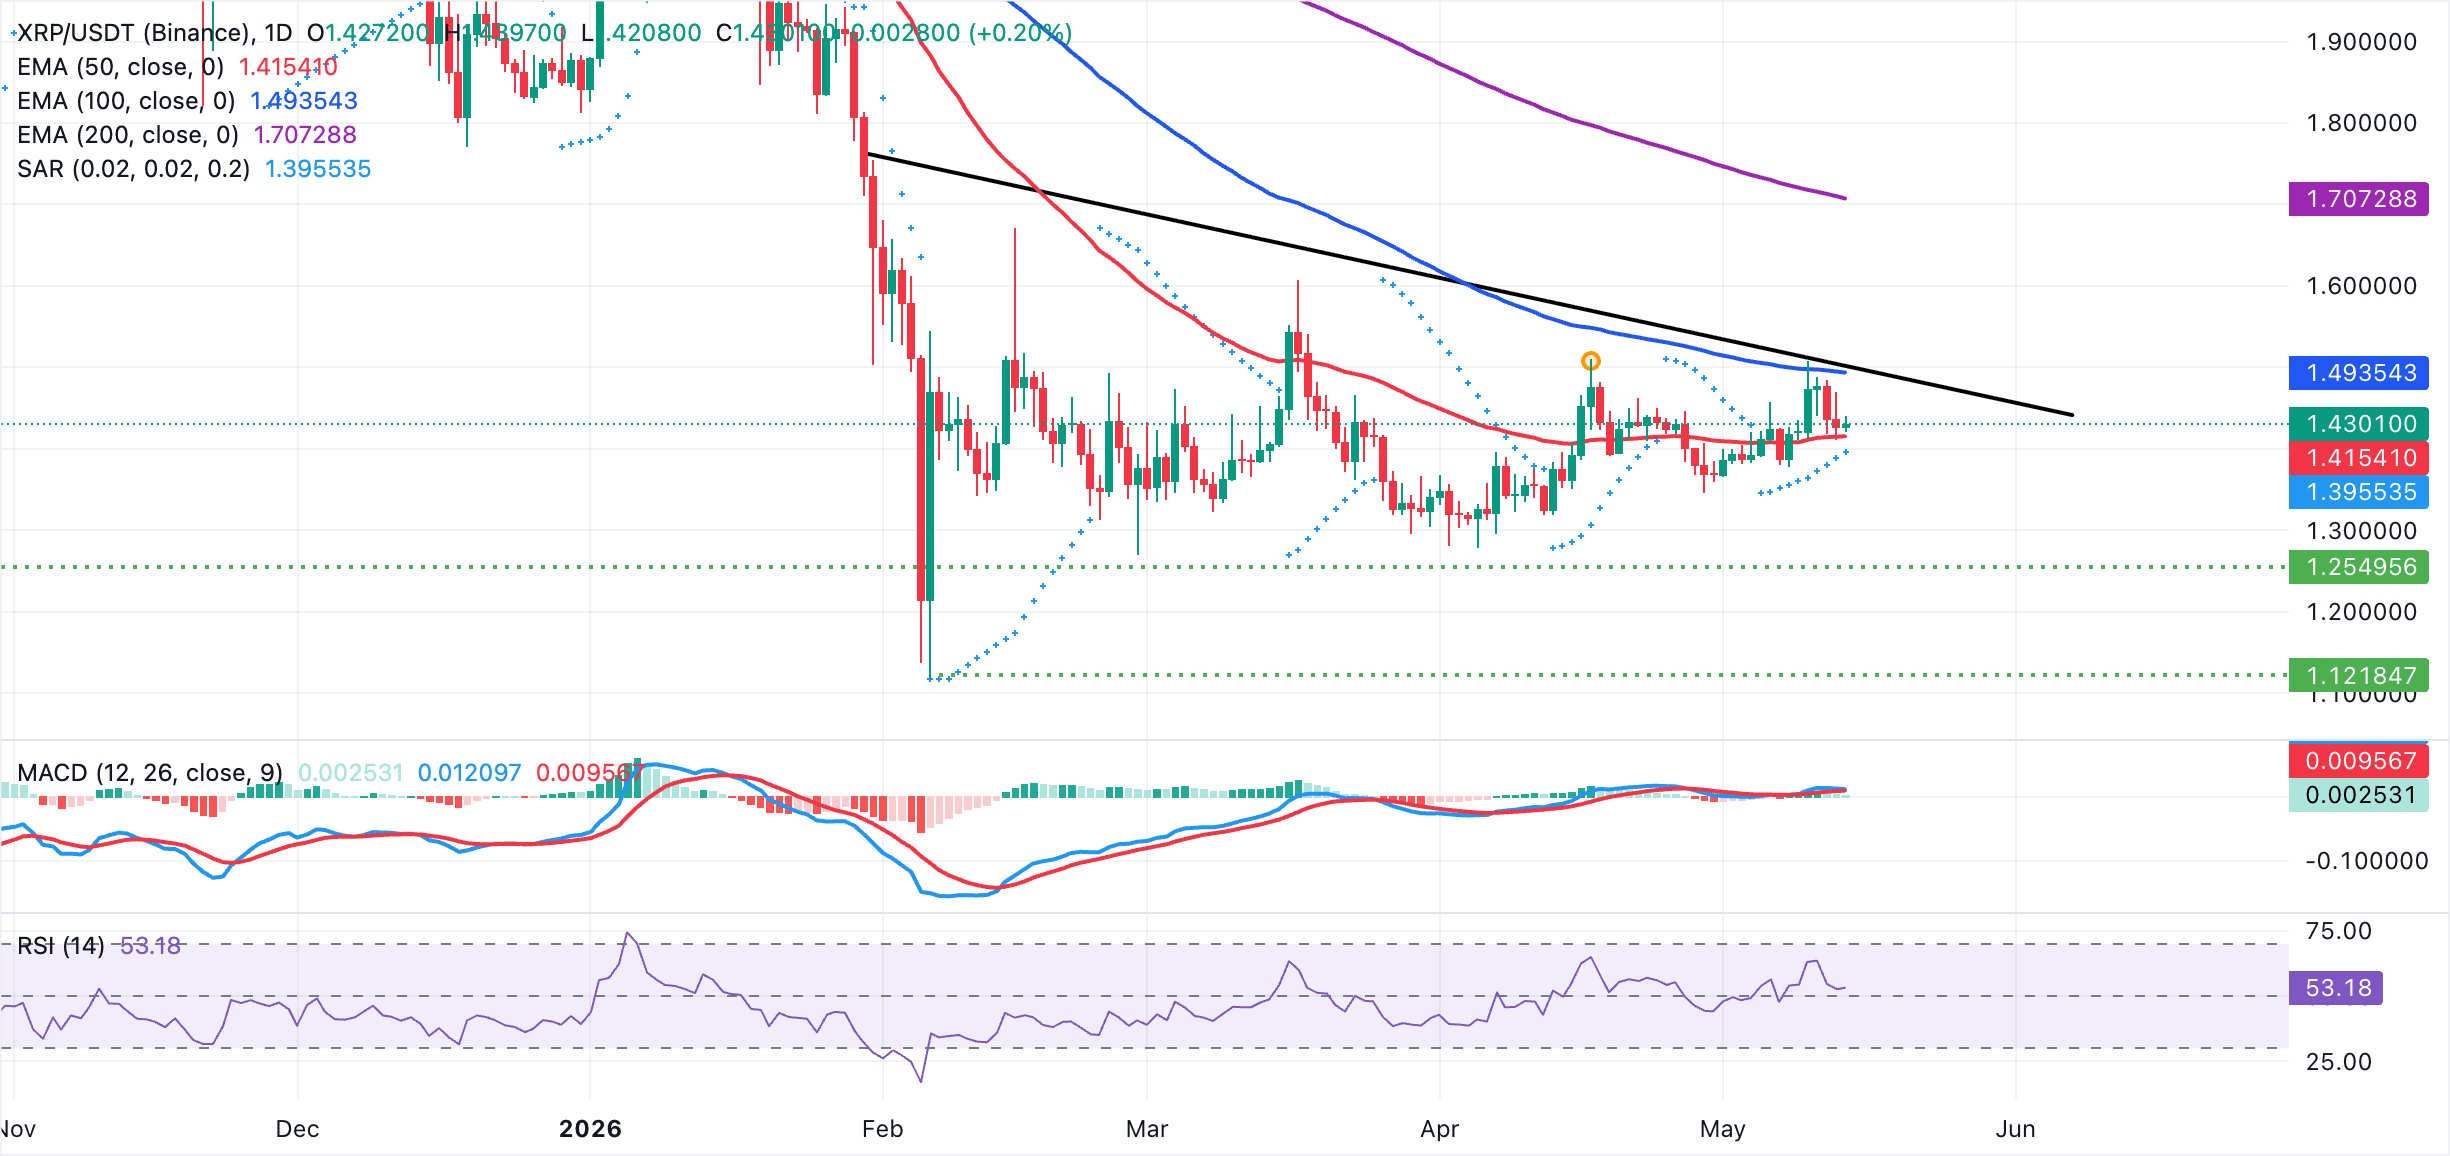
On the topside, immediate resistance lies at $1.45, followed by the 100-day EMA around $1.49 and the downward resistance trendline near $1.50. Moreover, the 200-day EMA at $1.70 serves as a more distant cap if buyers extend the recovery. On the downside, initial support lies at the 50-day EMA around $1.42, reinforced by the latest Parabolic SAR print at $1.40. A sustained break below these levels would expose the pair to deeper corrective pressure despite the current neutral tone.
(The technical analysis of this story was written with the help of an AI tool.)
Cryptocurrency metrics FAQs
The developer or creator of each cryptocurrency decides on the total number of tokens that can be minted or issued. Only a certain number of these assets can be minted by mining, staking or other mechanisms. This is defined by the algorithm of the underlying blockchain technology. On the other hand, circulating supply can also be decreased via actions such as burning tokens, or mistakenly sending assets to addresses of other incompatible blockchains.
Market capitalization is the result of multiplying the circulating supply of a certain asset by the asset’s current market value.
Trading volume refers to the total number of tokens for a specific asset that has been transacted or exchanged between buyers and sellers within set trading hours, for example, 24 hours. It is used to gauge market sentiment, this metric combines all volumes on centralized exchanges and decentralized exchanges. Increasing trading volume often denotes the demand for a certain asset as more people are buying and selling the cryptocurrency.
Funding rates are a concept designed to encourage traders to take positions and ensure perpetual contract prices match spot markets. It defines a mechanism by exchanges to ensure that future prices and index prices periodic payments regularly converge. When the funding rate is positive, the price of the perpetual contract is higher than the mark price. This means traders who are bullish and have opened long positions pay traders who are in short positions. On the other hand, a negative funding rate means perpetual prices are below the mark price, and hence traders with short positions pay traders who have opened long positions.

超過一百萬用戶依賴 FXStreet 獲取即時市場數據、圖表工具、專家洞見與外匯新聞。其全面的經濟日曆與教育網路研討會協助交易者保持資訊領先、做出審慎決策。FXStreet 擁有約 60 人的團隊,分布於巴塞隆納總部及全球各地。
閱讀更多


