
Silver Price Forecast: XAG/USD consolidates within bearish flag on 4-hour chart
作者 Vishal Chaturvedi
更新: 8 Apr 2026


熱門文章

Silver (XAG/USD) trades with a positive bias on Wednesday, supported by a broadly weaker US Dollar following a two-week ceasefire agreement between the United States and Iran. At the time of writing, XAG/USD is trading around $74.50, up nearly 2% on the day after hitting an intraday high of $77.65.
- Silver holds firm on Wednesday after rising earlier in the day, supported by a broadly weaker US Dollar.
- Traders continue to assess evolving geopolitical developments amid uncertainty over the durability of the US-Iran ceasefire.
- Technicals show consolidation within a bearish flag on the 4-hour chart.
Silver (XAG/USD) trades with a positive bias on Wednesday, supported by a broadly weaker US Dollar following a two-week ceasefire agreement between the United States and Iran. At the time of writing, XAG/USD is trading around $74.50, up nearly 2% on the day after hitting an intraday high of $77.65.
Despite the softer Greenback, the metal struggles to extend gains as traders continue to assess evolving geopolitical risks. While Crude prices retreated sharply after the ceasefire news, the decline has stalled amid uncertainty around the durability of the agreement.
Reports of airstrikes across the Middle East, including Israeli strikes on Lebanon and attacks reported in Saudi Arabia, the UAE, Kuwait, Qatar, and Bahrain, highlight persistent tensions. Iranian officials have also warned that Tehran could withdraw from the ceasefire agreement if attacks on Lebanon continue.
This keeps markets on edge over whether a full resolution can be reached and whether Oil prices can see a meaningful and sustained decline. Until then, expectations for tighter monetary policy are likely to remain in place, limiting further upside in non-yielding assets like Silver.
From a technical perspective, the 4-hour chart shows XAG/USD trading within a bearish flag pattern. The near-term bias is mixed as prices stabilize between key moving averages.
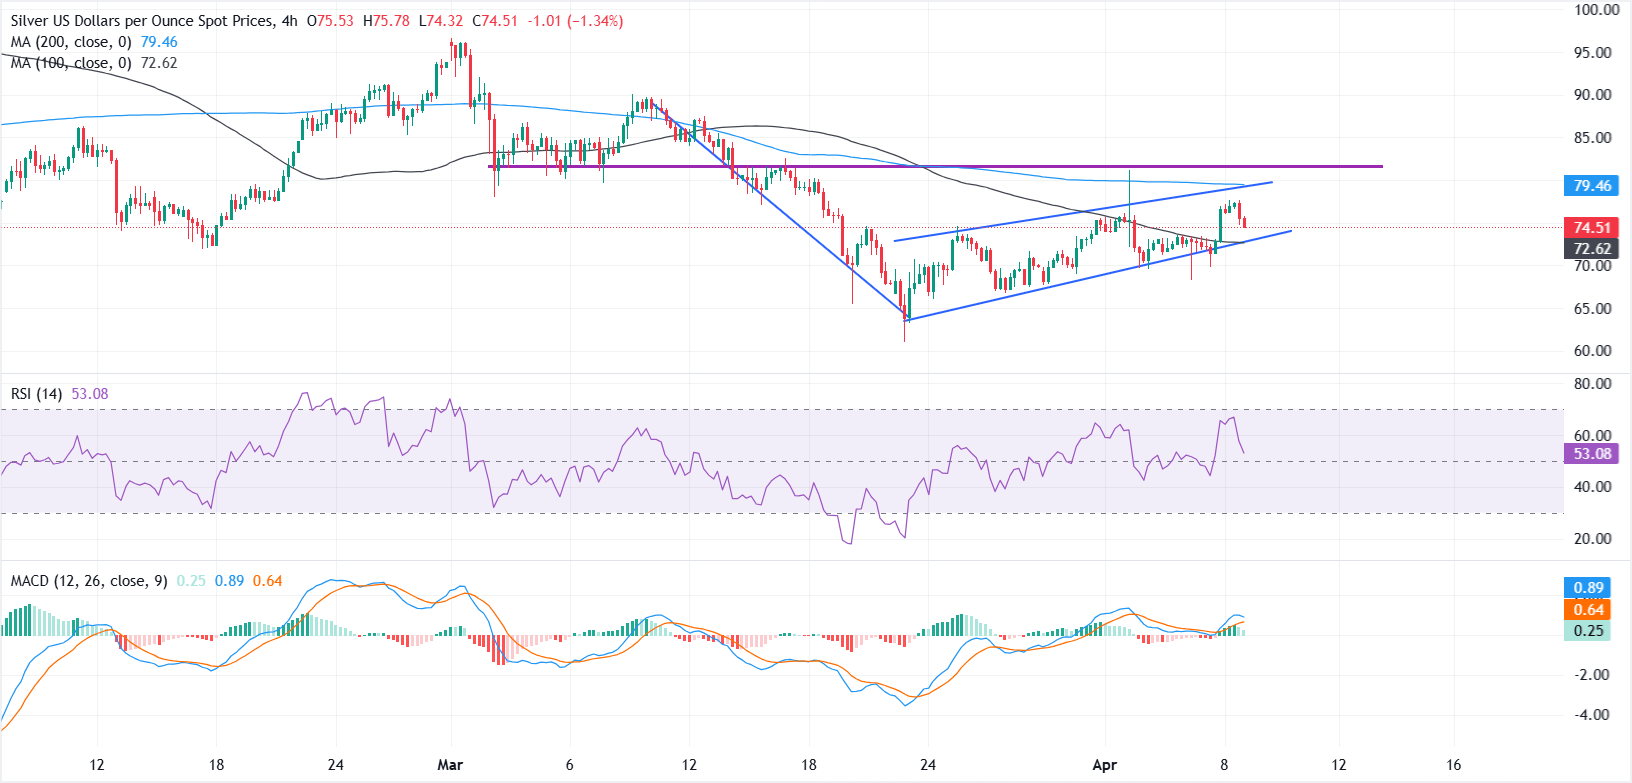
The 100-period Simple Moving Average (SMA) at $72.63, which closely aligns with the lower boundary of the flag, is acting as immediate support and cushioning the downside. A break below this level could confirm a bearish continuation, exposing the next support at Tuesday’s low near $68.28, followed by the March swing low around $61.00.
On the upside, the 200-period SMA near $79.00 coincides with the upper boundary of the flag and continues to cap gains. A sustained break above this zone would negate the bearish structure and could trigger a recovery toward the mid-$80s, with scope to extend toward the $90.00 region.
Momentum indicators remain mildly constructive. The Relative Strength Index (RSI) is hovering in the mid-50s, while the Moving Average Convergence Divergence (MACD) remains in positive territory, suggesting steady buying interest despite the consolidation within the broader uptrend.
Silver FAQs
Silver is a precious metal highly traded among investors. It has been historically used as a store of value and a medium of exchange. Although less popular than Gold, traders may turn to Silver to diversify their investment portfolio, for its intrinsic value or as a potential hedge during high-inflation periods. Investors can buy physical Silver, in coins or in bars, or trade it through vehicles such as Exchange Traded Funds, which track its price on international markets.
Silver prices can move due to a wide range of factors. Geopolitical instability or fears of a deep recession can make Silver price escalate due to its safe-haven status, although to a lesser extent than Gold's. As a yieldless asset, Silver tends to rise with lower interest rates. Its moves also depend on how the US Dollar (USD) behaves as the asset is priced in dollars (XAG/USD). A strong Dollar tends to keep the price of Silver at bay, whereas a weaker Dollar is likely to propel prices up. Other factors such as investment demand, mining supply – Silver is much more abundant than Gold – and recycling rates can also affect prices.
Silver is widely used in industry, particularly in sectors such as electronics or solar energy, as it has one of the highest electric conductivity of all metals – more than Copper and Gold. A surge in demand can increase prices, while a decline tends to lower them. Dynamics in the US, Chinese and Indian economies can also contribute to price swings: for the US and particularly China, their big industrial sectors use Silver in various processes; in India, consumers’ demand for the precious metal for jewellery also plays a key role in setting prices.
Silver prices tend to follow Gold's moves. When Gold prices rise, Silver typically follows suit, as their status as safe-haven assets is similar. The Gold/Silver ratio, which shows the number of ounces of Silver needed to equal the value of one ounce of Gold, may help to determine the relative valuation between both metals. Some investors may consider a high ratio as an indicator that Silver is undervalued, or Gold is overvalued. On the contrary, a low ratio might suggest that Gold is undervalued relative to Silver.

超過一百萬用戶依賴 FXStreet 獲取即時市場數據、圖表工具、專家洞見與外匯新聞。其全面的經濟日曆與教育網路研討會協助交易者保持資訊領先、做出審慎決策。FXStreet 擁有約 60 人的團隊,分布於巴塞隆納總部及全球各地。
閱讀更多


