
Top 3 Price Prediction: Bitcoin, Ethereum, Ripple – BTC, ETH and XRP upside breakout looms as bulls defend key levels
作者 Manish Chhetri
更新: 10 Apr 2026


熱門文章

Bitcoin (BTC), Ethereum (ETH) and Ripple (XRP) show signs of strength as they hold above key support levels on Friday, after gaining over 4.5%, 4% and 1.5% so far this week. BTC is testing the upper boundary of its consolidation range, while ETH and XRP continue to find support at critical zones.
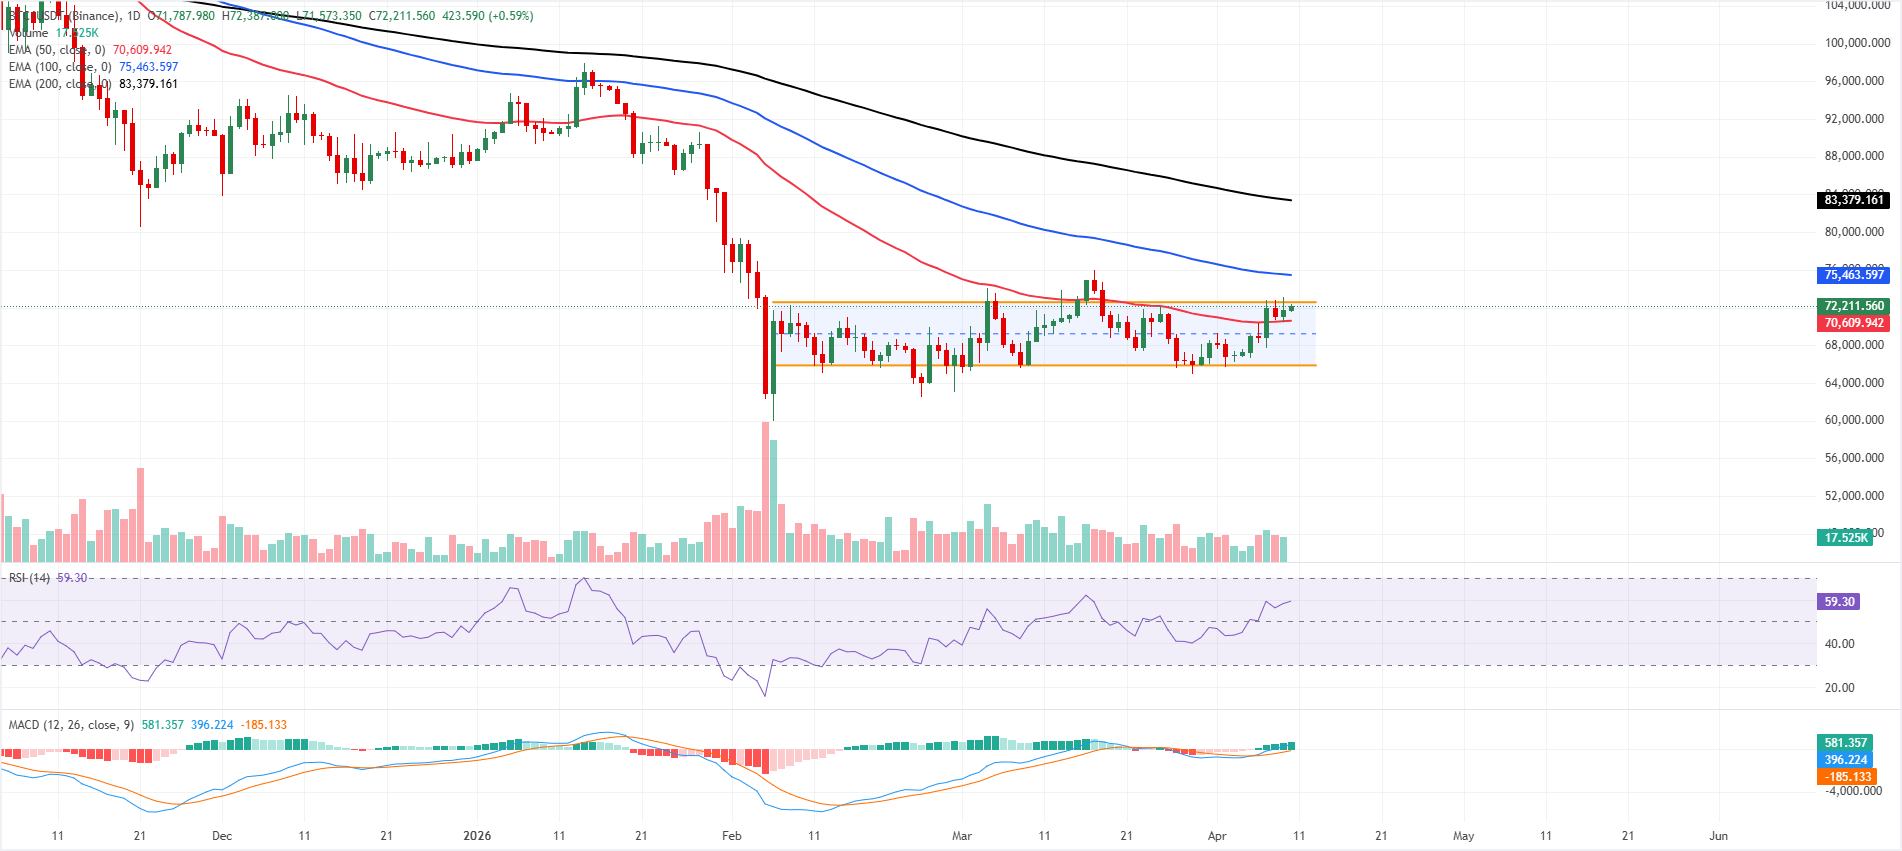
- Bitcoin nears the upper consolidation boundary of a channel, where a breakout would signal a bullish move.
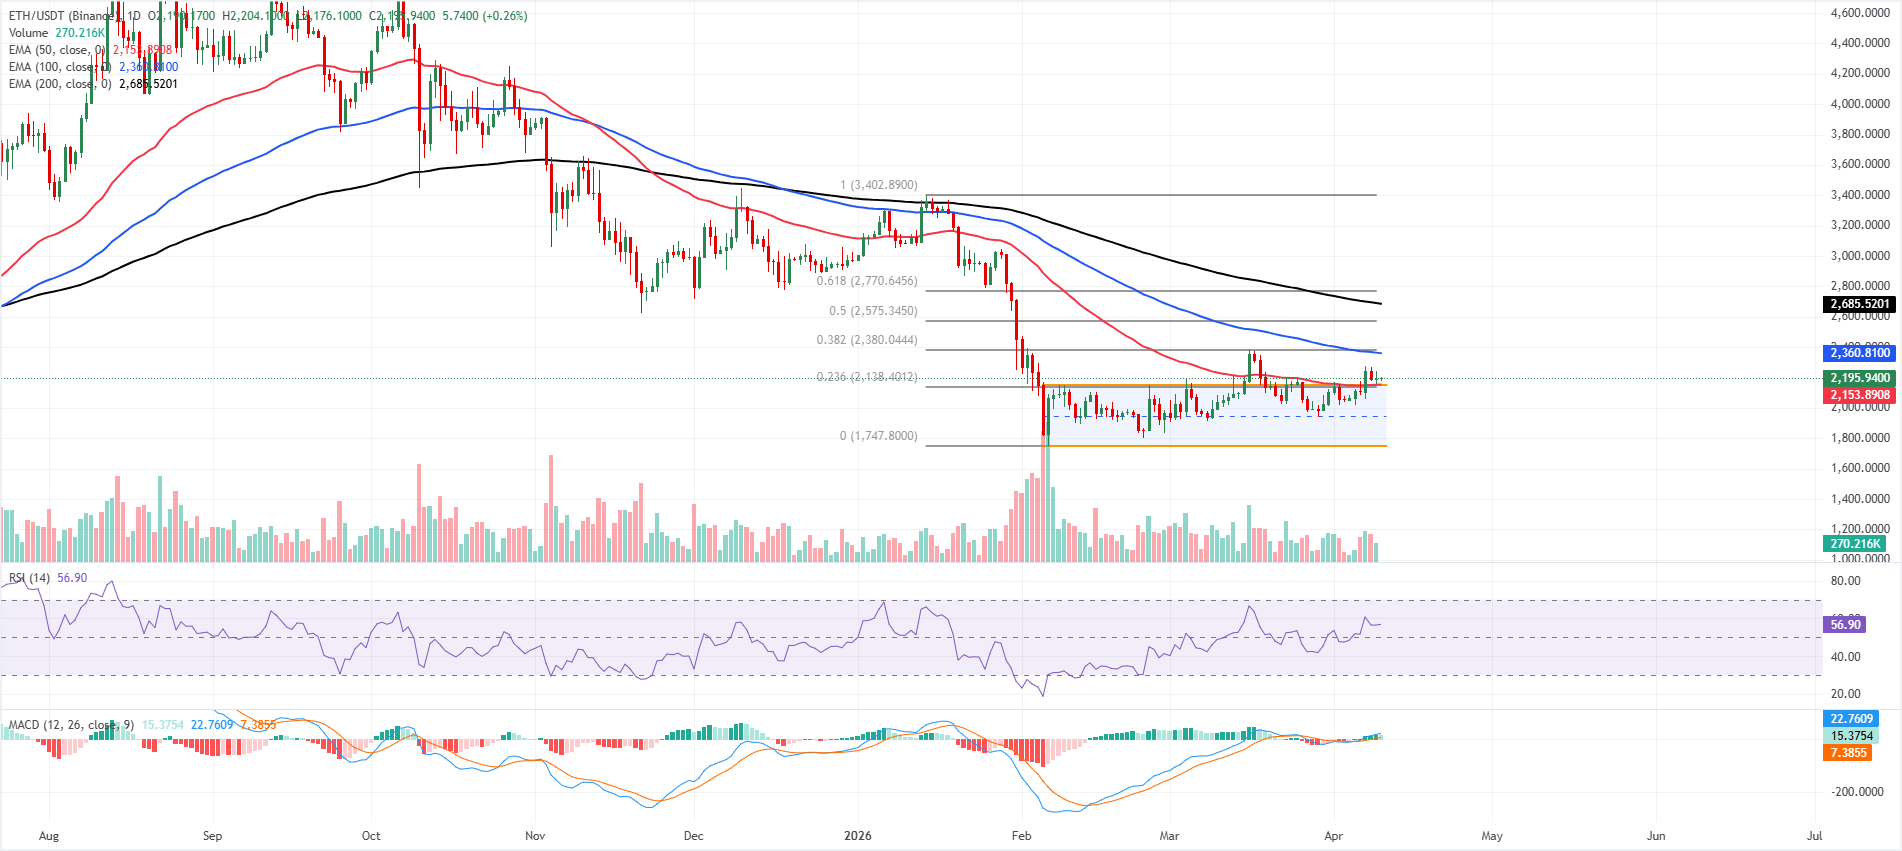
- Ethereum finds support around the 50-day EMA at $2,153, indicating underlying strength.
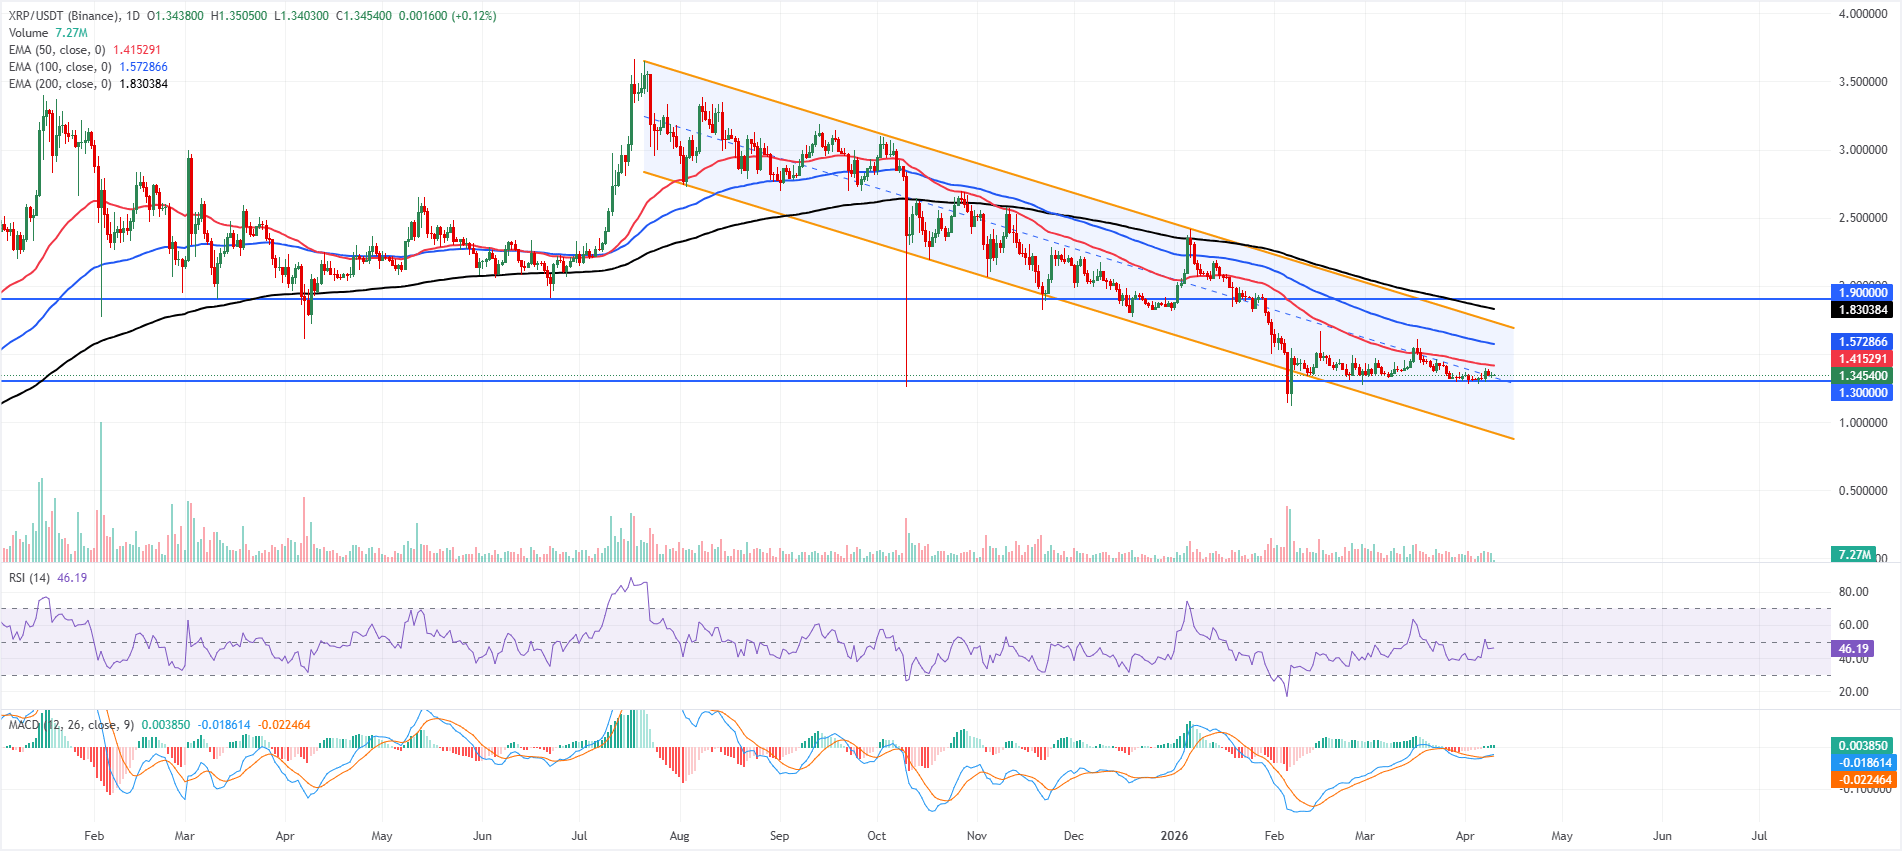
- XRP holds above the $1.30 support, hinting at an upside move on the horizon.
Bitcoin (BTC), Ethereum (ETH) and Ripple (XRP) show signs of strength as they hold above key support levels on Friday, after gaining over 4.5%, 4% and 1.5% so far this week. BTC is testing the upper boundary of its consolidation range, while ETH and XRP continue to find support at critical zones. If these key technical levels hold, a breakout across these top three cryptocurrencies could be on the horizon.
Bitcoin could extend gains if it breaks above the parallel channel top
Bitcoin is trading at $72,200 on Friday, holding a neutral to slightly constructive tone as it sits above the 50-day Exponential Moving Average (EMA) at $70,609 but remains capped within a parallel channel.
The upper boundary of that channel comes in just overhead near $72,600, acting as immediate resistance and keeping bulls constrained below the higher-timeframe 100-day and 200-day EMAs at $75,463 and $83,379, respectively.
Momentum indicators lean supportive, with the Relative Strength Index (RSI) hovering near 59 and a positive, rising Moving Average Convergence Divergence (MACD) histogram suggesting that bullish momentum is improving but not yet strong enough to reverse the higher-timeframe downtrend decisively.
On the downside, initial support is seen at the 50-day EMA around $70,609, where a sustained break would likely expose the lower boundary of the prevailing channel near $65,872 as the next key bearish target.
On the topside, a daily close above the channel ceiling at $72,600 would open the door for a recovery toward the 100-day EMA at $75,463, with the 200-day EMA up at $83,379 standing as a broader trend barrier that would need to be reclaimed to signal a more durable bullish extension.
Ethereum could rally if the key support continues to hold
Ethereum price is trading at $2,195 on Friday, holding a neutral near-term bias as it consolidates above its 50-day EMA at $2,153 but remains well beneath the 100-day EMA at $2,360 and the 200-day EMA at $2,685.
ETH has also broken out above the top of the prevailing parallel channel near $2,148, turning that boundary into nearby support, while the 23.6% Fibonacci retracement of the broader downswing at $2,138 underpins the latest rebound. Momentum is constructive but not extreme, with the RSI on the daily chart around 56, and the MACD indicator holding in positive territory with its line above the signal line and a modestly positive histogram, hinting that bullish pressure is building but still faces structural overhead.
On the downside, initial support is seen at the 50-day EMA at $2,153, followed by the former channel resistance-turned-support around $2,148, with the 23.6% retracement at $2,138 reinforcing this immediate demand zone; a break below there would expose the channel floor near $1,747.
On the topside, immediate resistance aligns first at the 100-day EMA at $2,360, just ahead of the 38.2% Fibonacci retracement at $2,380, while further gains would bring the 50.0% level at $2,575 and the 61.8% retracement at $2,770 into focus, before the denser barrier of the 200-day EMA at $2,685 and the 78.6% retracement up at $3,048, where the broader bearish structure would be more decisively challenged.
XRP holds above key support at $1.30
XRP price is trading at $1.34 on Friday, extending a corrective phase within a broader downward channel. XRP holds below the 50-day, 100-day and 200-day EMAs at $1.41, $1.57 and $1.83, respectively, which keeps the broader bias bearish despite a marginally positive MACD reading and an RSI near 46 that only hints at stabilizing, rather than impulsive demand.
On the topside, immediate resistance emerges at the 50-day EMA around $1.41, with further barriers at the 100-day EMA near $1.57 and the upper boundary of the descending channel around $1.73; above that, the 200-day EMA at $1.83 and a horizontal cap near $1.90 define a thick medium-term ceiling.
On the downside, initial support is seen at the horizontal level of $1.30, ahead of the channel floor near $0.91, where stronger buyers would be expected to defend the longer-term range if selling pressure resumes.
(The technical analysis of this story was written with the help of an AI tool.)
Cryptocurrency prices FAQs
Token launches influence demand and adoption among market participants. Listings on crypto exchanges deepen the liquidity for an asset and add new participants to an asset’s network. This is typically bullish for a digital asset.
A hack is an event in which an attacker captures a large volume of the asset from a DeFi bridge or hot wallet of an exchange or any other crypto platform via exploits, bugs or other methods. The exploiter then transfers these tokens out of the exchange platforms to ultimately sell or swap the assets for other cryptocurrencies or stablecoins. Such events often involve an en masse panic triggering a sell-off in the affected assets.
Macroeconomic events like the US Federal Reserve’s decision on interest rates influence crypto assets mainly through the direct impact they have on the US Dollar. An increase in interest rate typically negatively influences Bitcoin and altcoin prices, and vice versa. If the US Dollar index declines, risk assets and associated leverage for trading gets cheaper, in turn driving crypto prices higher.
Halvings are typically considered bullish events as they slash the block reward in half for miners, constricting the supply of the asset. At consistent demand if the supply reduces, the asset’s price climbs.

超過一百萬用戶依賴 FXStreet 獲取即時市場數據、圖表工具、專家洞見與外匯新聞。其全面的經濟日曆與教育網路研討會協助交易者保持資訊領先、做出審慎決策。FXStreet 擁有約 60 人的團隊,分布於巴塞隆納總部及全球各地。
閱讀更多


