
Top 3 Price Prediction: Bitcoin, Ethereum, Ripple – BTC holds strong at major support, ETH and XRP attempt recovery
作者 Manish Chhetri
更新: 20 May 2026


熱門文章

Bitcoin (BTC), Ethereum (ETH) and Ripple (XRP) trade cautiously on Wednesday, assessing the next directional move following their recent price corrections. BTC consolidates around the key Exponential Moving Averages (EMAs), and ETH stabilizes above horizontal support around $2,067.
- Bitcoin consolidates around key support on Wednesday after its recent correction.
- Ethereum holds above the key support at $2,067, hinting at a possible recovery ahead.
- XRP is heading toward the key support zone after correcting nearly 4% so far this week.
Bitcoin (BTC), Ethereum (ETH) and Ripple (XRP) trade cautiously on Wednesday, assessing the next directional move following their recent price corrections. BTC consolidates around the key Exponential Moving Averages (EMAs), and ETH stabilizes above horizontal support around $2,067. Meanwhile, XRP price action is approaching a critical support zone; if it holds, it supports a recovery in the coming days.
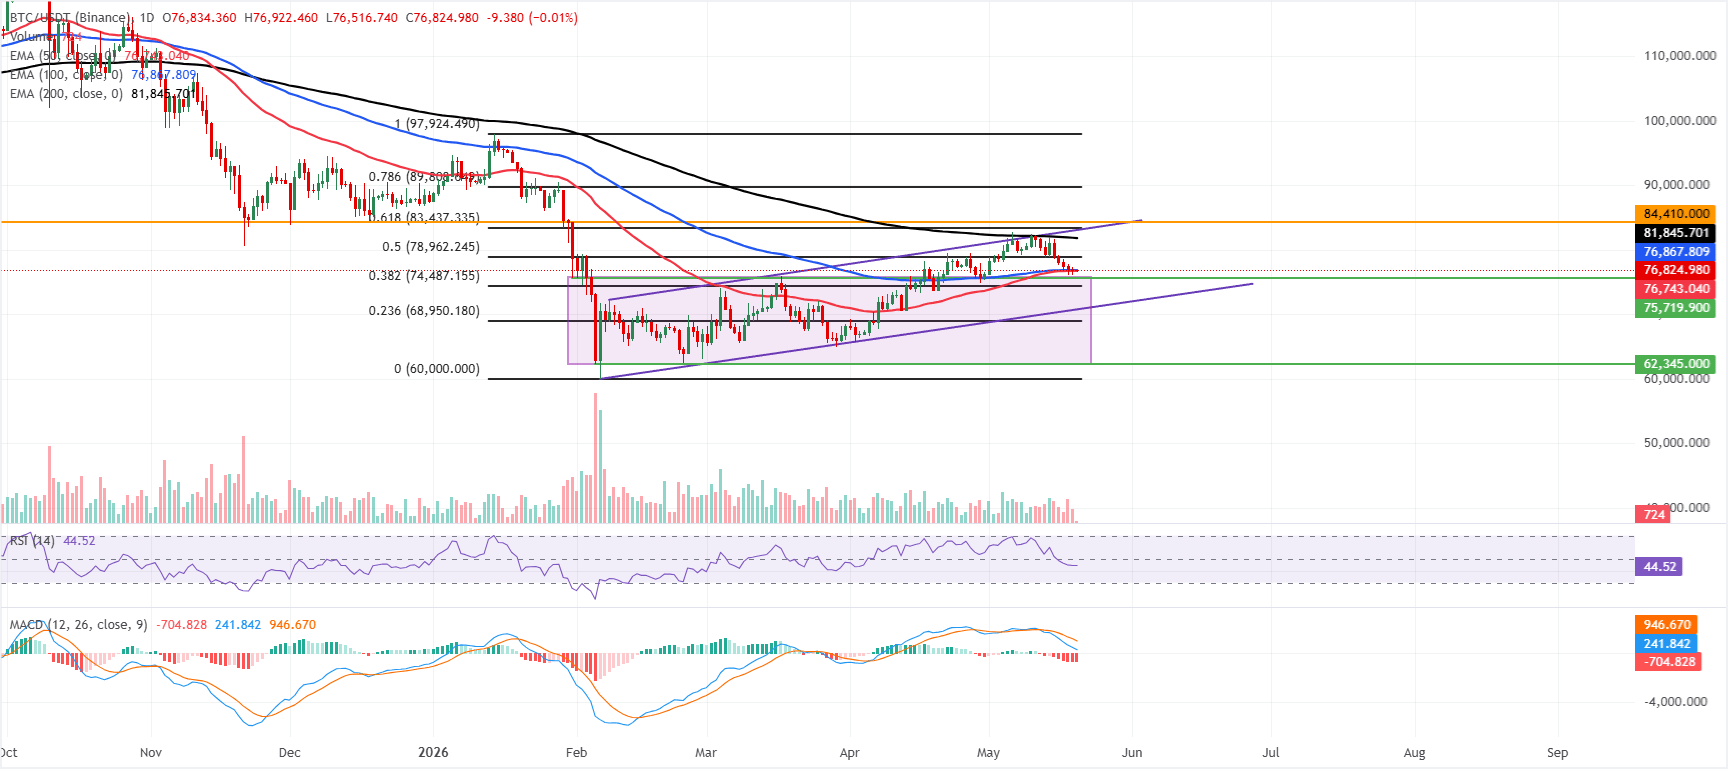
Bitcoin consolidates around the 50-day and 100-day EMAs
Bitcoin price is trading at $76,800 on Wednesday, holding just above the 50-day EMA at $76,743 and the 100-day EMA at $76,867, but still capped by the 200-day EMA at $81,845, which keeps the near-term tone mildly bearish.
The Crypto King trades beneath the longer-term 200-day EMA at $81,845, while the Relative Strength Index (RSI) is slipping toward the mid-40s, and the Moving Average Convergence Divergence (MACD) is deep in negative territory, suggesting fading bullish momentum after the latest push toward the recent highs.
On the topside, immediate resistance emerges at the 50% retracement of the latest rally around $78,962, followed by the 200-day EMA at $81,845, ahead of the 61.8% retracement at $83,437 and the horizontal cap near $84,410.
On the downside, initial support is provided by the 50-day EMA at $76,743, followed by the 38.2% Fibonacci retracement level around $74,487, with deeper protection at the reclaimed trendline area near $70,785 and the 23.6% Fibonacci retracement around $68,950.
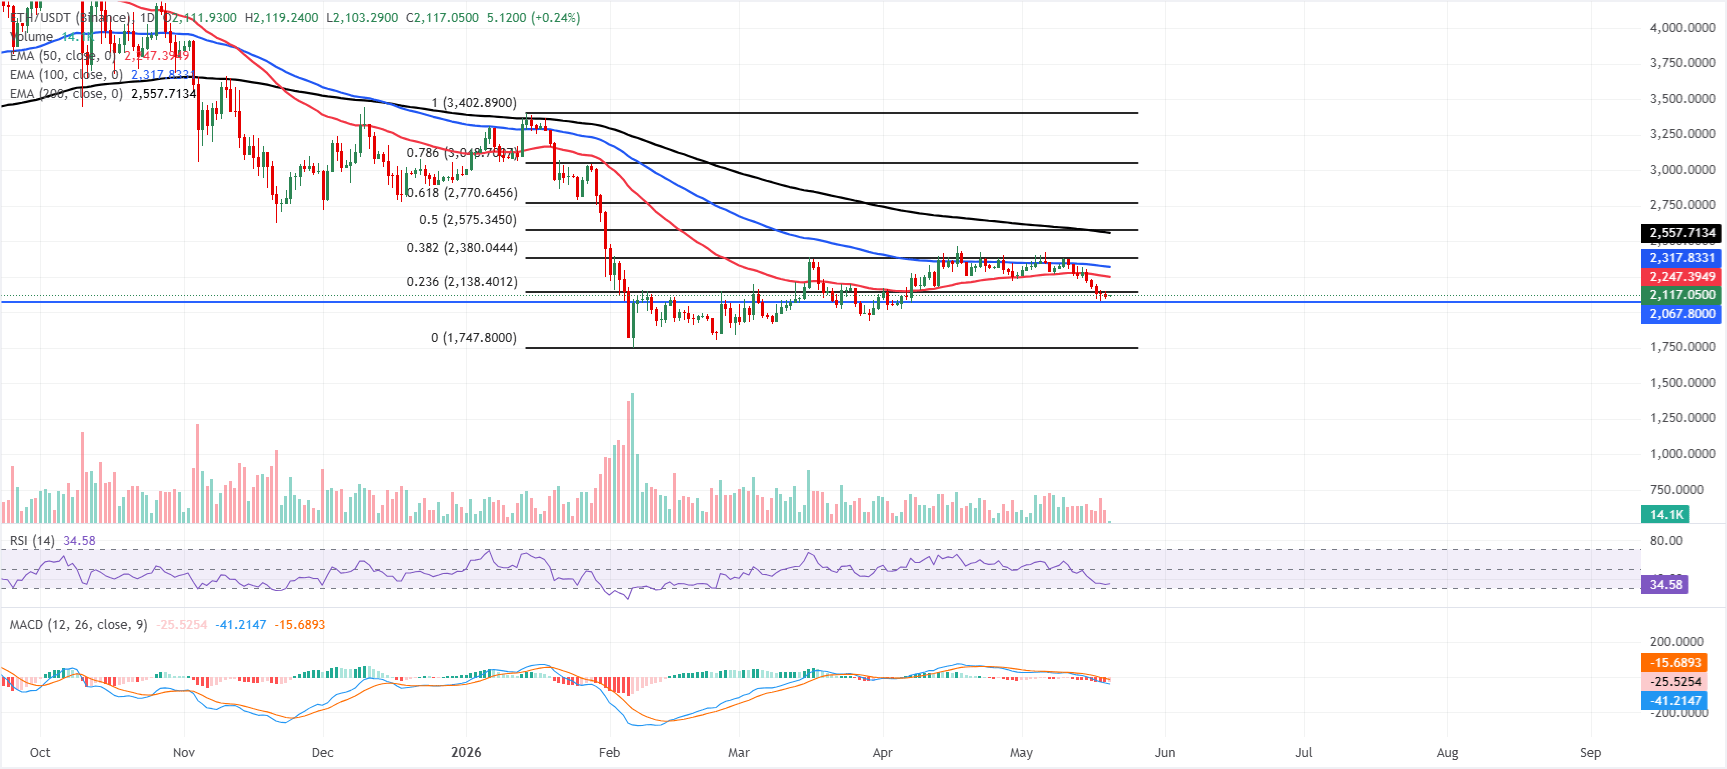
Ethereum finds support around the key $2,067 zone
Ethereum price trades at $2,117, keeping a bearish near-term tone as price holds below the 50-day, 100-day and 200-day EMAs clustered above $2,247, $2,317 and $2,557, respectively. ETH also trades beneath the 23.6% Fibonacci retracement of the latest swing at roughly $2,138, while a soft RSI around 35 and a deeply negative MACD reading hint that downside momentum persists despite already-depressed oscillators.
On the topside, initial resistance emerges at the 23.6% Fibonacci retracement near $2,138, followed by the 50-day EMA around $2,247 and the 100-day EMA close to $2,318; beyond these, the 38.2% Fibonacci retracement near $2,380, the 200-day EMA around $2,557 and the 50% retracement near $2,575 stack additional barriers before the 61.8% level around $2,771.
On the downside, immediate support is seen at the recent horizontal floor around $2,067, where a break would expose further weakness in line with the prevailing bearish structure.
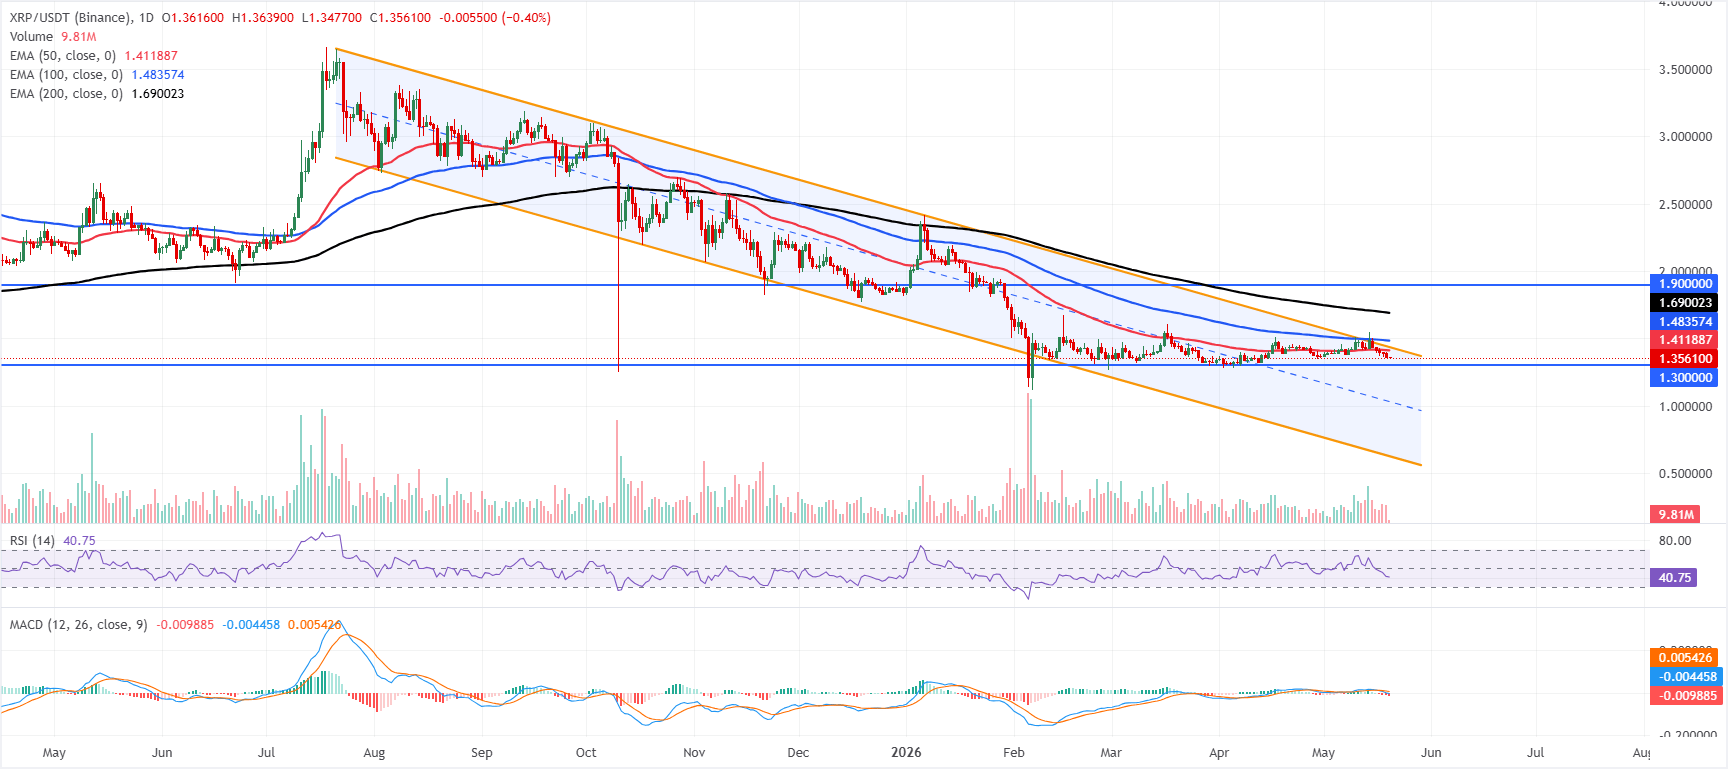
XRP nears critical support zone
XRP trades at $1.356, keeping a bearish near-term tone as it holds below the 50-day, 100-day, and 200-day EMAs at $1.411, $1.483, and $1.690, respectively. XRP also trades under the upper boundary of a downward-sloping parallel channel around $1.435, while the RSI is at about 40 and a negative MACD reading both hint that downside momentum is still dominant despite the recent moderation in trading volumes.
On the topside, initial resistance is seen at the 50-day EMA around $1.411, followed by the channel boundary near $1.435; a break above these would open the way to the 100-day EMA at roughly $1.483 and then the more distant 200-day EMA around $1.690, ahead of a major horizontal barrier at $1.900.
On the downside, the first notable support comes in at the horizontal level near $1.300, where buyers would be expected to step in to defend the broader range if the current bearish pressure extends.
(The technical analysis of this story was written with the help of an AI tool.)
Cryptocurrency prices FAQs
Token launches influence demand and adoption among market participants. Listings on crypto exchanges deepen the liquidity for an asset and add new participants to an asset’s network. This is typically bullish for a digital asset.
A hack is an event in which an attacker captures a large volume of the asset from a DeFi bridge or hot wallet of an exchange or any other crypto platform via exploits, bugs or other methods. The exploiter then transfers these tokens out of the exchange platforms to ultimately sell or swap the assets for other cryptocurrencies or stablecoins. Such events often involve an en masse panic triggering a sell-off in the affected assets.
Macroeconomic events like the US Federal Reserve’s decision on interest rates influence crypto assets mainly through the direct impact they have on the US Dollar. An increase in interest rate typically negatively influences Bitcoin and altcoin prices, and vice versa. If the US Dollar index declines, risk assets and associated leverage for trading gets cheaper, in turn driving crypto prices higher.
Halvings are typically considered bullish events as they slash the block reward in half for miners, constricting the supply of the asset. At consistent demand if the supply reduces, the asset’s price climbs.

超過一百萬用戶依賴 FXStreet 獲取即時市場數據、圖表工具、專家洞見與外匯新聞。其全面的經濟日曆與教育網路研討會協助交易者保持資訊領先、做出審慎決策。FXStreet 擁有約 60 人的團隊,分布於巴塞隆納總部及全球各地。
閱讀更多


