
Top 3 Price Prediction: Bitcoin, Ethereum, Ripple – Institutional outflow risk further losses
作者 Vishal Dixit
更新: 1 Jun 2026


熱門文章

Bitcoin (BTC), Ethereum (ETH), and Ripple (XRP) edge lower under pressure on Monday after a steady decline over the last three weeks. US-Iran ceasefire extension dillydally fuels institutional outflows, adding further downside pressure on the crypto market.
- Bitcoin hovers above $73,500 on Monday as institutional outflows aggravate the downside risk.
- Ethereum fluctuates near the $2,000 psychological level, hanging at a cliff edge.
- XRP trades at $1.33 on Monday, floating above the crucial support zone of $1.27.
Bitcoin (BTC), Ethereum (ETH), and Ripple (XRP) edge lower under pressure on Monday after a steady decline over the last three weeks. US-Iran ceasefire extension dillydally fuels institutional outflows, adding further downside pressure on the crypto market.
Bitcoin hovers above $73,000, risking a revisit to $70,000, while Ethereum stands at the edge of the $2,000 psychological support. Ripple follows suit after a bearish close on Sunday, abruptly ending the three-day recovery run.
Institutional outflows and US-Iran pressure
The delay in the 60-day extension of the US-Iran ceasefire, with the US President Donald Trump negotiating the handover of the enriched uranium, keeps the Strait of Hormuz blocked. Oil prices in the global market remain above $90, with tanker passage blocked, adding risk of heightened inflation.
Institutions rebalance their BTC holdings as Bitcoin takes direct heat after losing its inflation-hedge narrative. Data show that BTC-focused Exchange-Traded Funds (ETFs) recorded $1.42 billion in outflows last week, marking their third consecutive weekly outflow exceeding $1 billion. This rebalancing accounts for the largest monthly outflow of $2.43 billion so far this year, the third-highest ever.
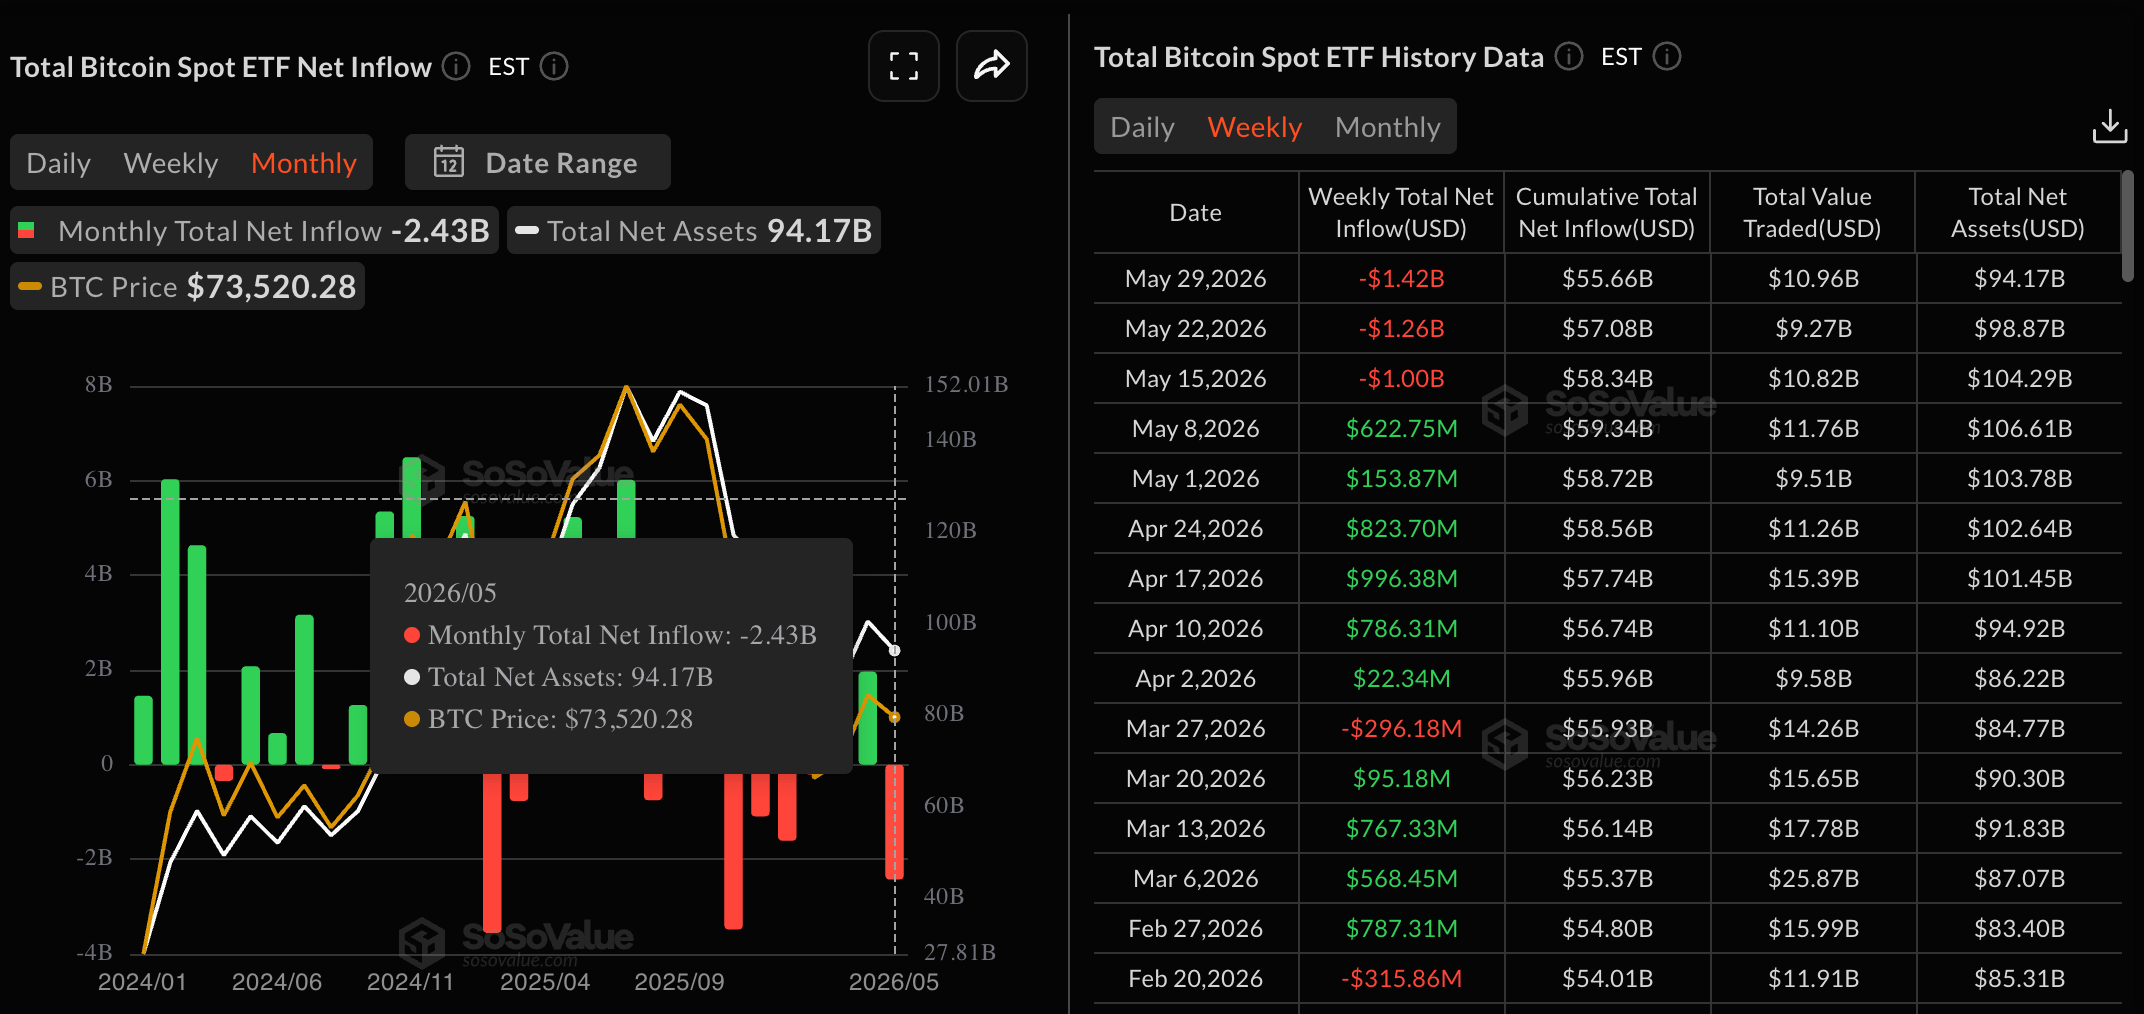
The outflows likely add to the rally in AI stocks and South Korea’s KOSPI, which is driven by chip manufacturing stocks. If the Bitcoin ETFs outflows fail to slowdown, the crypto market could extend its losses this week.
Bitcoin's consolidation flashes downside risk
Bitcoin consolidates below the 50-, 100-, and 200-day Exponential Moving Averages (EMAs) at roughly $76,124, $76,542, and $81,038, respectively, which keeps the broader tone bearish despite the pair stabilizing above recent lows.
The Relative Strength Index (RSI) at 37 on the daily chart hovers above the overbought zone, while the negative Moving Average Convergence Divergence (MACD) remains below the zero line but close to the signal line, suggesting persistent downside momentum with signs of slowing.
A rebound in Bitcoin could face the overhead resistance near the 50- and 100-day EMAs at roughly $76,124 and $76,542, respectively, reinforcing a supply zone.
Looking down, the rising trendline area around $71,547 acts as the first notable support, and a clear break beneath this floor would likely expose lower levels and extend the current corrective phase.
Ethereum hangs tight to the $2,000 mark
Ethereum trades around $2,000 at press time on Monday, keeping a bearish near-term bias as price holds below the reclaimed upward support trend line, now resistance around $2,059, and well under the main 50-, 100-, and 200-day EMAs at $2,173, $2,265, and $2,460, suggesting rallies are likely to face supply.
Momentum remains fragile, with the RSI at 33 hovering just above oversold territory, while the MACD remains negative but close to the signal line, suggesting downside pressure is still dominant even if short-term selling may be losing some intensity.
Ethereum's stronghold at $2,000 would be broken with a daily close below last week's low at $1,967, opening the door to the S1 and S2 Pivot Points at $1,841 and $1,675, respectively.
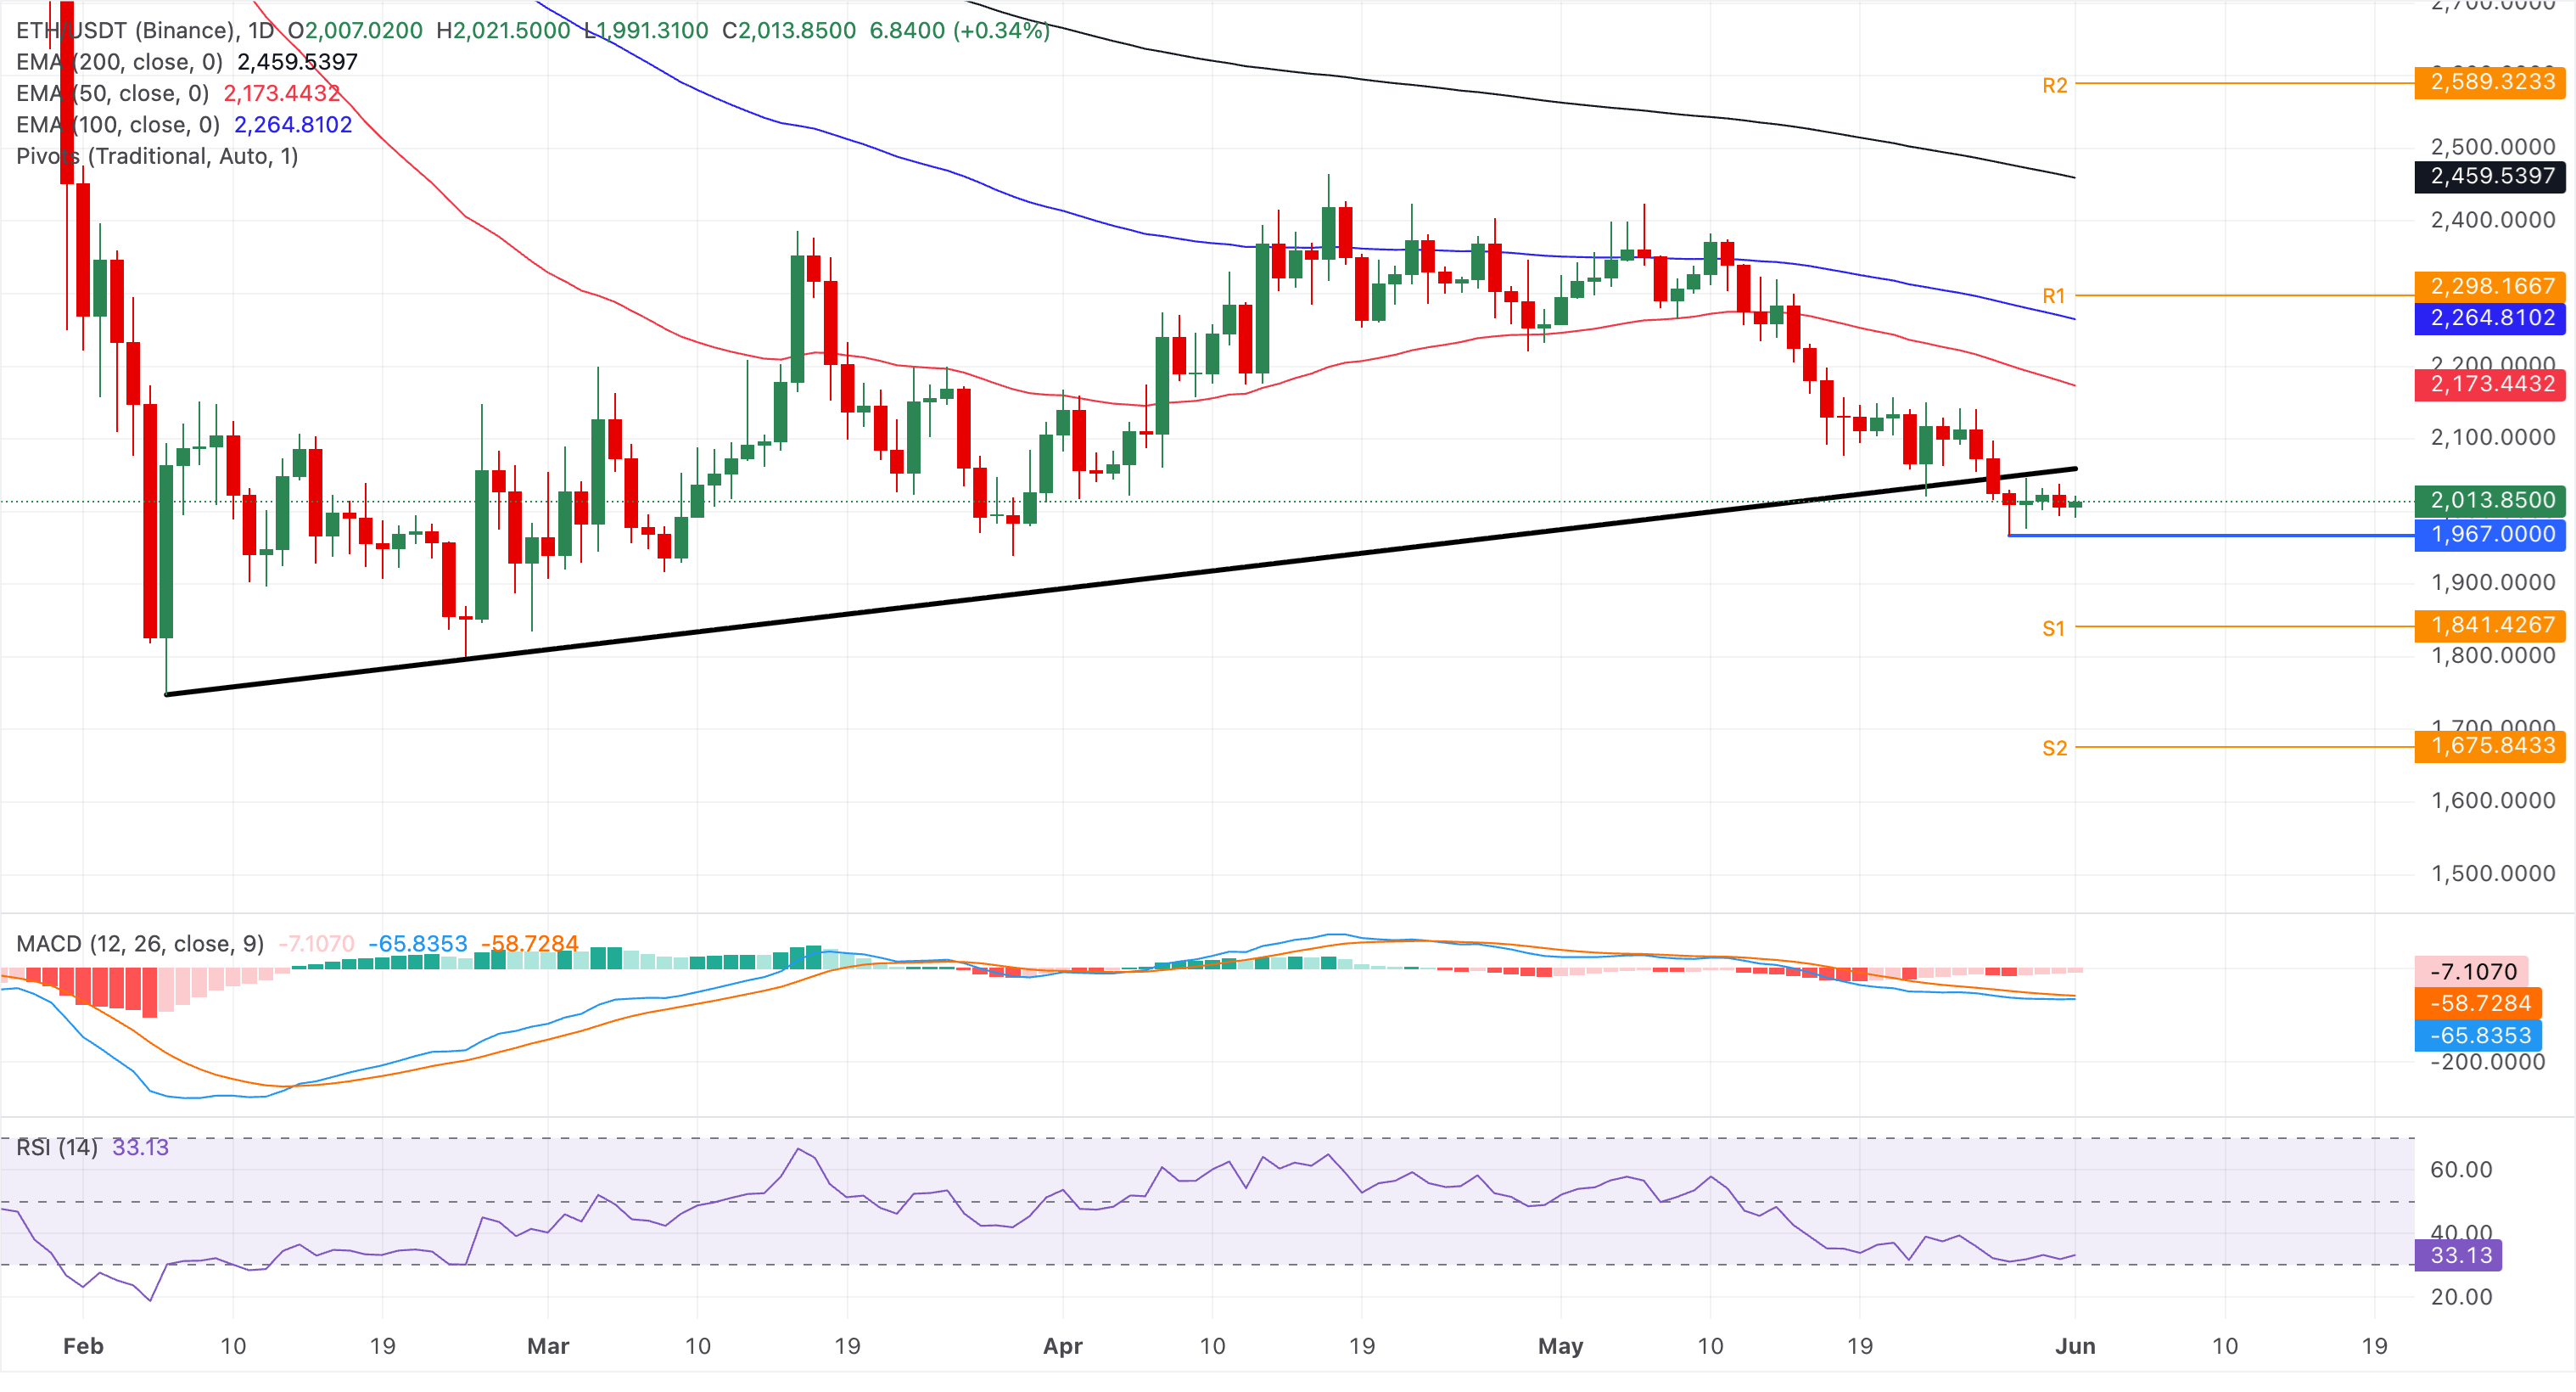
On the flip side, a rebound in ETH could face initial resistance at the broken rising trendline region around $2,059, where a daily close back above would be needed to ease immediate pressure. Above this zone, the 50-day EMA at $2,173 is the next cap, followed by a stronger barrier at the 100-day EMA around $2,265.
XRP is under pressure from downward-moving averages
Ripple trades at $1.3300 at the time of writing on Monday, flashing a similar bearish near-term bias below the 50-day, 100-day, and 200-day EMAs at $1.3834, $1.4547, and $1.6513, respectively. To reinstate a recovery run, XRP must clear the overhead EMAs acting as near-term barriers.
The RSI hovers around 42, indicating weak demand rather than outright oversold conditions, while the MACD remains marginally negative, with its line below the signal and below the zero mark, suggesting that downside momentum is still prevailing but not accelerating.
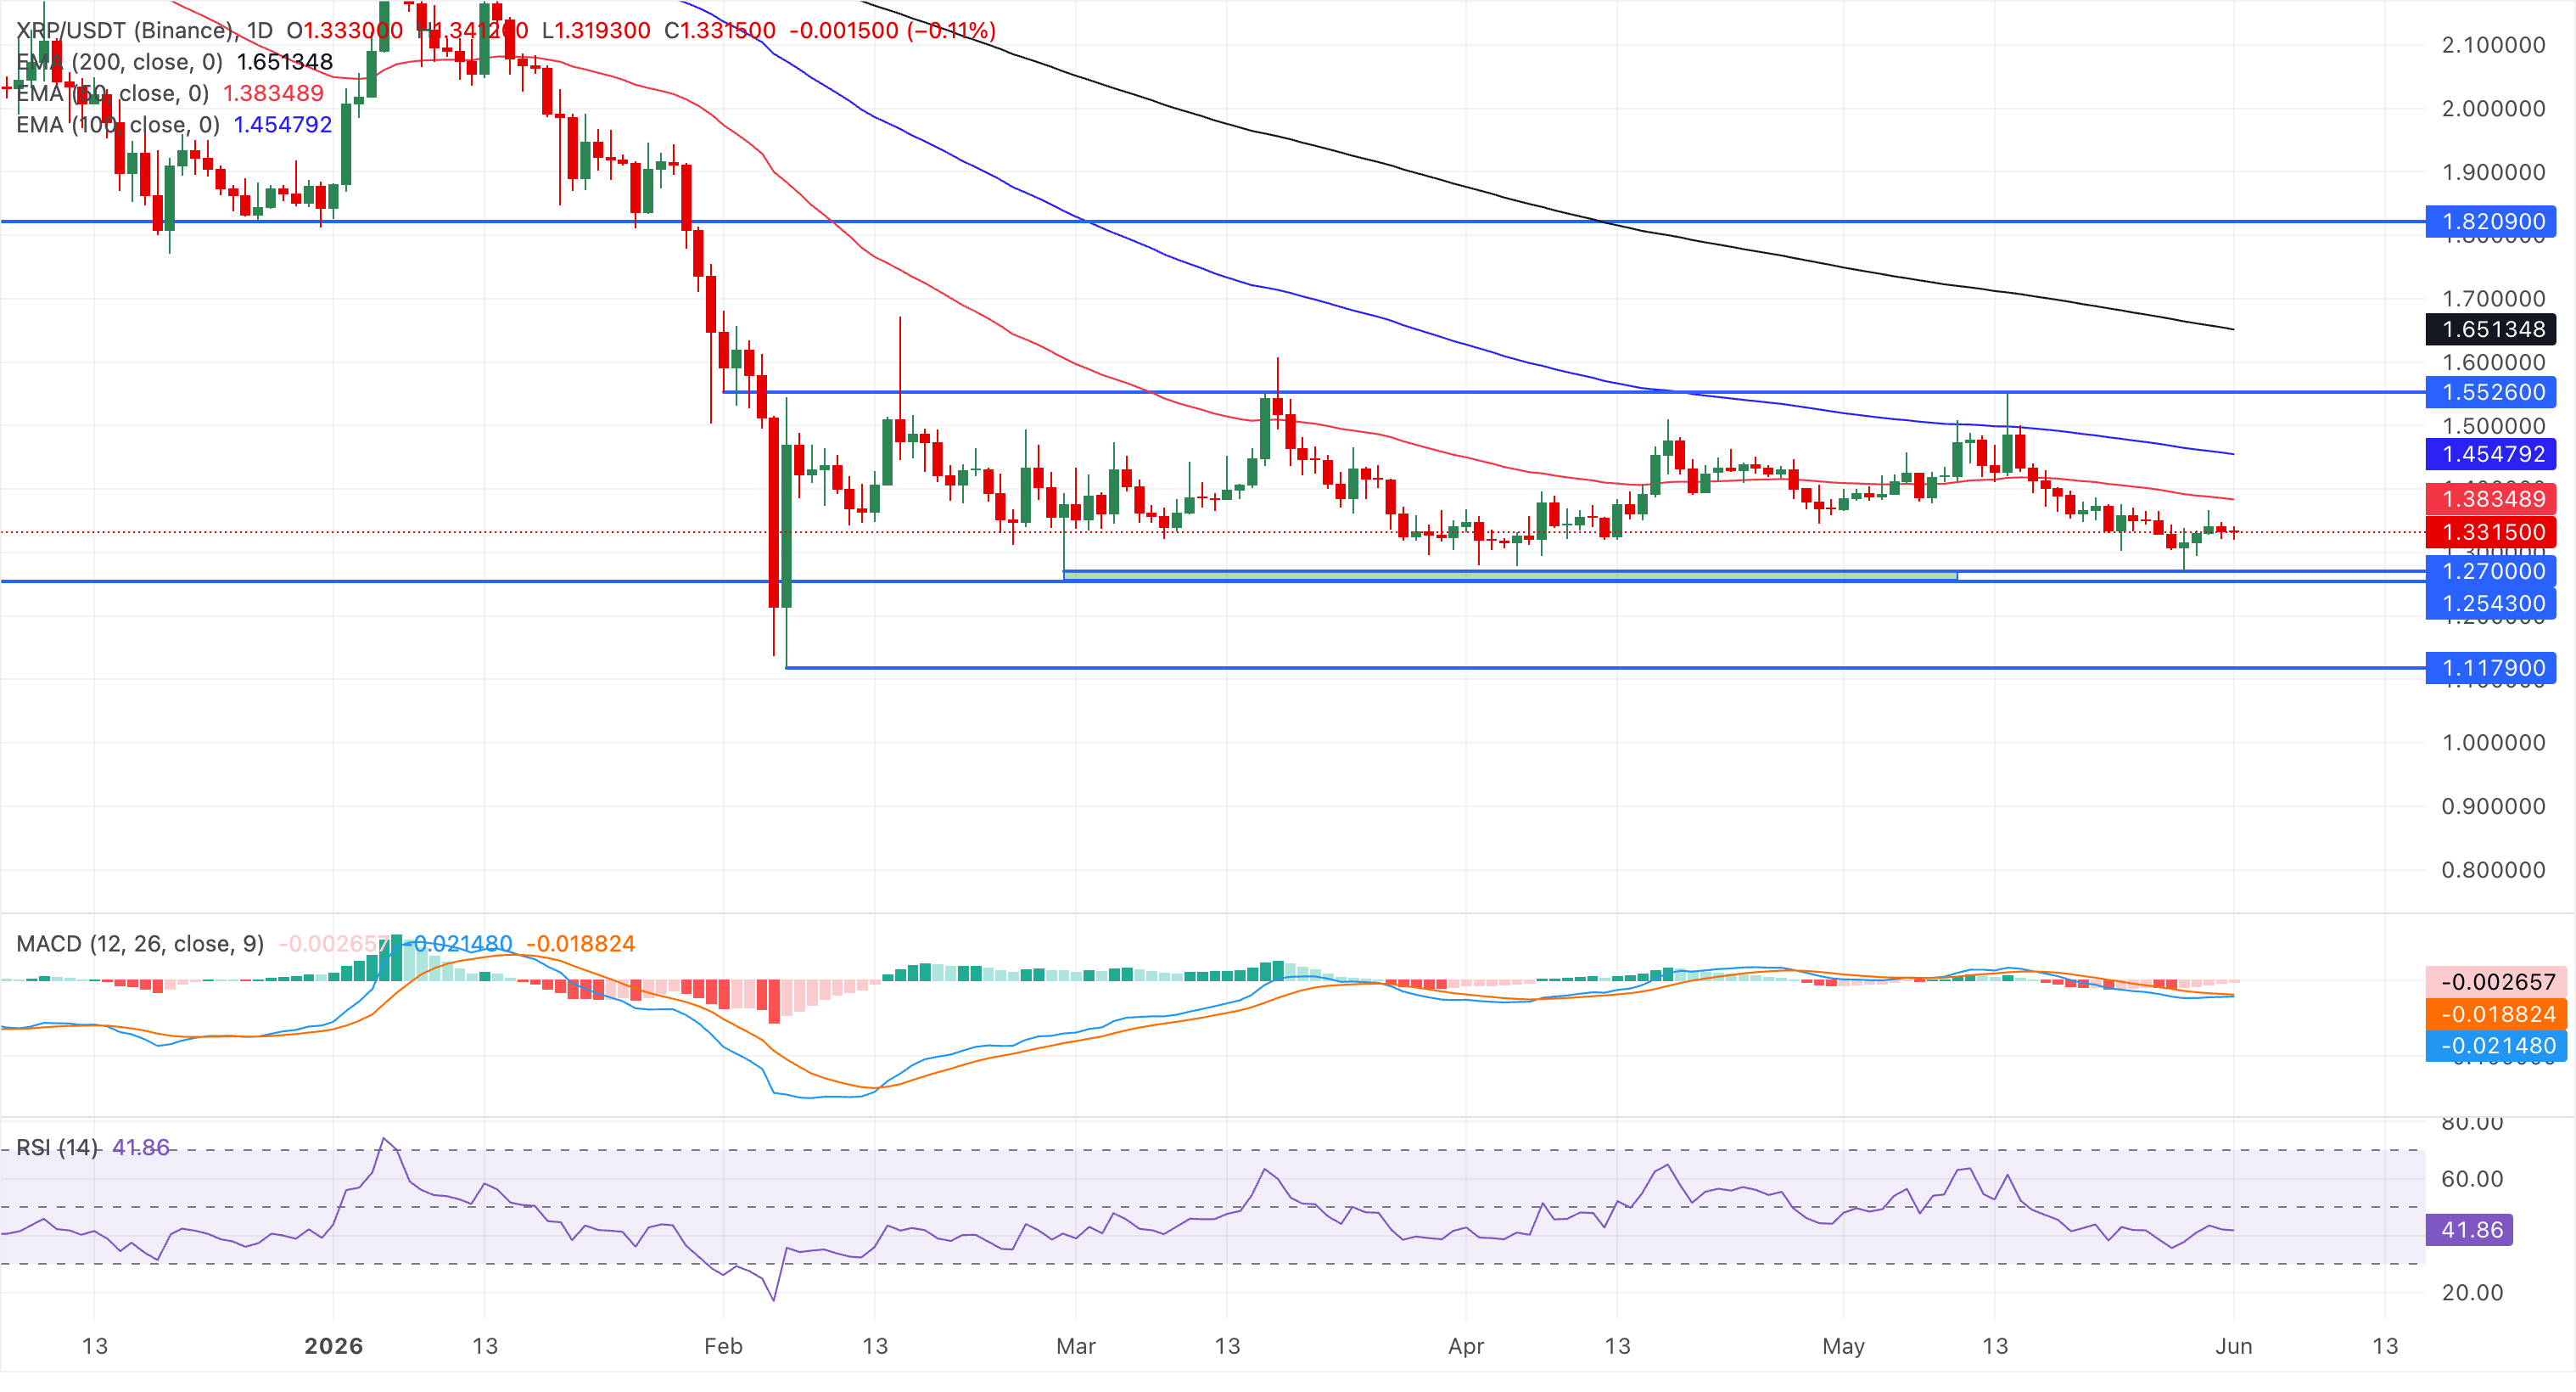
Looking down, the $1.2700-$1.2543 support zone is the immediate level where buyers have consistently regained control over the last two months. A daily close below this zone would threaten the February 6 low at $1.1179.
(The technical analysis of this story was written with the help of an AI tool.)

超過一百萬用戶依賴 FXStreet 獲取即時市場數據、圖表工具、專家洞見與外匯新聞。其全面的經濟日曆與教育網路研討會協助交易者保持資訊領先、做出審慎決策。FXStreet 擁有約 60 人的團隊,分布於巴塞隆納總部及全球各地。
閱讀更多


