
US Dollar Index Price Forecast: Retreats toward two-month lows near 97.50
作者 Akhtar Faruqui
更新: 7 May 2026


熱門文章

The US Dollar Index (DXY), which measures the value of the US Dollar (USD) against six major currencies, is extending its losses for the second successive day, trading around 97.90 during the European hours on Thursday.
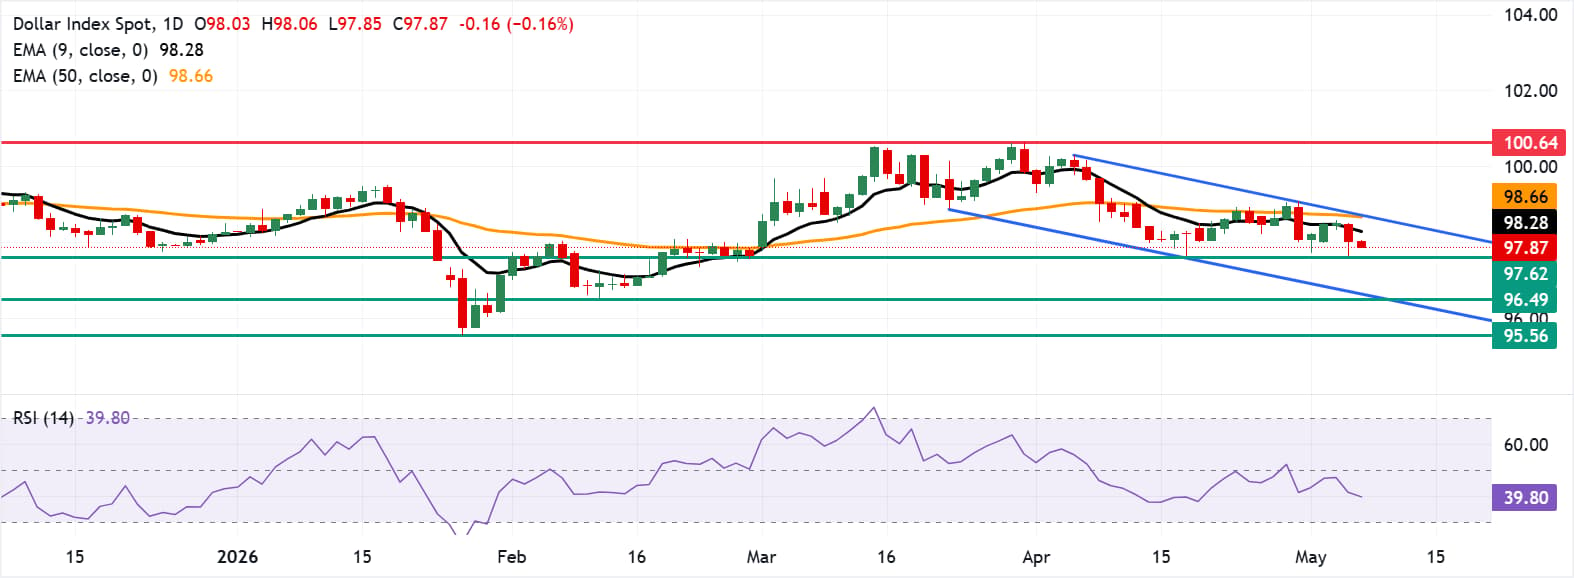
- US Dollar Index may find initial support at the two-month low of 97.62.
- The 14-day Relative Strength Index at 39.71 points toward oversold conditions without signaling extreme market weakness.
- The DXY may rebound toward the nine-day EMA at 98.28.
The US Dollar Index (DXY), which measures the value of the US Dollar (USD) against six major currencies, is extending its losses for the second successive day, trading around 97.90 during the European hours on Thursday. The technical analysis of the daily chart shows that the dollar index is moving sideways within the descending channel, suggesting an ongoing bearish bias.
The US Dollar Index is extending its retreat below both the nine-period and 50-period Exponential Moving Averages (EMAs), which now cap the upside and reinforce a bearish near-term bias.
The 14-day Relative Strength Index (RSI) at 39.71 leans toward oversold territory without extreme readings, suggesting persistent but not yet exhausted downside pressure as sellers retain control beneath the short- and medium-term trend filters.
The DXY may test the two-month low of 97.62, recorded on May 6. The US Dollar Index may further fall toward the lower boundary of the descending channel around 96.70, followed by the three-month low of 96.49. Further declines below the channel would expose the 95.56, the lowest since February 2022, which was reached on January 27.
On the upside, the US Dollar Index may rebound toward the nine-day EMA of 98.28, followed by the 50-day EMA at 98.66, aligned with the upper descending channel boundary around 98.70. A sustained break above this confluence resistance zone would cause the bullish emergence and support the dollar index to approach the 11-month high of 100.64, which was recorded on March 31.
(The technical analysis of this story was written with the help of an AI tool.)
US Dollar Price Today
The table below shows the percentage change of US Dollar (USD) against listed major currencies today. US Dollar was the weakest against the New Zealand Dollar.
| USD | EUR | GBP | JPY | CAD | AUD | NZD | CHF | |
|---|---|---|---|---|---|---|---|---|
| USD | -0.20% | -0.20% | -0.03% | -0.05% | -0.28% | -0.32% | -0.14% | |
| EUR | 0.20% | -0.01% | 0.20% | 0.16% | -0.09% | -0.13% | 0.05% | |
| GBP | 0.20% | 0.00% | 0.19% | 0.15% | -0.09% | -0.12% | 0.06% | |
| JPY | 0.03% | -0.20% | -0.19% | -0.04% | -0.27% | -0.35% | -0.12% | |
| CAD | 0.05% | -0.16% | -0.15% | 0.04% | -0.23% | -0.27% | -0.10% | |
| AUD | 0.28% | 0.09% | 0.09% | 0.27% | 0.23% | -0.03% | 0.14% | |
| NZD | 0.32% | 0.13% | 0.12% | 0.35% | 0.27% | 0.03% | 0.18% | |
| CHF | 0.14% | -0.05% | -0.06% | 0.12% | 0.10% | -0.14% | -0.18% |
The heat map shows percentage changes of major currencies against each other. The base currency is picked from the left column, while the quote currency is picked from the top row. For example, if you pick the US Dollar from the left column and move along the horizontal line to the Japanese Yen, the percentage change displayed in the box will represent USD (base)/JPY (quote).

超過一百萬用戶依賴 FXStreet 獲取即時市場數據、圖表工具、專家洞見與外匯新聞。其全面的經濟日曆與教育網路研討會協助交易者保持資訊領先、做出審慎決策。FXStreet 擁有約 60 人的團隊,分布於巴塞隆納總部及全球各地。
閱讀更多


