
USD/CHF Price Forecast: Hits 11-month high above 0.8100
作者 Christian Borjon Valencia
更新: 24 Jun 2026


熱門文章

The USD/CHF extends its rally for the third straight day this week and refreshes year-to-date (YTD) highs, peaking at 0.8139, which is also an 11-month high. At the time of writing, the pair trades at 0.8124, up 0.34%.
- USD/CHF refreshes YTD highs as rally extends six days.
- RSI enters overbought territory, signaling powerful bullish momentum persists.
- Break above 0.8200 exposes 0.8215 and 0.8300 resistance.
The USD/CHF extends its rally for the third straight day this week and refreshes year-to-date (YTD) highs, peaking at 0.8139, which is also an 11-month high. At the time of writing, the pair trades at 0.8124, up 0.34%.
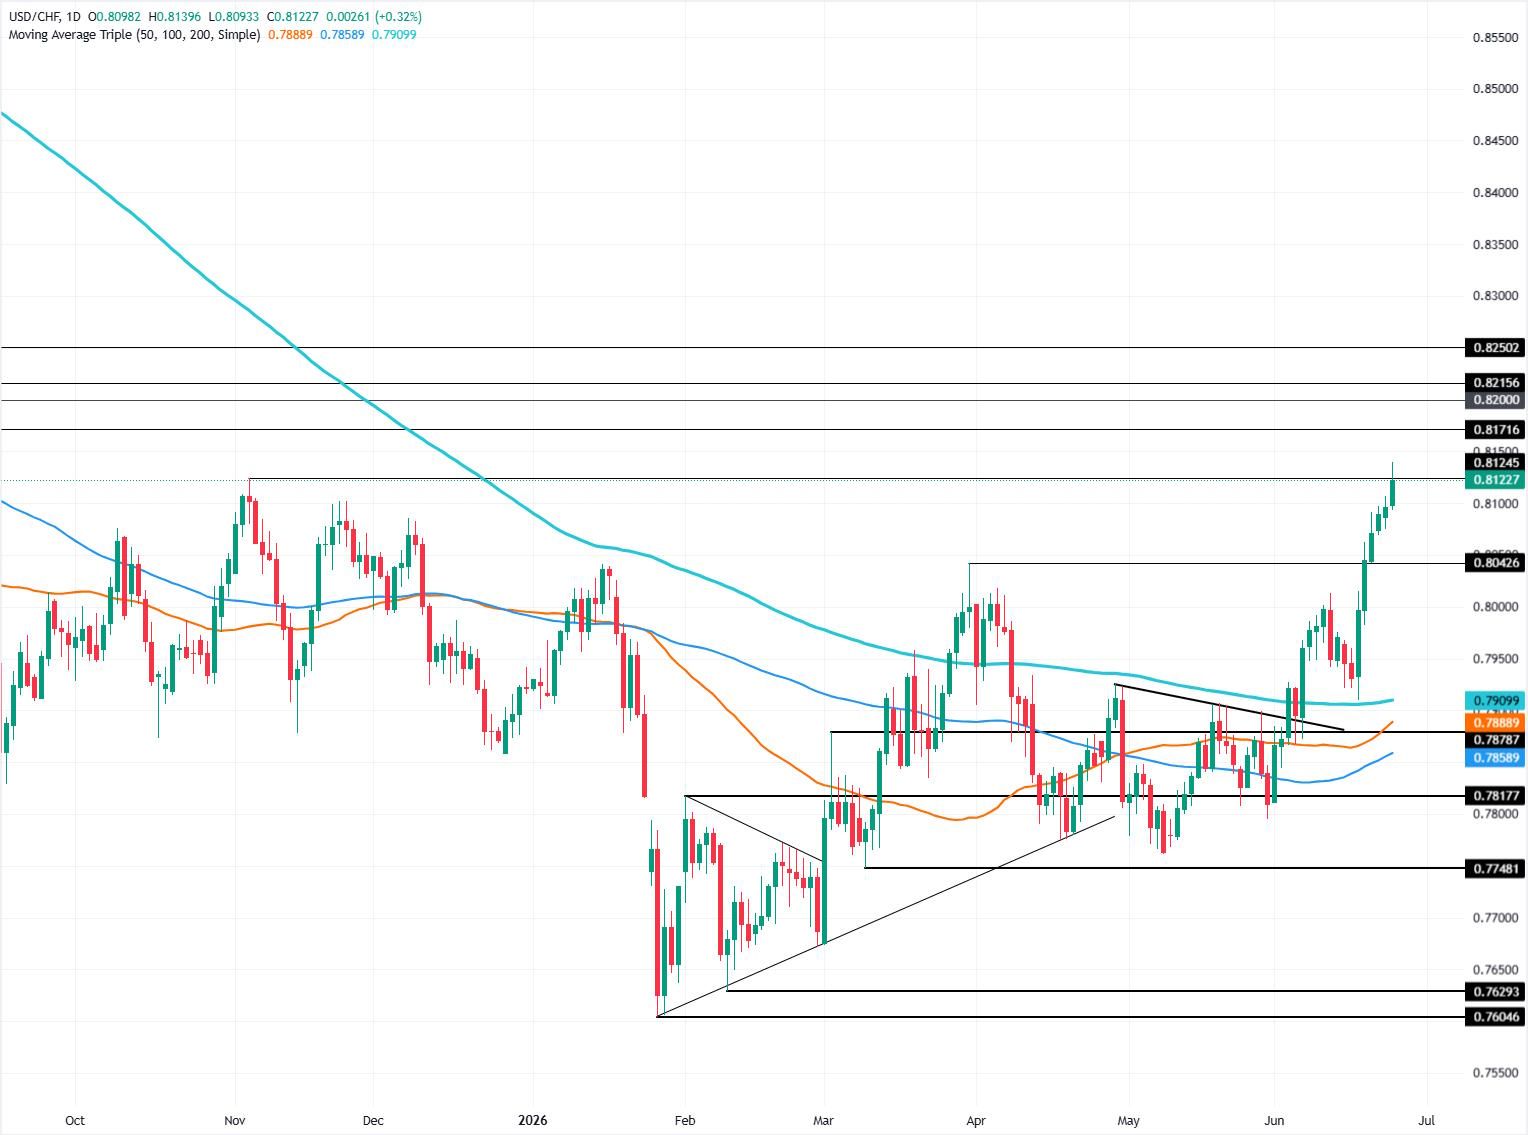
USD/CHF Price Forecast: Technical outlook
The USD/CHF has been rallying for six days, and if it closes Wednesday’s session above 0.8100, bulls could reach the 0.8200 level rather sooner than later.
The Relative Strength Index (RSI) shows the pair is overbought, but it is short of the 80 level, considered the most extreme. When RSI is between 70 and 80, the uptrend is at its strongest; hence, readings above 80 are most precise for indicating market tops.
If USD/CHF clears 0.8200, the next resistance would be the June 19, 2025, daily high at 0.8215, ahead of 0.8250. A breach of the latter will expose 0.8300. On the other hand, if bears drive the pair below 0.8100, the next support would be the March 31 swing high of 0.8042. Below this level is 0.8000.
USD/CHF Price Chart – Daily
Swiss Franc Price This week
The table below shows the percentage change of Swiss Franc (CHF) against listed major currencies this week. Swiss Franc was the strongest against the New Zealand Dollar.
| USD | EUR | GBP | JPY | CAD | AUD | NZD | CHF | |
|---|---|---|---|---|---|---|---|---|
| USD | 0.93% | 0.21% | 0.26% | 0.47% | 1.58% | 1.69% | 0.60% | |
| EUR | -0.93% | -0.73% | -0.61% | -0.41% | 0.69% | 0.77% | -0.32% | |
| GBP | -0.21% | 0.73% | -0.13% | 0.26% | 1.38% | 1.36% | 0.38% | |
| JPY | -0.26% | 0.61% | 0.13% | 0.13% | 1.29% | 1.27% | 0.28% | |
| CAD | -0.47% | 0.41% | -0.26% | -0.13% | 1.16% | 1.20% | 0.11% | |
| AUD | -1.58% | -0.69% | -1.38% | -1.29% | -1.16% | -0.03% | -0.94% | |
| NZD | -1.69% | -0.77% | -1.36% | -1.27% | -1.20% | 0.03% | -0.94% | |
| CHF | -0.60% | 0.32% | -0.38% | -0.28% | -0.11% | 0.94% | 0.94% |
The heat map shows percentage changes of major currencies against each other. The base currency is picked from the left column, while the quote currency is picked from the top row. For example, if you pick the Swiss Franc from the left column and move along the horizontal line to the US Dollar, the percentage change displayed in the box will represent CHF (base)/USD (quote).

超過一百萬用戶依賴 FXStreet 獲取即時市場數據、圖表工具、專家洞見與外匯新聞。其全面的經濟日曆與教育網路研討會協助交易者保持資訊領先、做出審慎決策。FXStreet 擁有約 60 人的團隊,分布於巴塞隆納總部及全球各地。
閱讀更多


