
USD/CHF Price Forecast: Upside momentum fades after rejection at 0.8000
作者 Vishal Chaturvedi
更新: 16 Jun 2026


熱門文章

USD/CHF extends losses for a second consecutive day on Tuesday as easing tensions between the United States (US) and Iran weigh on demand for the safe-haven US Dollar (USD). At the time of writing, the pair trades around 0.7921, down 0.30% on the day.
- USD/CHF extends losses as easing US-Iran tensions weigh on the US Dollar.
- Markets turn their attention to the Fed's monetary policy announcement on Wednesday.
- Technically, USD/CHF's outlook turns neutral to bearish after failing to clear 0.8000.
USD/CHF extends losses for a second consecutive day on Tuesday as easing tensions between the United States (US) and Iran weigh on demand for the safe-haven US Dollar (USD). At the time of writing, the pair trades around 0.7921, down 0.30% on the day.
Despite improving market sentiment, traders remain cautious ahead of the formal signing of the agreement on Friday. Iran's Foreign Minister Abbas Araghchi warned that any Israeli attack on Lebanon or continued occupation of its territory would violate the interim agreement with the US.
The lingering uncertainty could limit downside in the US Dollar, in turn capping gains in the Swiss Franc (CHF). The US Dollar Index (DXY), which tracks the Greenback's value against a basket of six major currencies, is trading around 99.50.
Traders are also adopting a wait-and-see approach ahead of the Federal Reserve's (Fed) monetary policy announcement on Wednesday. The war-driven surge in Oil prices has complicated the inflation outlook, putting the Fed's inflation mandate at risk.
While markets have fully priced in no change in interest rates at the upcoming meeting, the focus will be on forward guidance for the months ahead and how policymakers assess the recent rise in inflation.
FXStreet's SpeechTracker average scores show that six of the eleven voting FOMC members are clearly hawkish, with most of the remaining members also leaning hawkish. The analysis does not include the newly appointed Fed Chair, Kevin Warsh.
Though the recent pullback in Oil prices has helped ease inflation concerns, reducing pressure on the central bank to raise interest rates.
Technical Analysis:
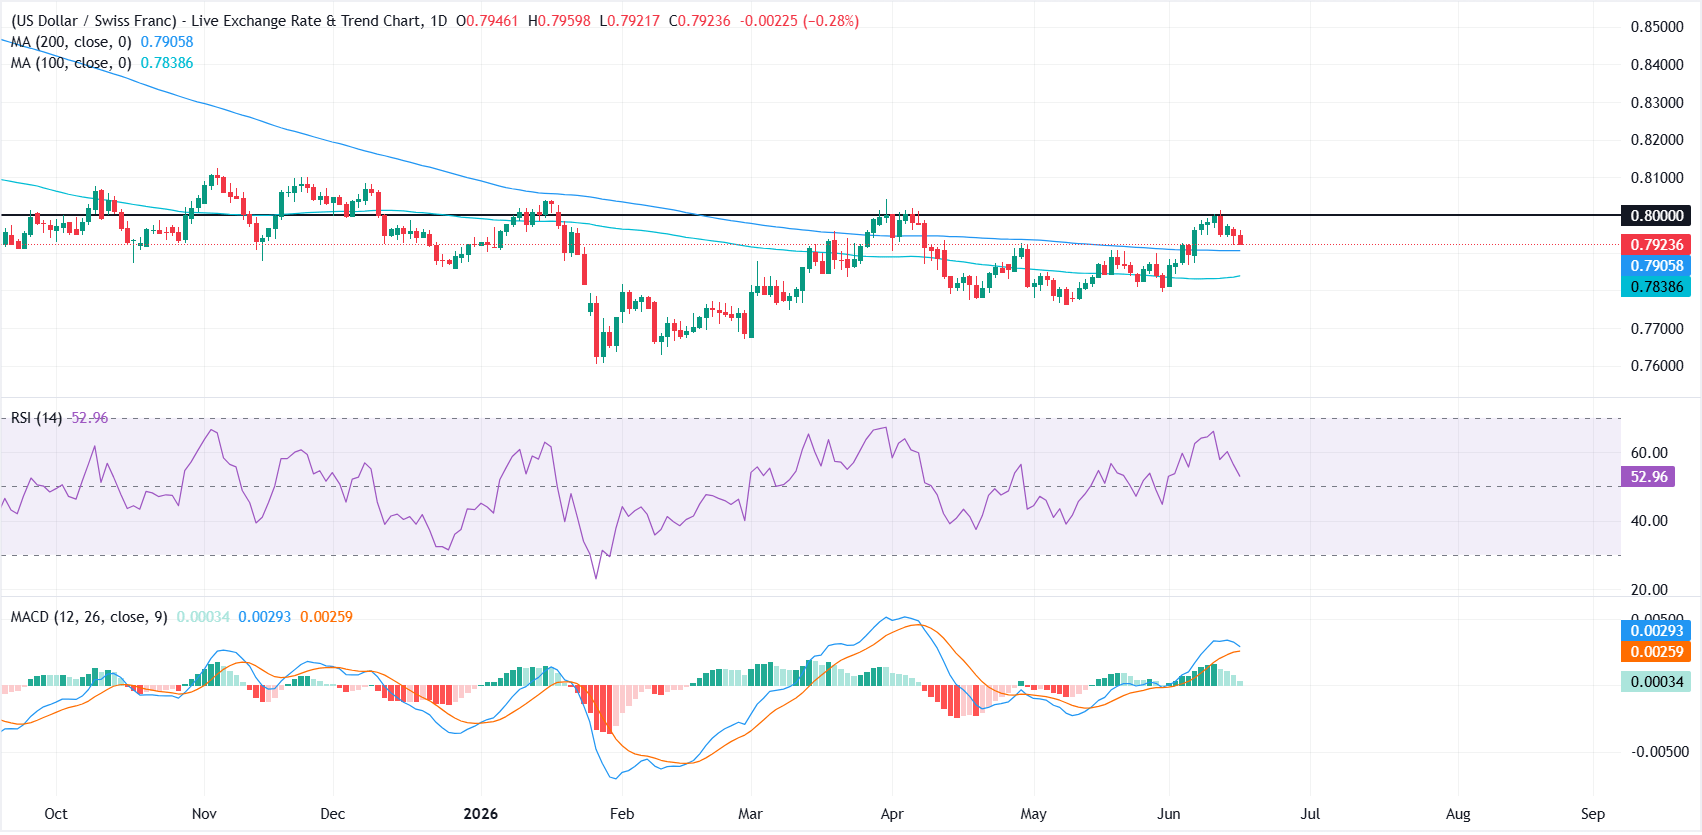
In the daily chart, USD/CHF's technical outlook has turned neutral to bearish after buyers failed to extend gains above the 0.8000 psychological barrier, pushing prices back toward key moving-average support.
On the downside, initial support is seen at the 200-day Simple Moving Average (SMA) at 0.7906, with a deeper floor at the 100-day SMA near 0.7839. A clear break below the latter would open the door to a broader correction.
The Relative Strength Index (RSI) has eased to around 53, indicating that bullish momentum has moderated. Meanwhile, the Moving Average Convergence Divergence (MACD) remains in positive territory, but the fading green histogram suggests upside pressure is gradually losing strength.
On the topside, the 0.8000 mark remains the key resistance level, with a sustained move above it needed to revive bullish momentum.
(The technical analysis of this story was written with the help of an AI tool.)

超過一百萬用戶依賴 FXStreet 獲取即時市場數據、圖表工具、專家洞見與外匯新聞。其全面的經濟日曆與教育網路研討會協助交易者保持資訊領先、做出審慎決策。FXStreet 擁有約 60 人的團隊,分布於巴塞隆納總部及全球各地。
閱讀更多


