
Zcash and Monero Outlook: Privacy coins hold steady as breakout momentum builds
作者 John Isige
更新: 19 May 2026


熱門文章

The cryptocurrency market is broadly facing headwinds on Tuesday as geopolitical tensions in the Middle East over the US-Iran conflict escalate, driving Oil prices above $103 for West Texas Intermediate (WTI).
- Zcash remains above the $550 support on Tuesday despite weak momentum indicators weighing on sentiment.
- Monero rises, eyeing a breakout above $400, building on support provided by the 50-day and 100-day EMAs.
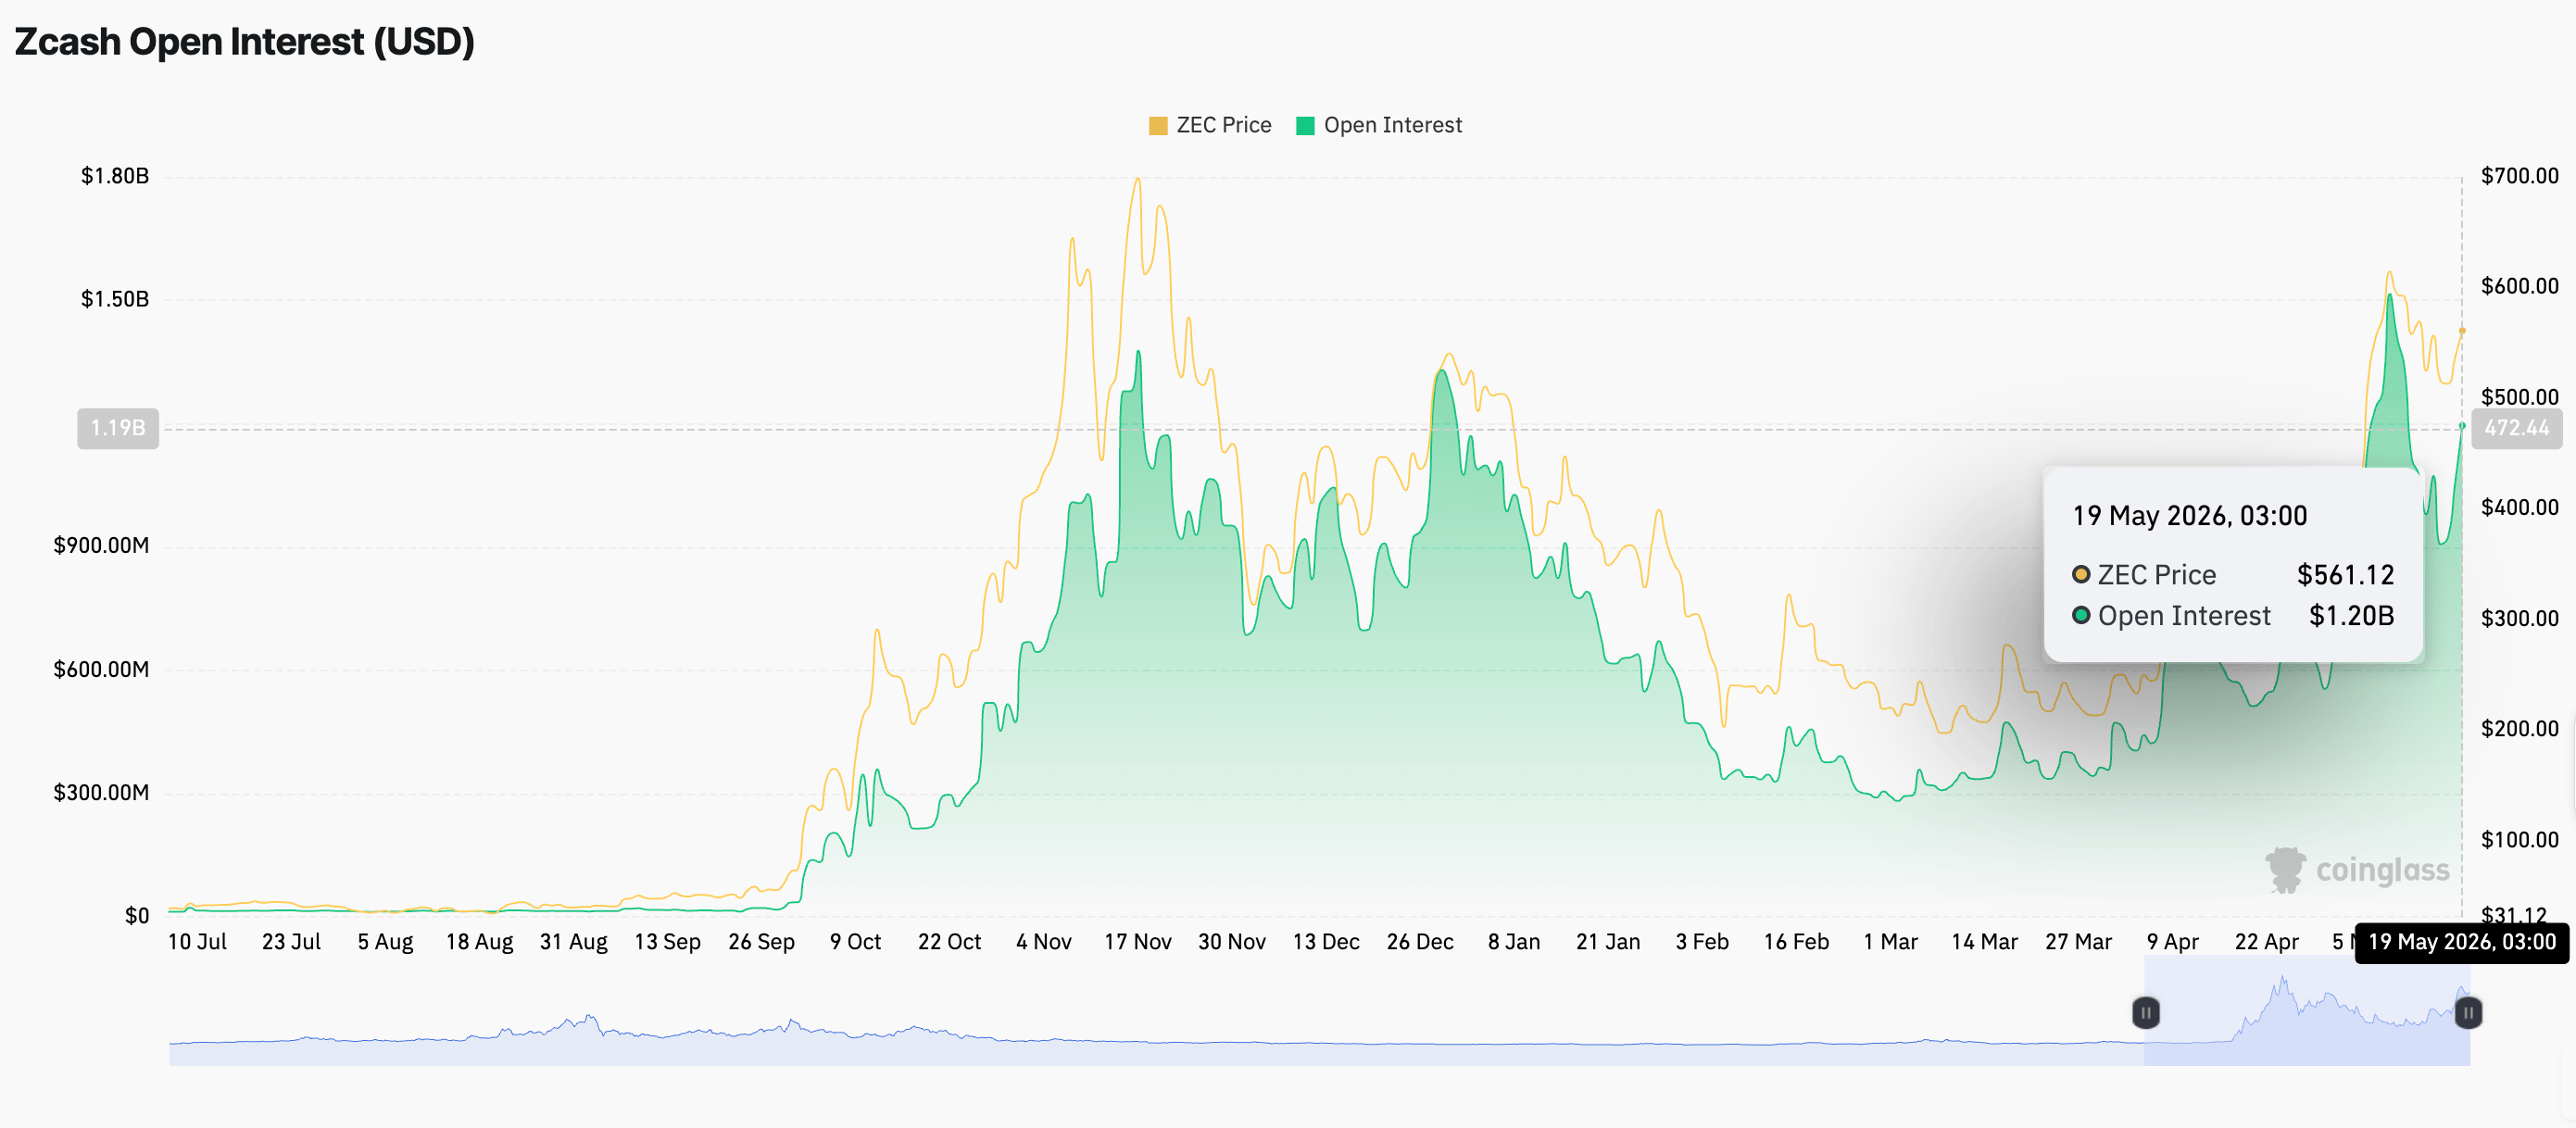
- Zcash sees a spike in retail demand with Open Interest surging to $1.20 billion.
The cryptocurrency market is broadly facing headwinds on Tuesday as geopolitical tensions in the Middle East over the US-Iran conflict escalate, driving Oil prices above $103 for West Texas Intermediate (WTI). Meanwhile, select crypto assets, including the privacy-focused Zcash (ZEC) and Monero (XLM), show notable resilience despite the pressure, with ZEC trading above $550 and XLM eyeing a short-term break above $400.
Retail backs Zcash and Monero’s recovery outlook
Zcash is experiencing a steady return of retail investors, as derivatives gain momentum. The perpetual futures Open Interest (OI) has sharply increased to $1.2 billion on Tuesday, from $1.06 billion the previous day, underscoring growing appetite for ZEC.
The surge comes on the backdrop of a decline in OI to $906 million on Saturday, from the record high of $1.5 billion on May 9. A steady increase in OI suggests that investors are confident the privacy coin can sustain an uptrend in the short to medium-term.
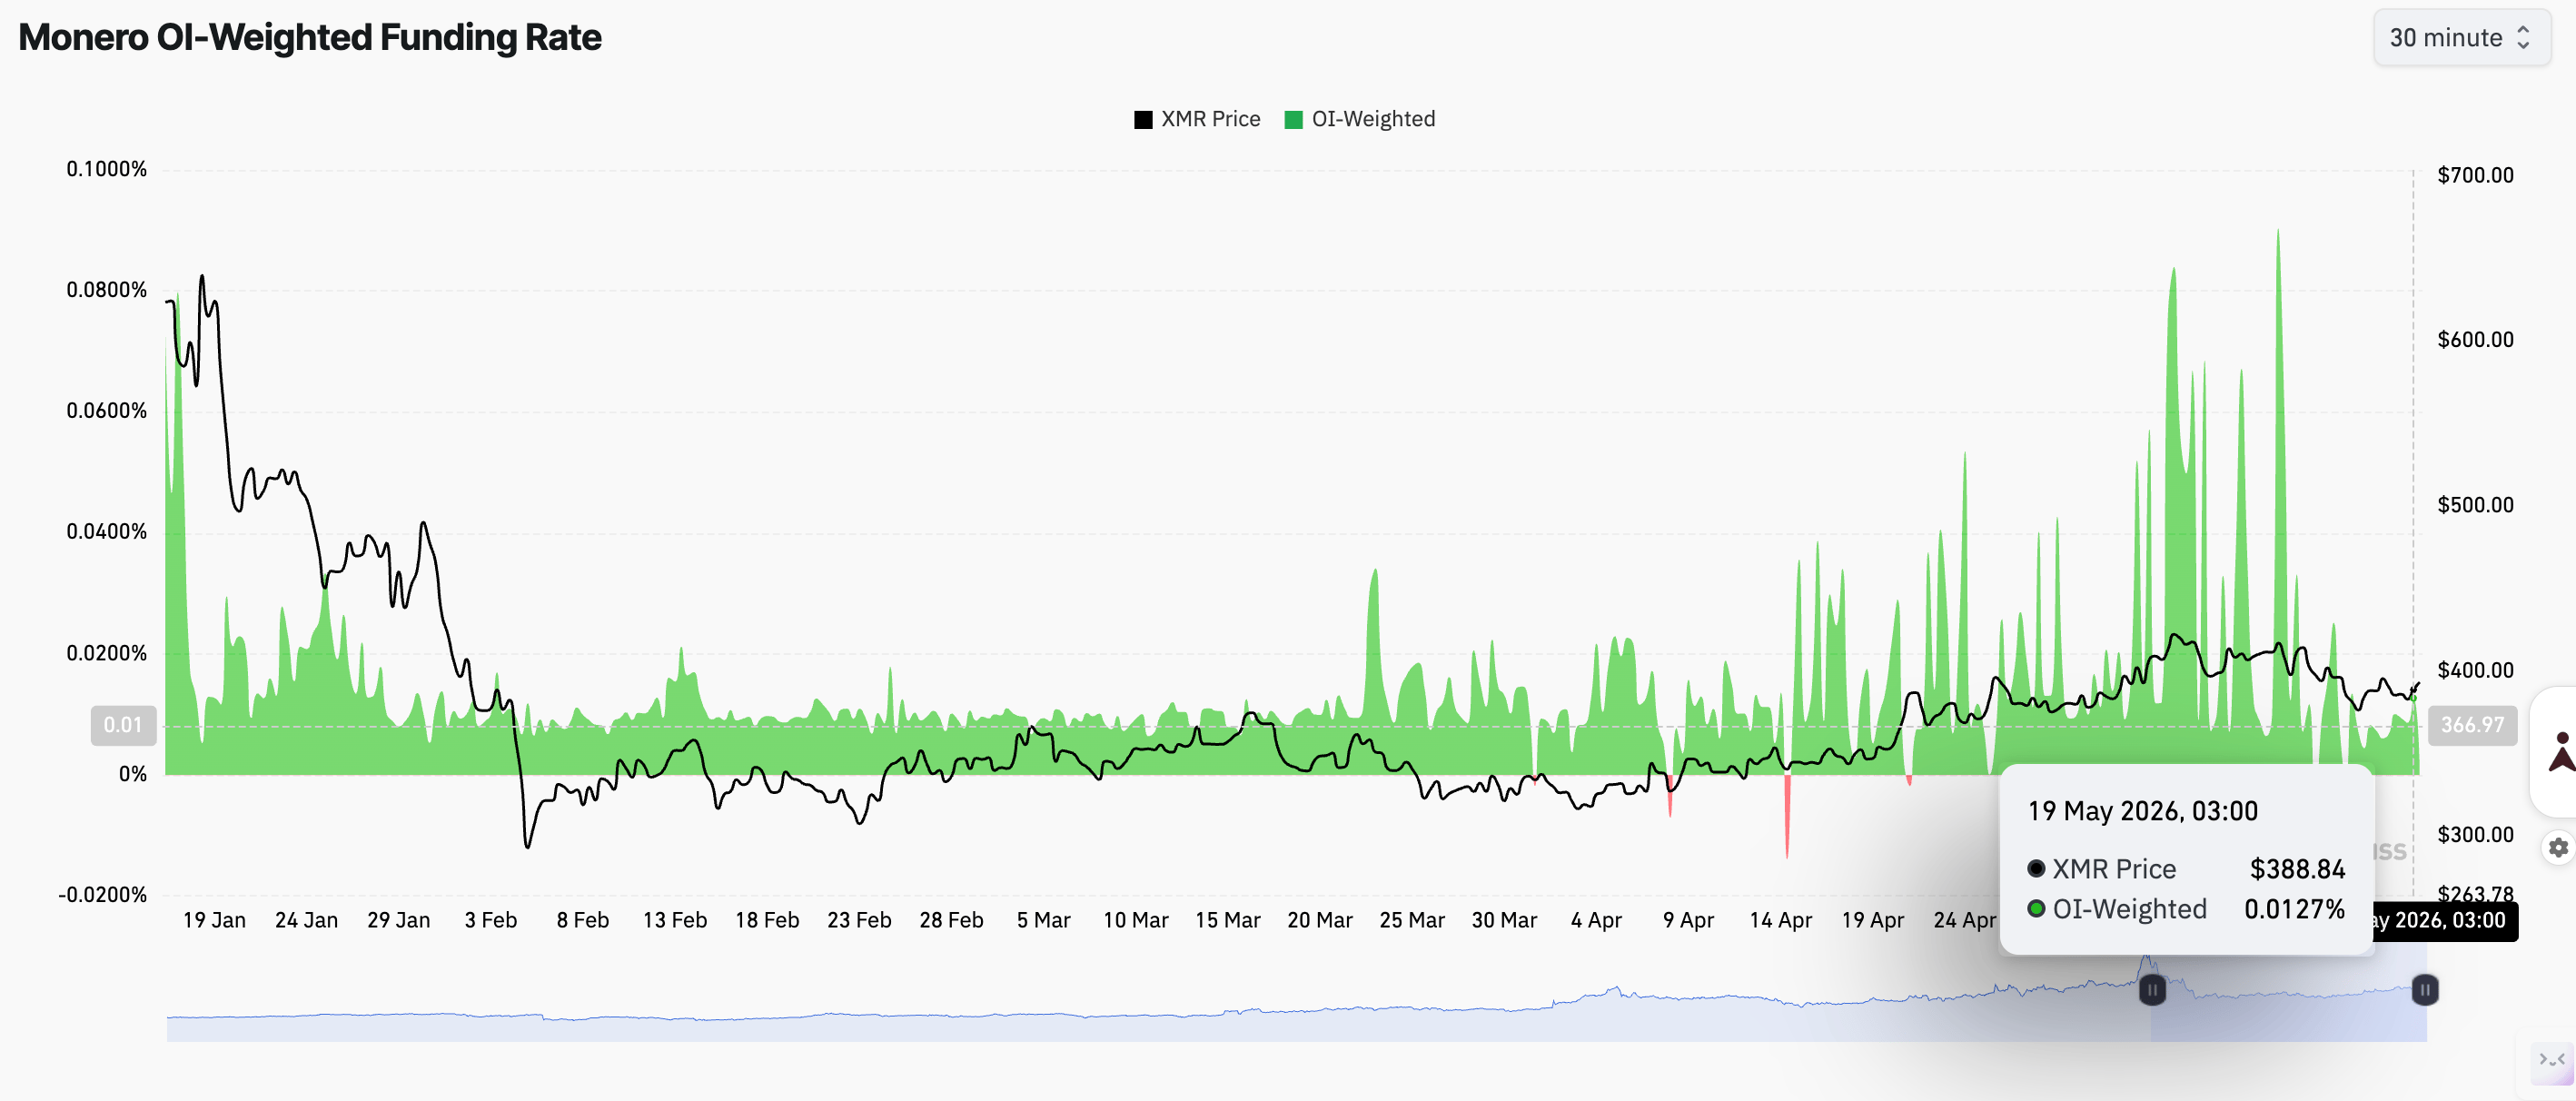
Traders appear to be piling more into long positions in Monero, as the OI-Weighted Funding Rate remains in positive territory at 0.0016%. This metric has largely been positive since May, signaling that traders are fairly confident prices will keep rising in the near term.
Price analysis: Monero tests recovery strength
Monero trades at $392, maintaining a constructive near-term bias as price remains clearly above the 50-, 100-, and 200-day Exponential Moving Averages (EMAs), clustered between roughly $371 and $380, which reinforces the broader uptrend despite the recent pullback from the $410–$415 area.
Momentum, however, has cooled as the Relative Strength Index (RSI) sits near a neutral 52 on the daily chart, the Money Flow Index (MFI) has retreated toward 41, and the Moving Average Convergence Divergence (MACD) histogram remains in negative territory, hinting that upside follow-through could be limited even though the underlying structure stays supported.
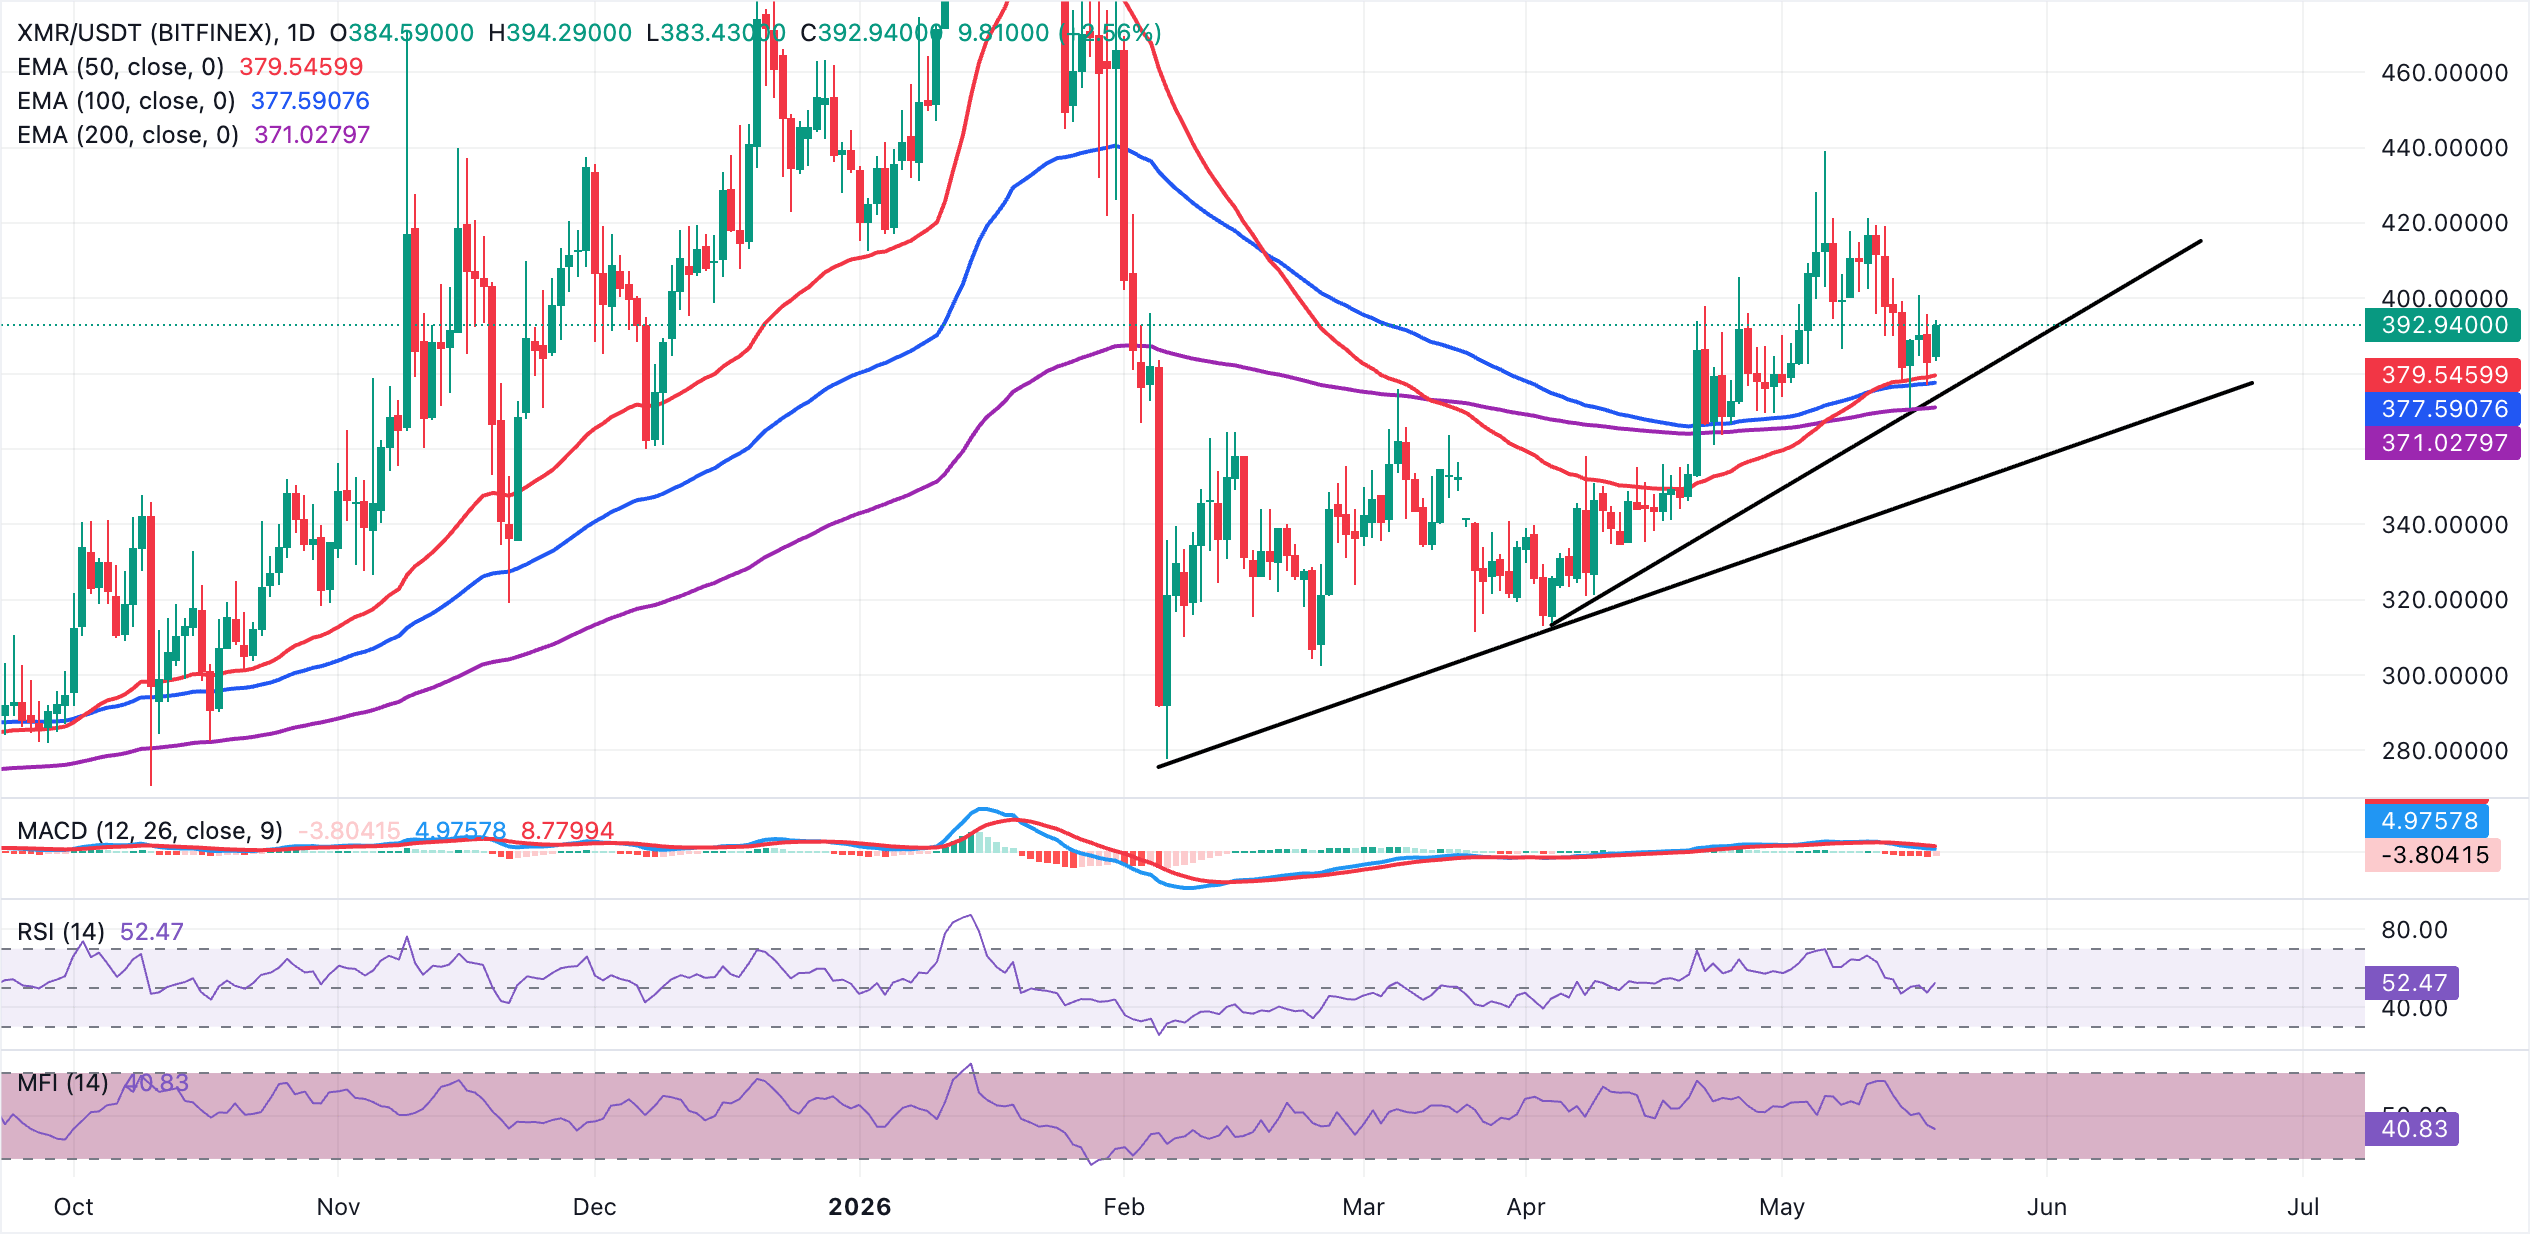
On the downside, initial support is seen at the 50-day EMA around $380, followed closely by the 100-day EMA near $378 and the more recent rising trendline region around $374. A deeper slide would expose the 200-day EMA at approximately $371, with the earlier uptrend support zone near $351 coming into view only if sellers regain control. On the upside, the pivotal $400 level is the next resistance, which should be reclaimed to pave the way for an extended bullish breakout toward $440.
Technical outlook: Zcash seeks short-term support
Zcash trades at $555, holding well above the 50-day, 100-day, and 200-day EMAs, which are clustered between roughly $329 and $426, keeping the broader trend biased to the upside despite the latest pullback from recent highs. The RSI eases from overbought territory but remains in the low 60s on the daily chart, suggesting bullish momentum is moderating rather than reversing, while the MACD histogram has slipped back into negative territory, hinting at waning upside pressure in the near term.
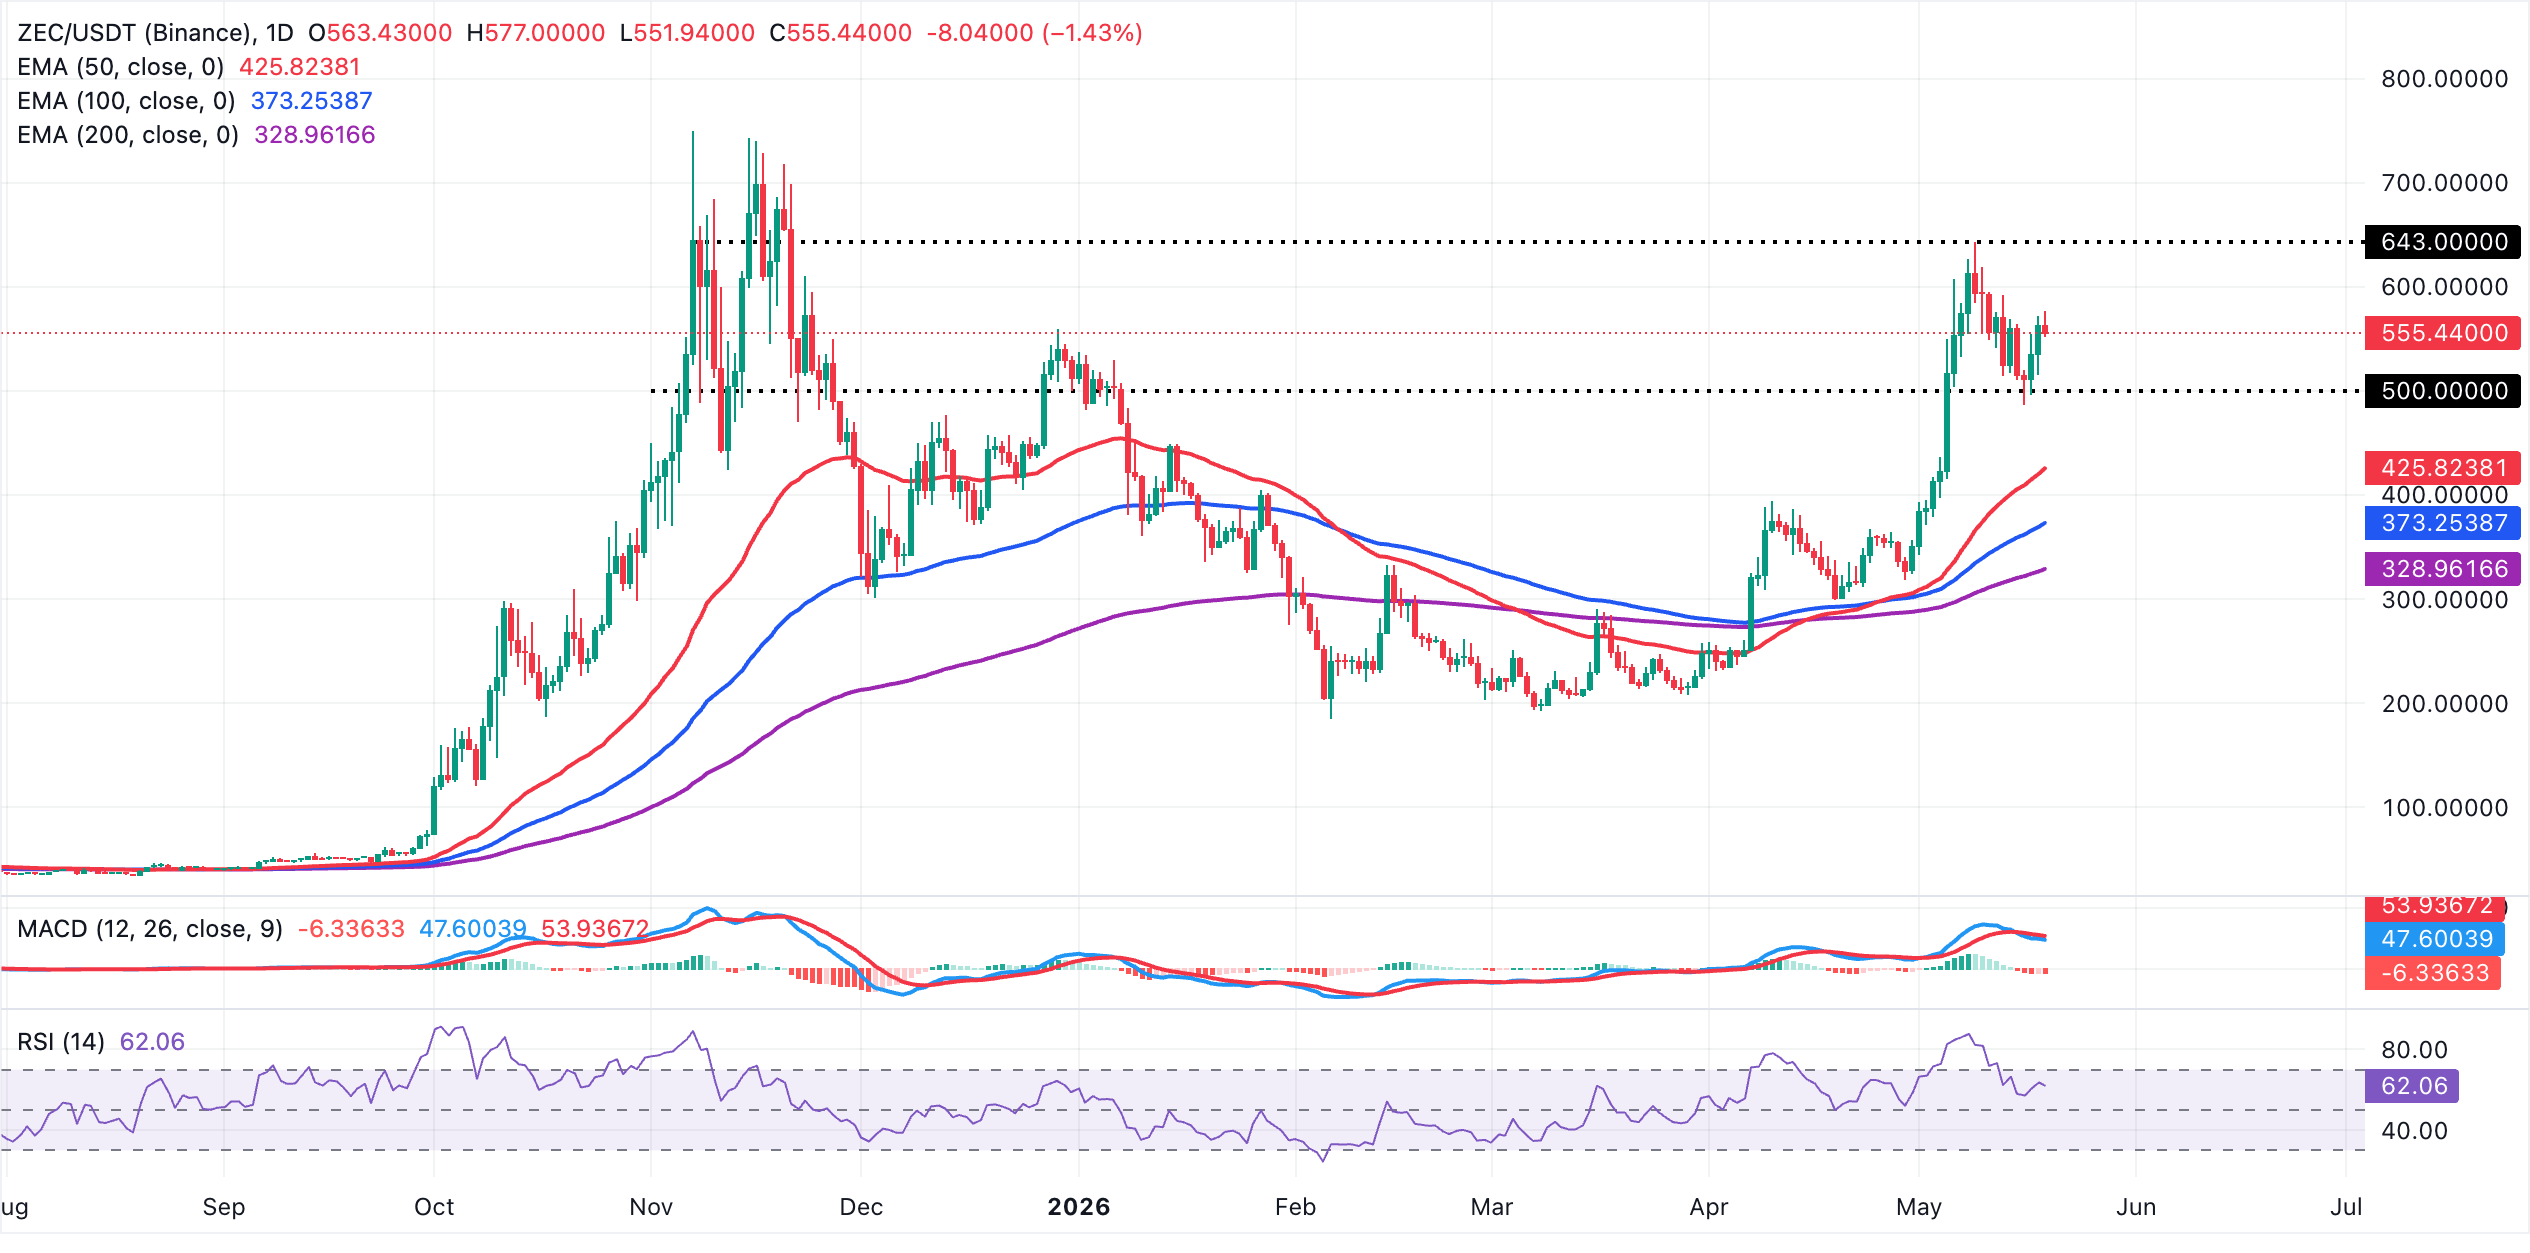
On the downside, initial support is seen at the 50-day EMA near $426, with the 100-day EMA around $373 and the 200-day EMA close to $329 providing deeper layers of demand if a larger correction unfolds. As long as price holds above these key moving averages, any dips are likely to be treated as corrective within the broader advance. Still, the mixed MACD and cooling RSI outlook suggests upside attempts could slow while the market consolidates recent gains.
(The technical analysis of this story was written with the help of an AI tool.)
Open Interest, funding rate FAQs
Higher Open Interest is associated with higher liquidity and new capital inflow to the market. This is considered the equivalent of increase in efficiency and the ongoing trend continues. When Open Interest decreases, it is considered a sign of liquidation in the market, investors are leaving and the overall demand for an asset is on a decline, fueling a bearish sentiment among investors.
Funding fees bridge the difference between spot prices and prices of futures contracts of an asset by increasing liquidation risks faced by traders. A consistently high and positive funding rate implies there is a bullish sentiment among market participants and there is an expectation of a price hike. A consistently negative funding rate for an asset implies a bearish sentiment, indicating that traders expect the cryptocurrency’s price to fall and a bearish trend reversal is likely to occur.

超過一百萬用戶依賴 FXStreet 獲取即時市場數據、圖表工具、專家洞見與外匯新聞。其全面的經濟日曆與教育網路研討會協助交易者保持資訊領先、做出審慎決策。FXStreet 擁有約 60 人的團隊,分布於巴塞隆納總部及全球各地。
閱讀更多


