
Zcash Price Forecast: ZEC recovery eyes breakout amid futures positional buildup
作者 Vishal Dixit
更新: 25 Mar 2026


熱門文章

Zcash (ZEC) edges lower at press time on Wednesday after an 11% surge in the last two days. Derivatives data shows a demand buildup in ZEC futures, with Open Interest rising by double digits over the last 24 hours.
- Zcash hovers near $240 on Wednesday, taking a break after two consecutive days of recovery.
- Derivatives data shows a sudden buildup in ZEC futures, reflecting bullish anticipation amid a short-term spot recovery.
- The technical outlook for ZEC is neutral as the recovery within a larger triangle pattern approaches overhead resistance.
Zcash (ZEC) edges lower at press time on Wednesday after an 11% surge in the last two days. Derivatives data shows a demand buildup in ZEC futures, with Open Interest rising by double digits over the last 24 hours. The technical outlook for Zcash is mixed, as the recovery remains trapped within a symmetrical triangle.
Retail interest spikes in the privacy coin
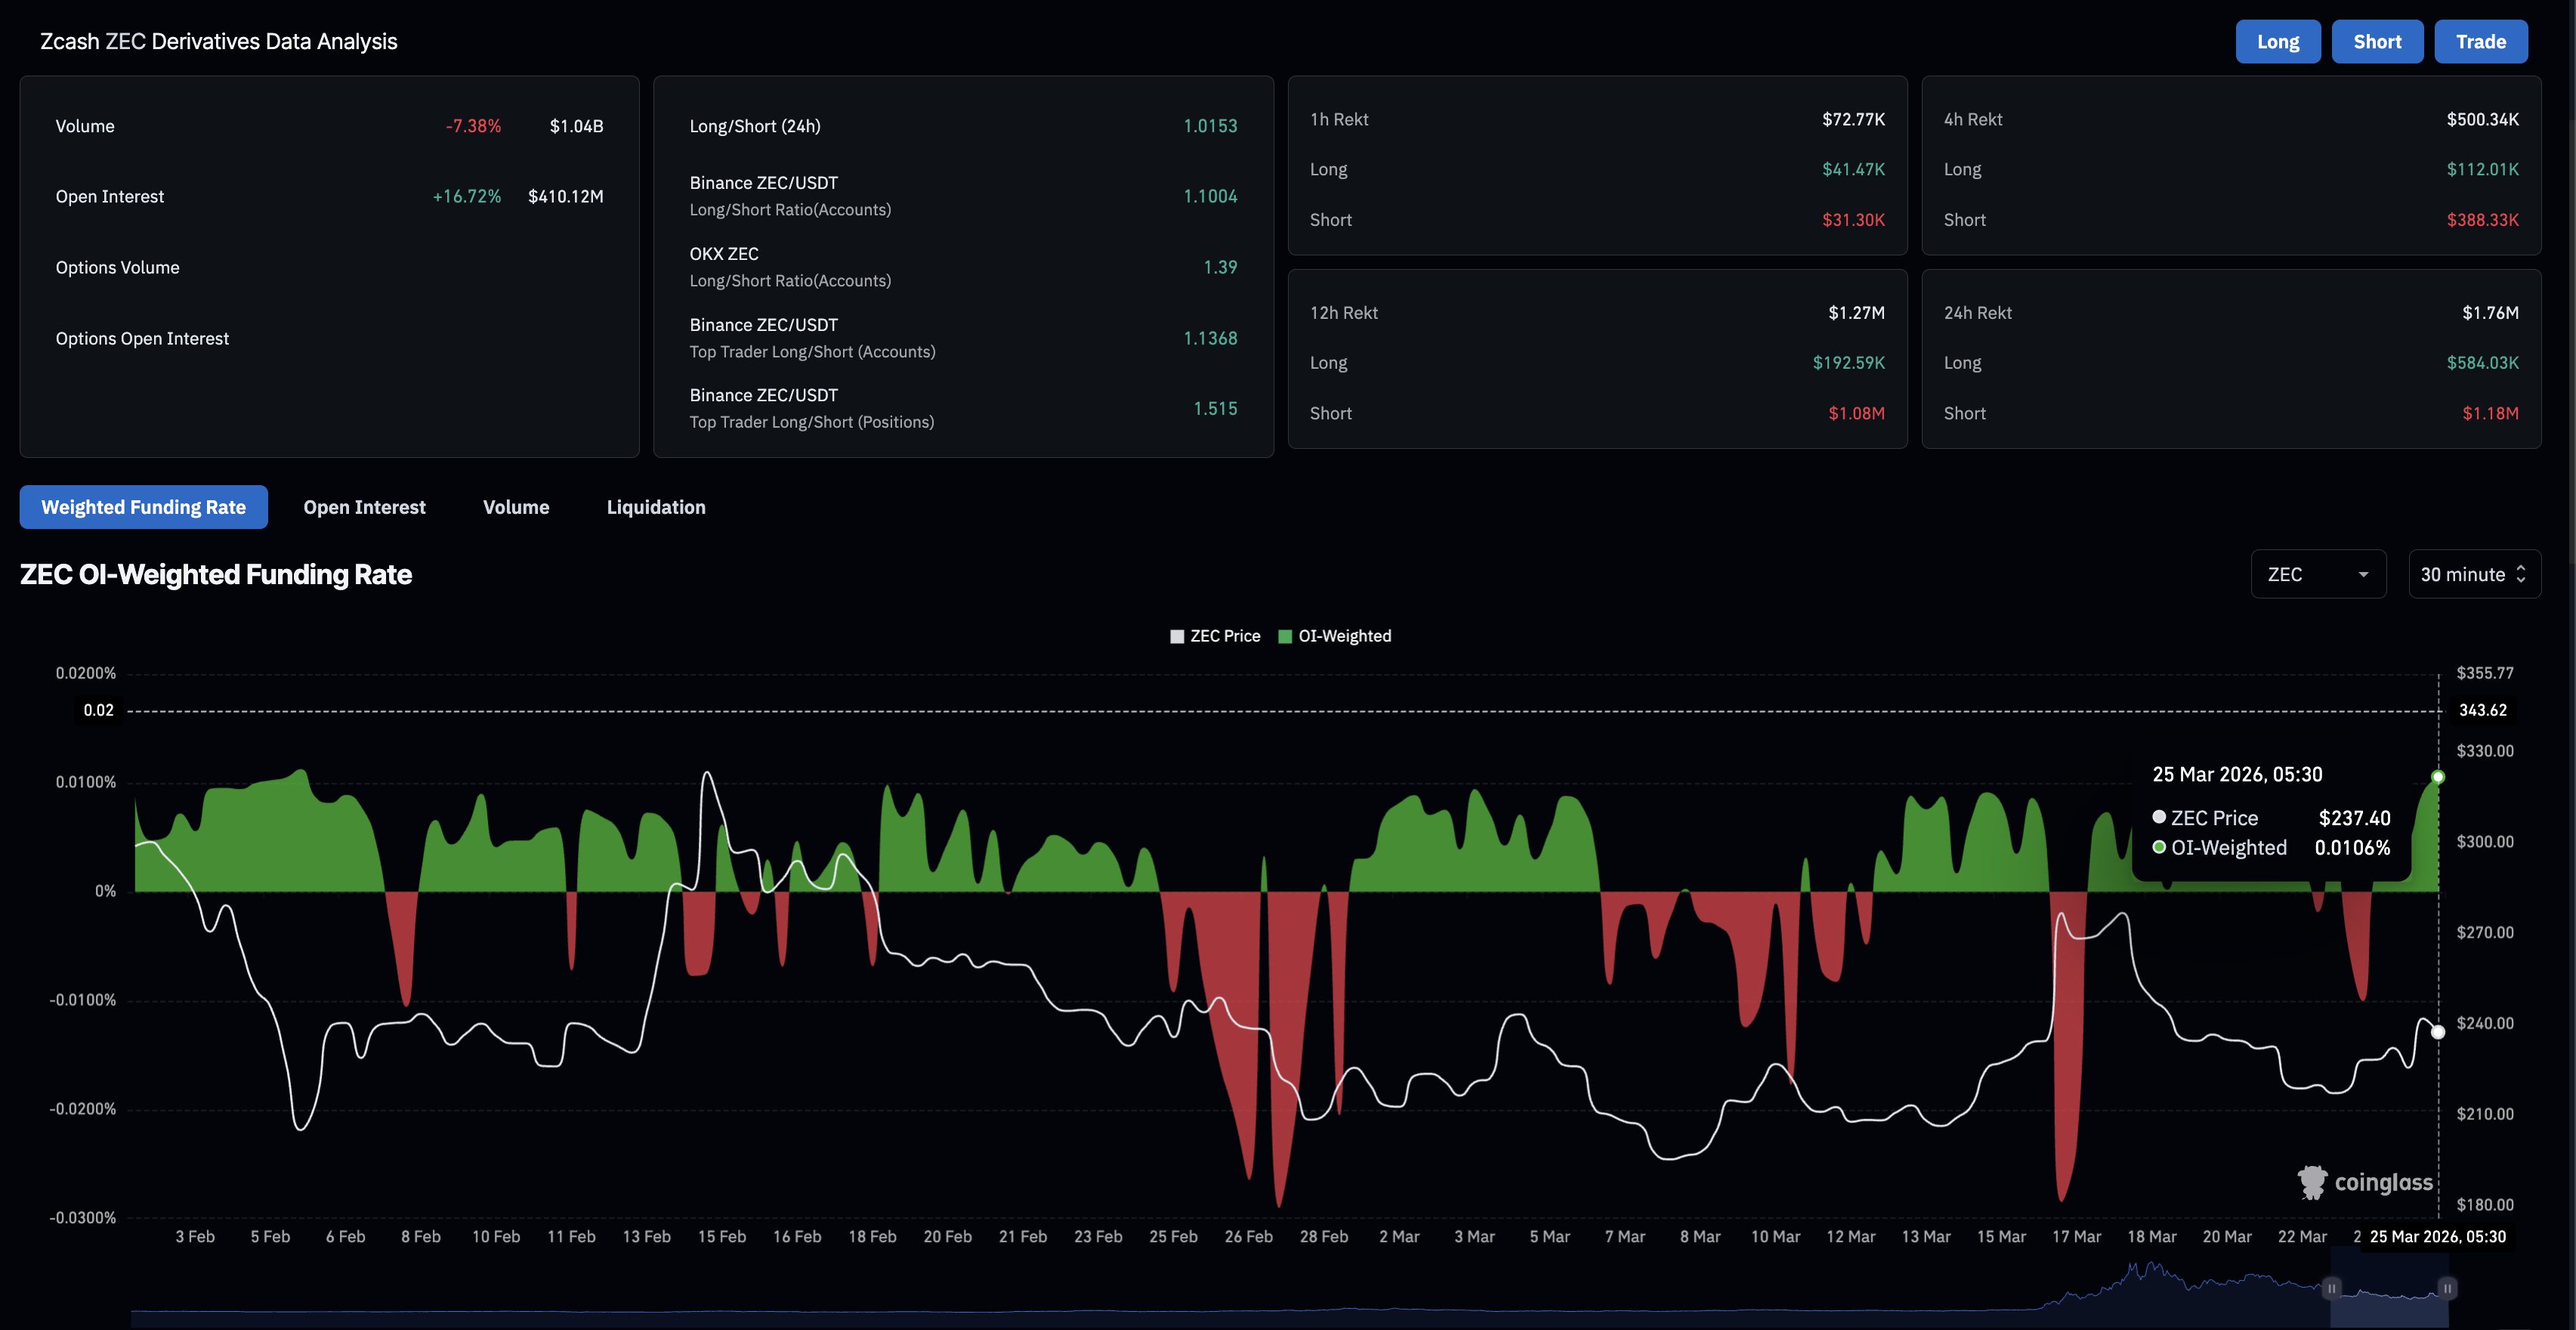
Zcash regains retail interest as the broader market shows early signs of recovery, while the US is inclined to ease pressure in the Middle East through peace talks and a one-month ceasefire. CoinGlass data shows the ZEC futures Open Interest (OI) is up over 16% in the last 24 hours, reaching $410.12 million, indicating a surge in the notional value of Zcash perpetual contracts driven by leverage exposure, fresh positional buildup, or both.
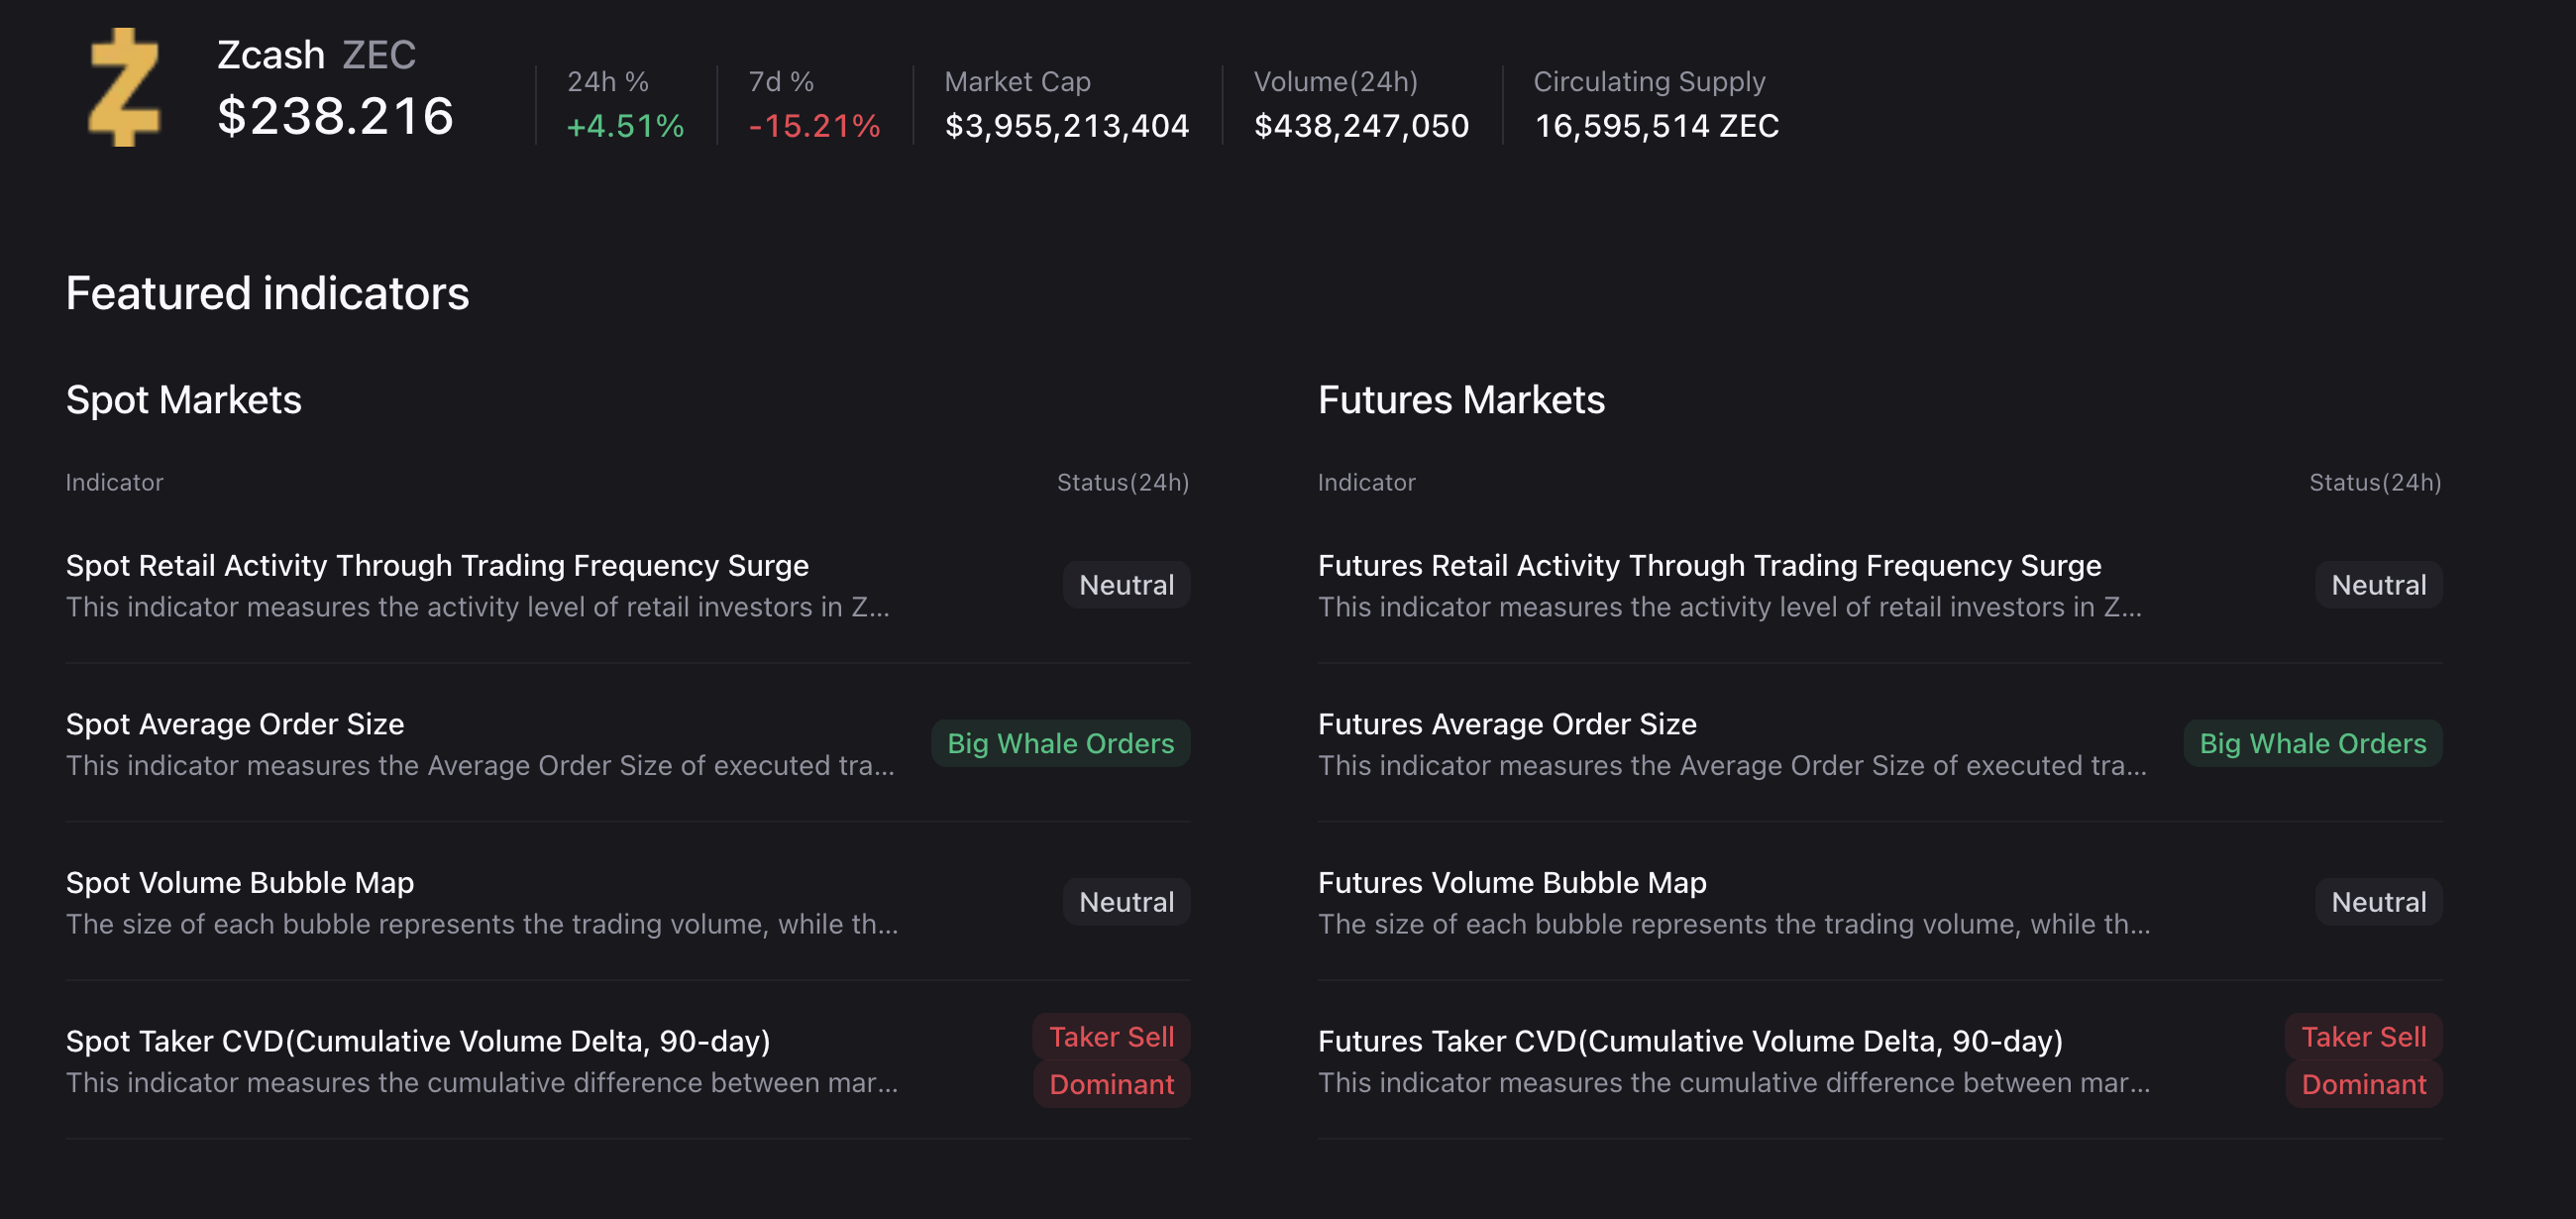
Meanwhile, CryptoQuant data shows increased interest from large wallet investors, as average order sizes rise across spot and futures markets. However, the spot taker Cumulative Volume Delta (CVD) – the difference in market buy and sell volume over the last 90 days – reflects sell-side dominance, signaling looming overhead selling pressure.
Technical outlook: Will Zcash outgrow the triangle pattern?
Zcash is down 1% at press time on Wednesday, trading close to the 38.2% Fibonacci retracement level at $231, measured from the $34.45 low to the $750 high. The near-term bias is neutral with a mild bullish tilt, as price holds above $220 following the sharp rebound from sub-$200.
Zcash fluctuates within the broader triangle defined by a long-standing descending resistance trendline and a rising support trendline on the daily chart. A decisive close above the overhead trendline near $265, which connects the highs of December 29 and March 16, would confirm the bullish breakout. A potential rally could target the 23.6% Fibonacci retracement level at $362.
The Moving Average Convergence Divergence (MACD) line remains above the signal line as both approach the positive territory, though recent flattening of the histogram signals waning upside momentum rather than outright weakness. The Relative Strength Index (RSI) at 50 reflects balanced conditions after recovering from the mid-40s.
Looking down, the key support for Zcash remains the support trendline near $200, followed by the 50% retracement level at $160.
(The technical analysis of this story was written with the help of an AI tool.)

超過一百萬用戶依賴 FXStreet 獲取即時市場數據、圖表工具、專家洞見與外匯新聞。其全面的經濟日曆與教育網路研討會協助交易者保持資訊領先、做出審慎決策。FXStreet 擁有約 60 人的團隊,分布於巴塞隆納總部及全球各地。
閱讀更多


