
Trade The World
Aster, Cosmos, and Bitget suffer major losses as crypto market faces intense sell-off
作者 Vishal Dixit
發布日期: 4 Nov 2025 | 修改日期: 4 Nov 2025


POPULAR ARTICLES

Altcoins such as Aster (ASTER), Cosmos (ATOM), and Bitget (BGB) have recorded heavy losses in the last 24 hours, as a sell-off wave ripples through the broader cryptocurrency market.
- Aster records a loss of over 20% in the last 24 hours, erasing the gains made on Sunday.
- Cosmos holds above $2.50 after falling nearly 18% on Monday.
- Bitget falls below $4 amid renewed selling pressure.
Altcoins such as Aster (ASTER), Cosmos (ATOM), and Bitget (BGB) have recorded heavy losses in the last 24 hours, as a sell-off wave ripples through the broader cryptocurrency market. Technically, the renewed selling pressure and breakdown of key support levels pose a risk of further losses for ASTER, ATOM, and BGB tokens.
Aster drops below $1 as sellers regain strength
Aster trades below $0.9300 at press time on Tuesday after a 25% loss on Monday during the broader market correction. The pullback erases the gains on Sunday made on Changpeng Zhao’s buy-and-hold move.
ASTER targets the S2 Pivot Point at $0.6915 4-hour chart after losing the S1 Pivot Point at $0.9588.
The momentum indicators on the same chart suggest that sellers are regaining strength as the Moving Average Convergence Divergence (MACD) crosses below the signal line and the zero line, coupled with a fresh wave of rising red histogram bars.
The Relative Strength Index (RSI) is at 42, hovering between the halfway point and the oversold zone, suggesting a bearish incline.
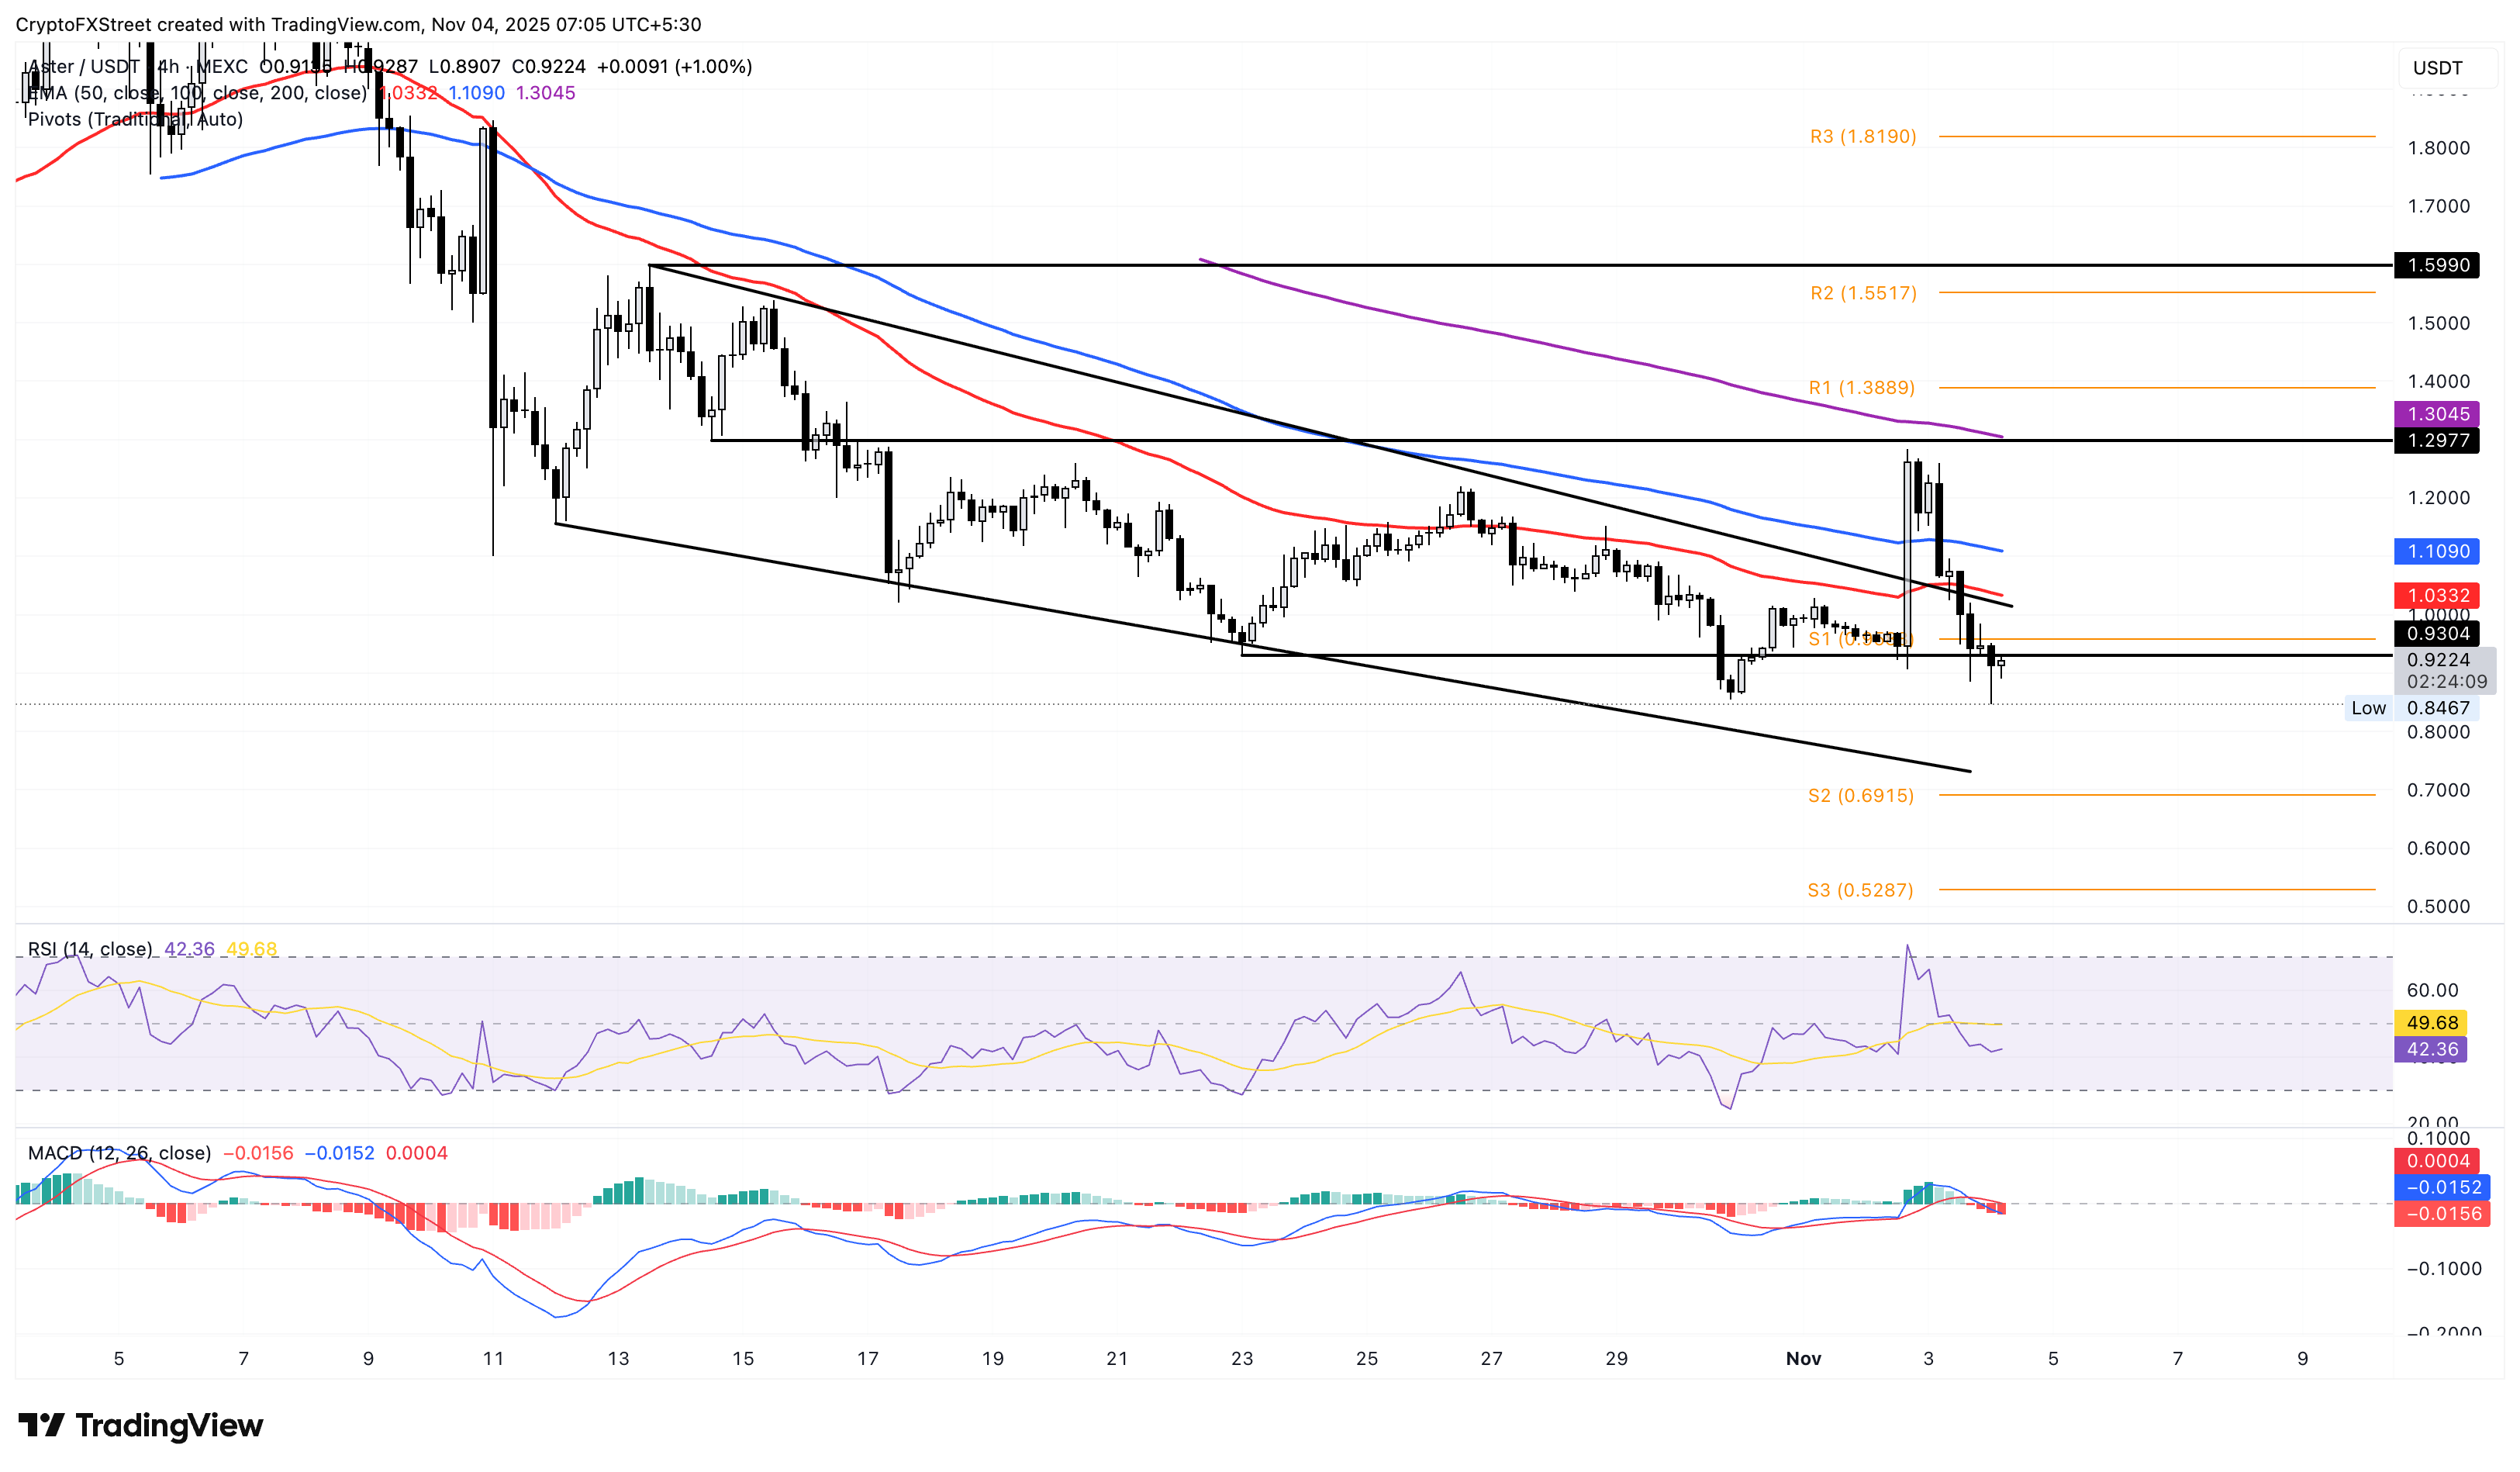
ASTER/USDT 4-hour price chart.
On the upside, a potential rebound in ASTER could target the central Pivot Point at $1.1216.
Cosmos extends correction wave
Cosmos holds above the $2.500 level at the time of writing on Tuesday, targeting the S3 Pivot Point at $2.411. A declining trend in the 50-period, 100-period, and 200-period Exponential Moving Averages (EMAs) on the 4-hour chart suggests a prevailing bearish trend.
The MACD and signal line are extending a downward trend after a crossover on Monday, indicating refreshed bearish momentum. Corroborating this, the RSI at 22 flashes an oversold trend, indicating high selling pressure.
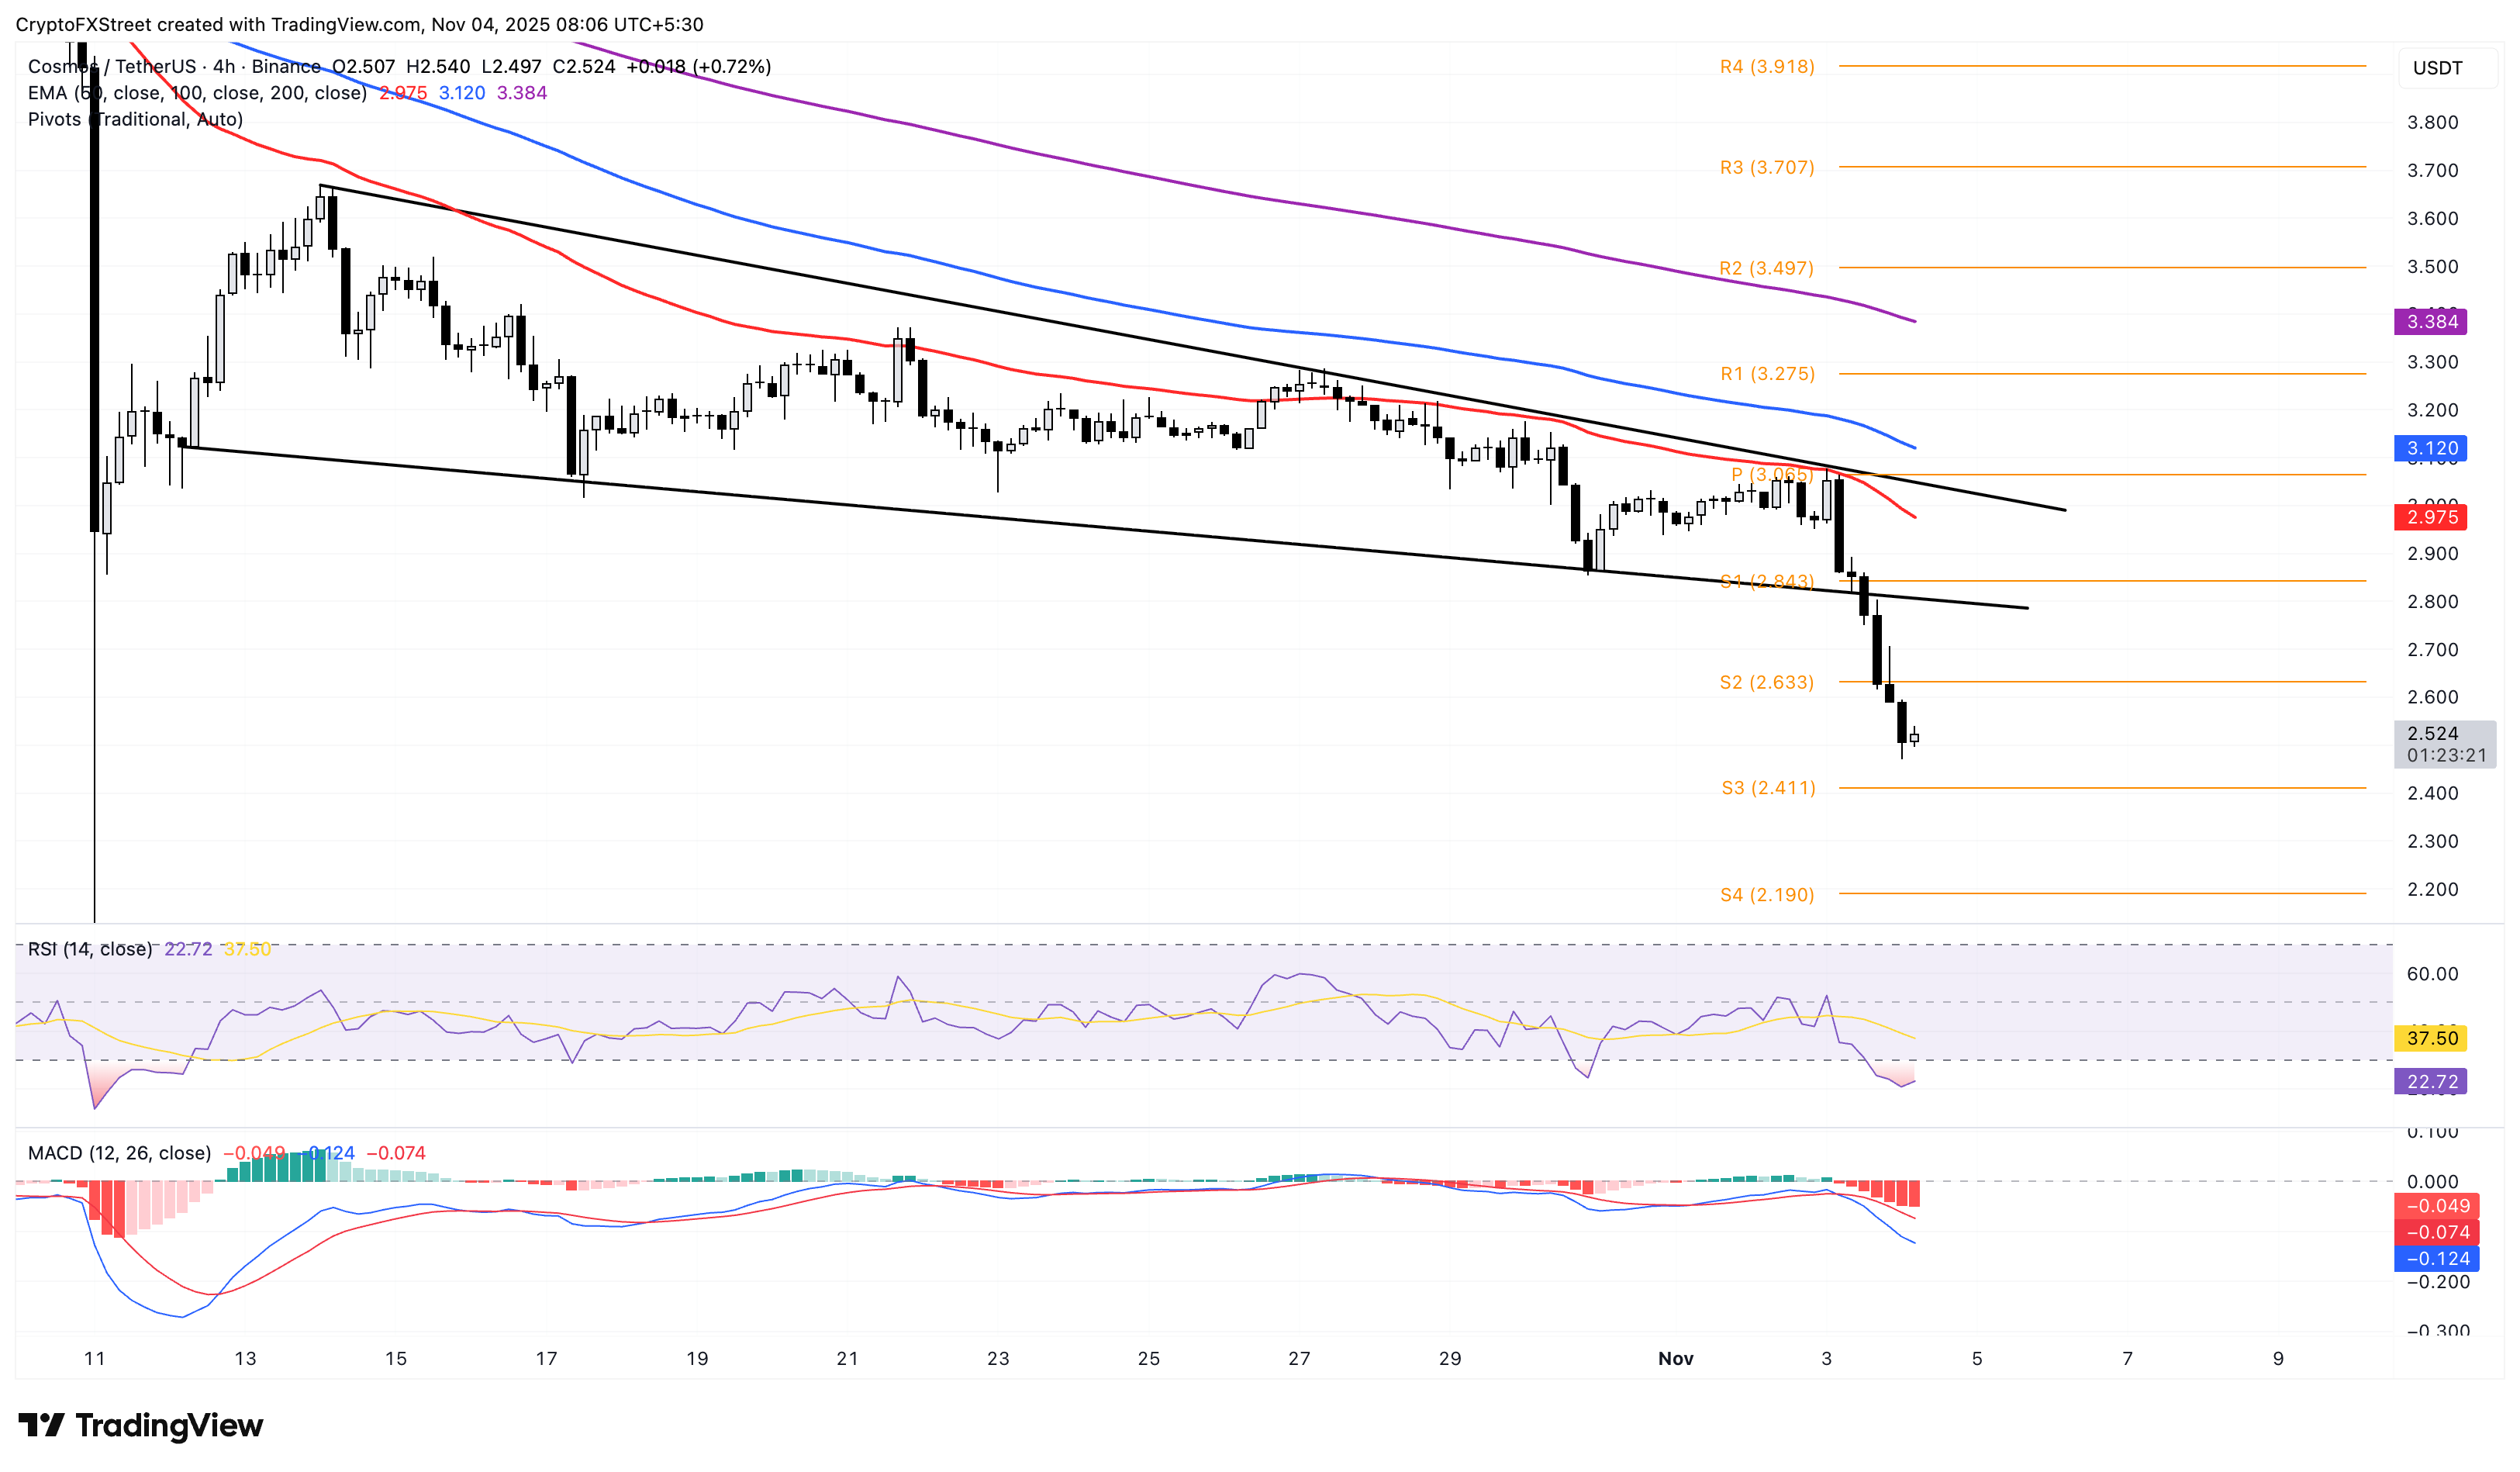
ATOM/USDT 4-hour price chart.
If ATOM resurfaces above the S2 Pivot Point at $2.633, it could extend the recovery to $2.843, marked by the S1 Pivot Point.
Bitget risks further losses as selling pressure increases
Bitget ticks lower by 1% at press time on Tuesday, extending the 16% loss from the previous day. The Centralized Exchange (CEX) token trades below $4, with sellers targeting the S2 Pivot Point at $3.384.
Furthermore, the 50-day EMA crossing below the 100-day EMA marks a bearish crossover, suggesting that short-term pullback outpaces the prevailing trend.
The MACD reverts from the signal line as renewed selling extends the downside trend. Additionally, the RSI at 21 is oversold, indicating unsustainably high levels of selling pressure.
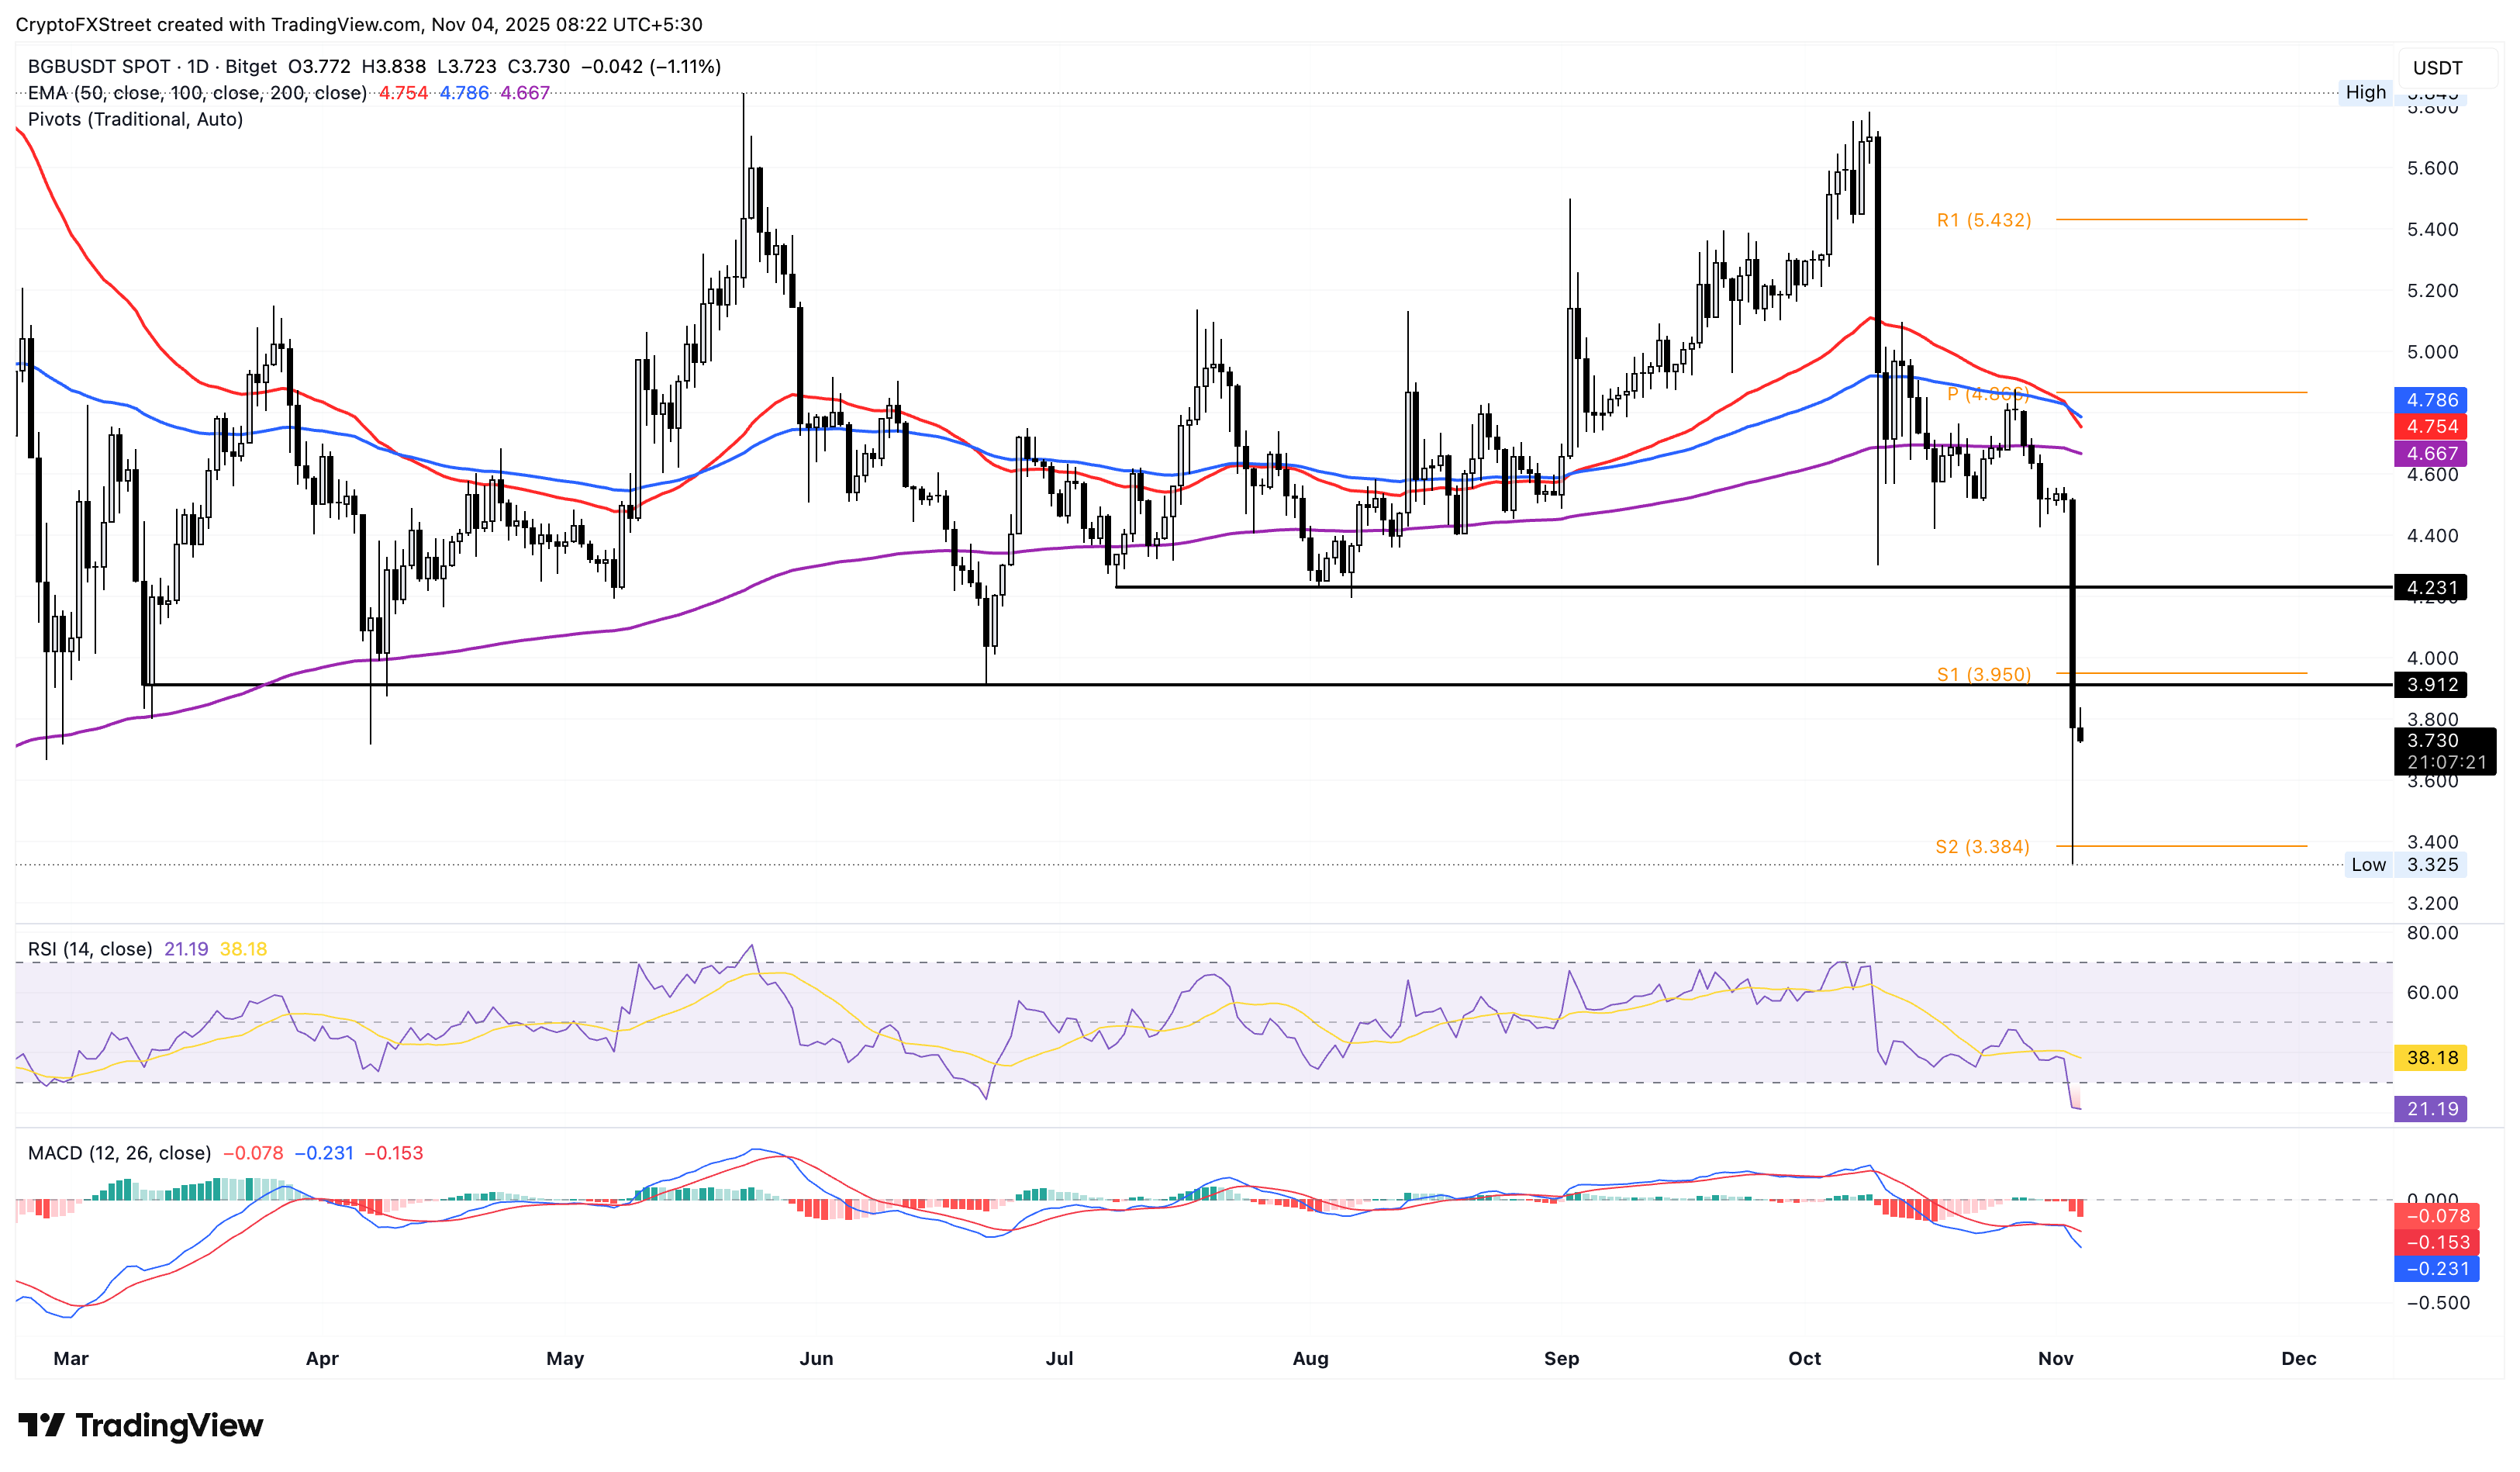
BGB/USDT daily price chart.
If BGB reclaims the $4 mark, it could test the $4.231 level marked by the July 8 low.

FXStreet
超過一百萬用戶依賴 FXStreet 獲取即時市場數據、圖表工具、專家洞見與外匯新聞。其全面的經濟日曆與教育網路研討會協助交易者保持資訊領先、做出審慎決策。FXStreet 擁有約 60 人的團隊,分布於巴塞隆納總部及全球各地。
Read More


