
Trade The World
AUD/JPY Price Forecast: Rebounds towards 101.50, bulls target yearly high
作者 Christian Borjon Valencia
發布日期: 19 Nov 2025 | 修改日期: 19 Nov 2025


POPULAR ARTICLES

The AUD/JPY recovers after posting losses of 0.17% on Monday, rises 0.39% after the cross-pair tested the 20-day Simple Moving Average (SMA) at 100.45. At the time of writing, the Aussie pair trades at 101.26 up 0.05%, as Wednesday’s Asian session kicks in.
- AUD/JPY rises 0.39% after defending support, holding firm as Asian session begins.
- Uptrend intact with higher highs and lows, pointing toward a test of the yearly peak.
- Break above resistance opens path toward 102.41–103.00; drop below support risks slide toward 101.00–100.00.
The AUD/JPY recovers after posting losses of 0.17% on Monday, rises 0.39% after the cross-pair tested the 20-day Simple Moving Average (SMA) at 100.45. At the time of writing, the Aussie pair trades at 101.26 up 0.05%, as Wednesday’s Asian session kicks in.
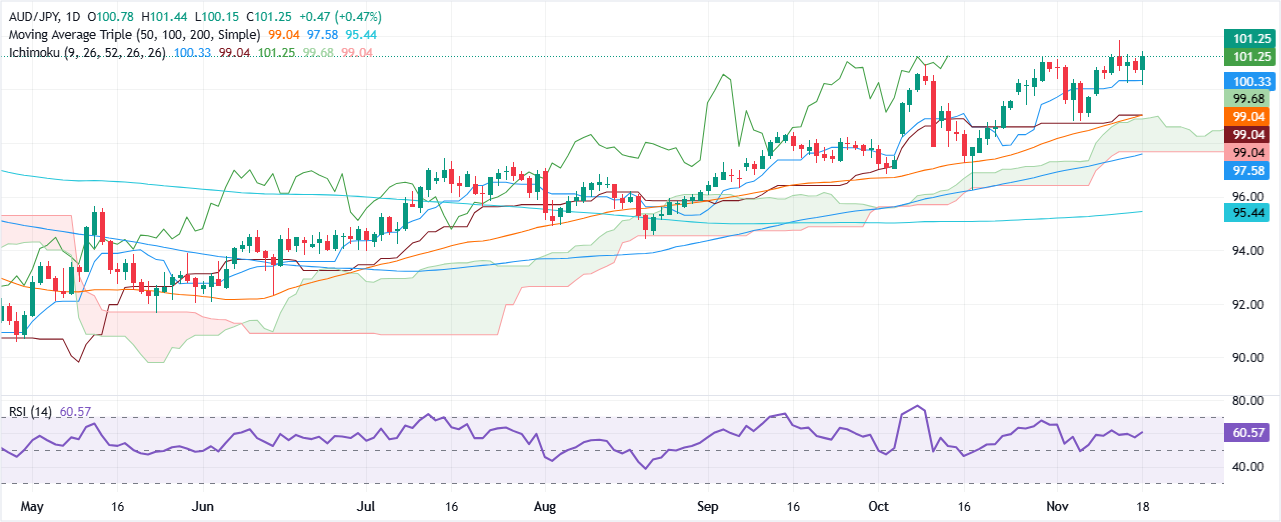
AUD/JPY Price Forecast: Technical outlook
The AUD/JPY technical picture suggests that further upside is seen. Successive series of higher highs and higher lows indicate the pair could challenge the yearly peak of 101.82.
Momentum as measured by the Relative Strength Index (RSI) shows buyers outweighing sellers. Still caution is warranted, as the RSI is shy of clearing its latest peak at around 67.50.
If AUD/JPY clears 102.00, the next stop would be November 7, 2024, high of 102.41, ahead of 103.00. Conversely if it falls below 101.50, the first support would be 101.00, followed by the 20-day SMA and the 100.00 print.
AUD/JPY Price Chart – Daily
Australian Dollar Price This week
The table below shows the percentage change of Australian Dollar (AUD) against listed major currencies this week. Australian Dollar was the strongest against the Swiss Franc.
| USD | EUR | GBP | JPY | CAD | AUD | NZD | CHF | |
|---|---|---|---|---|---|---|---|---|
| USD | 0.39% | 0.13% | 0.62% | -0.25% | 0.42% | 0.35% | 0.76% | |
| EUR | -0.39% | -0.15% | 0.61% | -0.60% | 0.02% | -0.02% | 0.38% | |
| GBP | -0.13% | 0.15% | 0.53% | -0.48% | 0.17% | 0.13% | 0.54% | |
| JPY | -0.62% | -0.61% | -0.53% | -0.85% | -0.20% | -0.28% | 0.10% | |
| CAD | 0.25% | 0.60% | 0.48% | 0.85% | 0.67% | 0.58% | 1.02% | |
| AUD | -0.42% | -0.02% | -0.17% | 0.20% | -0.67% | -0.03% | 0.37% | |
| NZD | -0.35% | 0.02% | -0.13% | 0.28% | -0.58% | 0.03% | 0.41% | |
| CHF | -0.76% | -0.38% | -0.54% | -0.10% | -1.02% | -0.37% | -0.41% |
The heat map shows percentage changes of major currencies against each other. The base currency is picked from the left column, while the quote currency is picked from the top row. For example, if you pick the Australian Dollar from the left column and move along the horizontal line to the US Dollar, the percentage change displayed in the box will represent AUD (base)/USD (quote).

FXStreet
超過一百萬用戶依賴 FXStreet 獲取即時市場數據、圖表工具、專家洞見與外匯新聞。其全面的經濟日曆與教育網路研討會協助交易者保持資訊領先、做出審慎決策。FXStreet 擁有約 60 人的團隊,分布於巴塞隆納總部及全球各地。
Read More


