
Trade The World
Bitcoin and Ethereum: Bears follow the script
作者 Przemyslaw Radomski, CFA
發布日期: 18 Dec 2025 | 修改日期: 18 Dec 2025


POPULAR ARTICLES

Crypto opened the week exactly the way last week’s charts warned it might: failed bullish defenses, fresh breakdowns, and momentum indicators flipping firmly bearish.
Crypto opened the week exactly the way last week’s charts warned it might: failed bullish defenses, fresh breakdowns, and momentum indicators flipping firmly bearish.
Both BTC and ETH have now confirmed the structural cracks we highlighted earlier, and unless bulls reclaim lost levels fast, the path of least resistance remains lower.
Bitcoin: Breakdown confirmed, and the bears aren’t done
We start with the quote from Monday’s Lab Note #44:
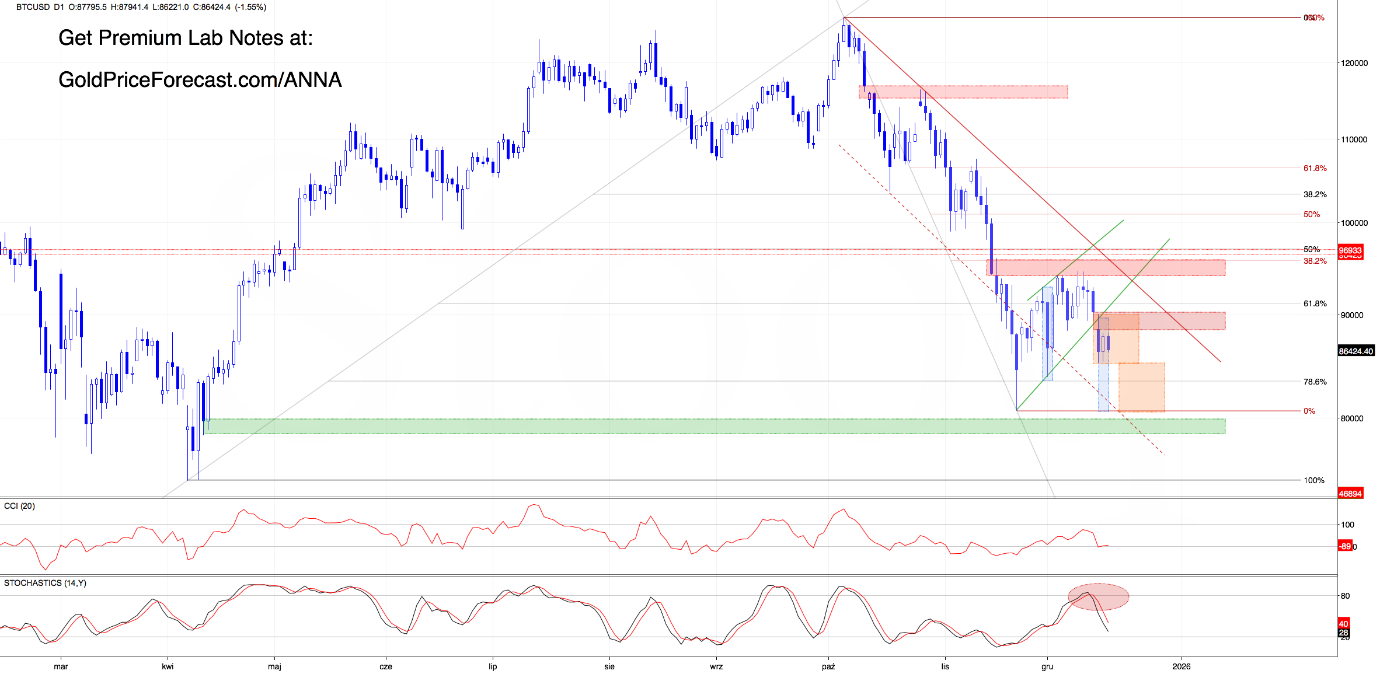
(…) The first and most important thing visible on today’s BTC daily chart is the red bearish gap, which dragged price below the lower border of the green rising wedge. That alone is a structural warning. On top of that, Stochastics just triggered a sell signal, adding momentum pressure to the downside.
So, here’s the critical part… if bulls fail to invalidate this breakdown (…) then the risk of activating the bearish scenario from December 11th (Lab Note #39) will increase sharply (…)
Looking at the above chart, we see that bulls failed - completely.
Monday closed with a big, clean bearish candle, firmly below the wedge. Additionally, price attempted to stabilize inside the orange consolidation, but with the above-mentioned (confirmed) breakdown, momentum is still pointing down.
On top of that, all sell signals remain active, which means that the Dec.11 bearish scenario remains 100% valid:
(…) If sellers manage to break below the lower border of the green wedge (and especially if we get a daily close under it […]), the road to 8,000s could open up fast. At this point, it is also worth noting that the Stochastic just flashed a sell signal, which could be the trigger bears need.
(…) if bulls want to fight back, they need to close above the resistance wedge + gap zone. Until then? The risk is tilted south.
Ethereum: Same message, different chart
Let’s start with the ETH quote from Monday:
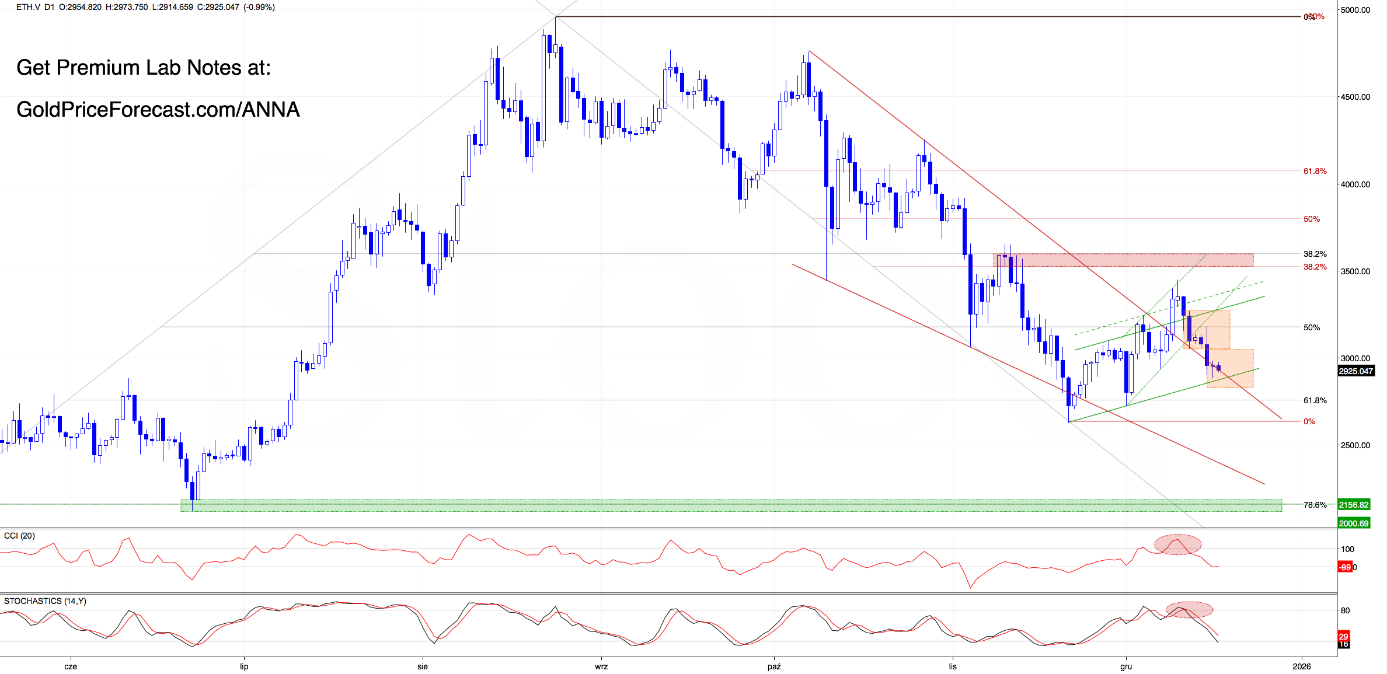
“Indicators have already produced sell signals, which means that if bears manage to push ETH below the lower border of the consolidation and the red wedge’s support line, the bearish scenario from December 11th will become the leading one.”
And again… that’s exactly what happened - Monday closed below the consolidation and under the wedge support. Additionally, sell signals remain active on all major indicators, which means ETH (just like BTC) has shifted into the Dec.11 bearish scenario, and unless bulls quickly take back the lost levels, momentum says they’re not strong enough to reverse it right now.
“(…) If price closes below the upper line of this formation, expect another test of the previously broken wedge line. And if that breaks too? That would be the second invalidation, which could open clear path toward:
- The lower line of the green channel (currently at around 2823.55).
- The 61.8% Fibonacci retracement.
- Possibly even a full retest of the falling wedge support (currently at around 2490).
Lab takeaway – What should traders actually watch today?
Both BTC and ETH have confirmed breakdowns and active sell signals, which means the sellers control the short-term trend.
The bearish scenarios from Dec.11 are still in control. For the outlook to change, bulls would need to climb back above the support levels they just lost and stay there. Until that happens, the market is following the downside path.

FXStreet
超過一百萬用戶依賴 FXStreet 獲取即時市場數據、圖表工具、專家洞見與外匯新聞。其全面的經濟日曆與教育網路研討會協助交易者保持資訊領先、做出審慎決策。FXStreet 擁有約 60 人的團隊,分布於巴塞隆納總部及全球各地。
Read More


