
Trade The World
Bittensor, Mantle, and Aster lead losses as the crypto market bleeds $770 million
作者 Vishal Dixit
發布日期: 22 Oct 2025 | 修改日期: 22 Oct 2025


POPULAR ARTICLES

Bittensor (TAO), Mantle (MNT), and Aster (ASTER) are leading losses over the last 24 hours as the broader cryptocurrency market bleeds over $770 million. The pullback in TAO, MNT, and ASTER threatens key support levels as bearish momentum gains strength, risking further losses.
- Bittensor drops below $400, risking a breakdown of the 200-day EMA as bullish momentum declines.
- Mantle revisits a key support at the $1.59 mark, with bears eyeing further losses.
- Aster struggles to hold the $1.00 psychological support as bearish momentum resurfaces.
Bittensor (TAO), Mantle (MNT), and Aster (ASTER) are leading losses over the last 24 hours as the broader cryptocurrency market bleeds over $770 million. The pullback in TAO, MNT, and ASTER threatens key support levels as bearish momentum gains strength, risking further losses.
Crypto market suffers another bearish cut
Waves of heightened liquidation spikes, primarily long liquidations, in the cryptocurrency market underline rising volatility and bearish dominance. CoinGlass data shows that $772 million worth of open contracts suffered forced liquidation in the last 24 hours, with $62.62 million of long liquidation outpacing $309.54 million of short liquidation losses.
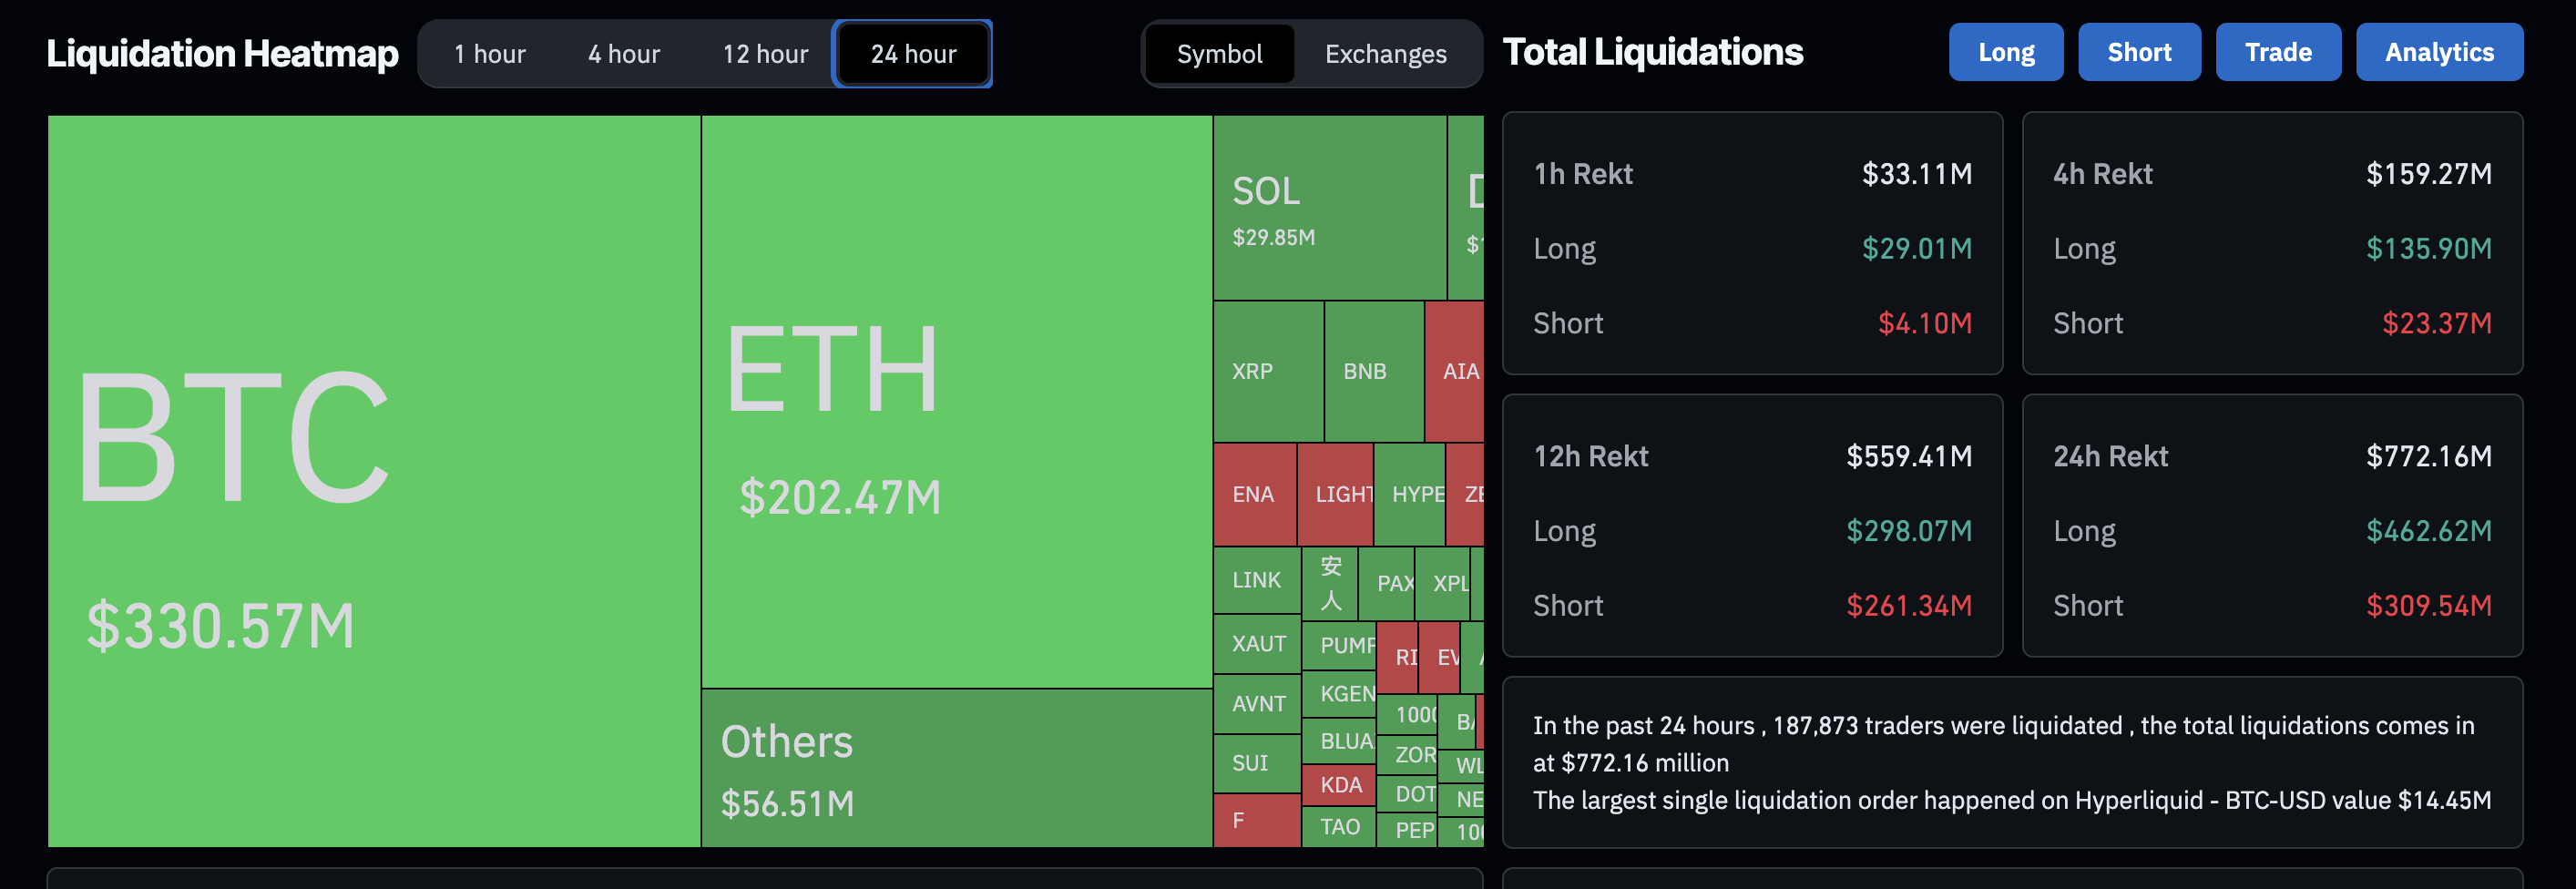
Crypto market liquidations data. Source: CoinGlass
Driving the losses, $330 million worth of open positions in Bitcoin (BTC) and $202 million in Ethereum (ETH) got liquidated. At the time of writing, Bitcoin is trading below $109,000, and Ethereum (ETH) is under $3,900.
Bittensor drops below $400, risks further loss
Bittensor trades above the 200-day Exponential Moving Average (EMA) at $361 at press time on Wednesday, after losing the $400 psychological support in a 5% drop on Tuesday. The overhead pressure at the 50% retracement level, identified from the high of $748 on December 6 to the low of $167 on April 7, was encountered at $458 on Sunday and triggered the ongoing pullback.
The immediate support lies at the converging 50-day, 100-day, and 200-day EMAs near $361. A slip below this level could extend the decline to $304, marked by the 23.6% Fibonacci retracement level.
A bearish shift in trend momentum is indicated by the technical signals on the daily chart, as the Moving Average Convergence Divergence (MACD) slopes downwards and converges with its signal line for a potential crossover. At the same time, the Relative Strength Index (RSI) at 52 consolidates slightly above the halfway line, indicating a decline in bullish strength.
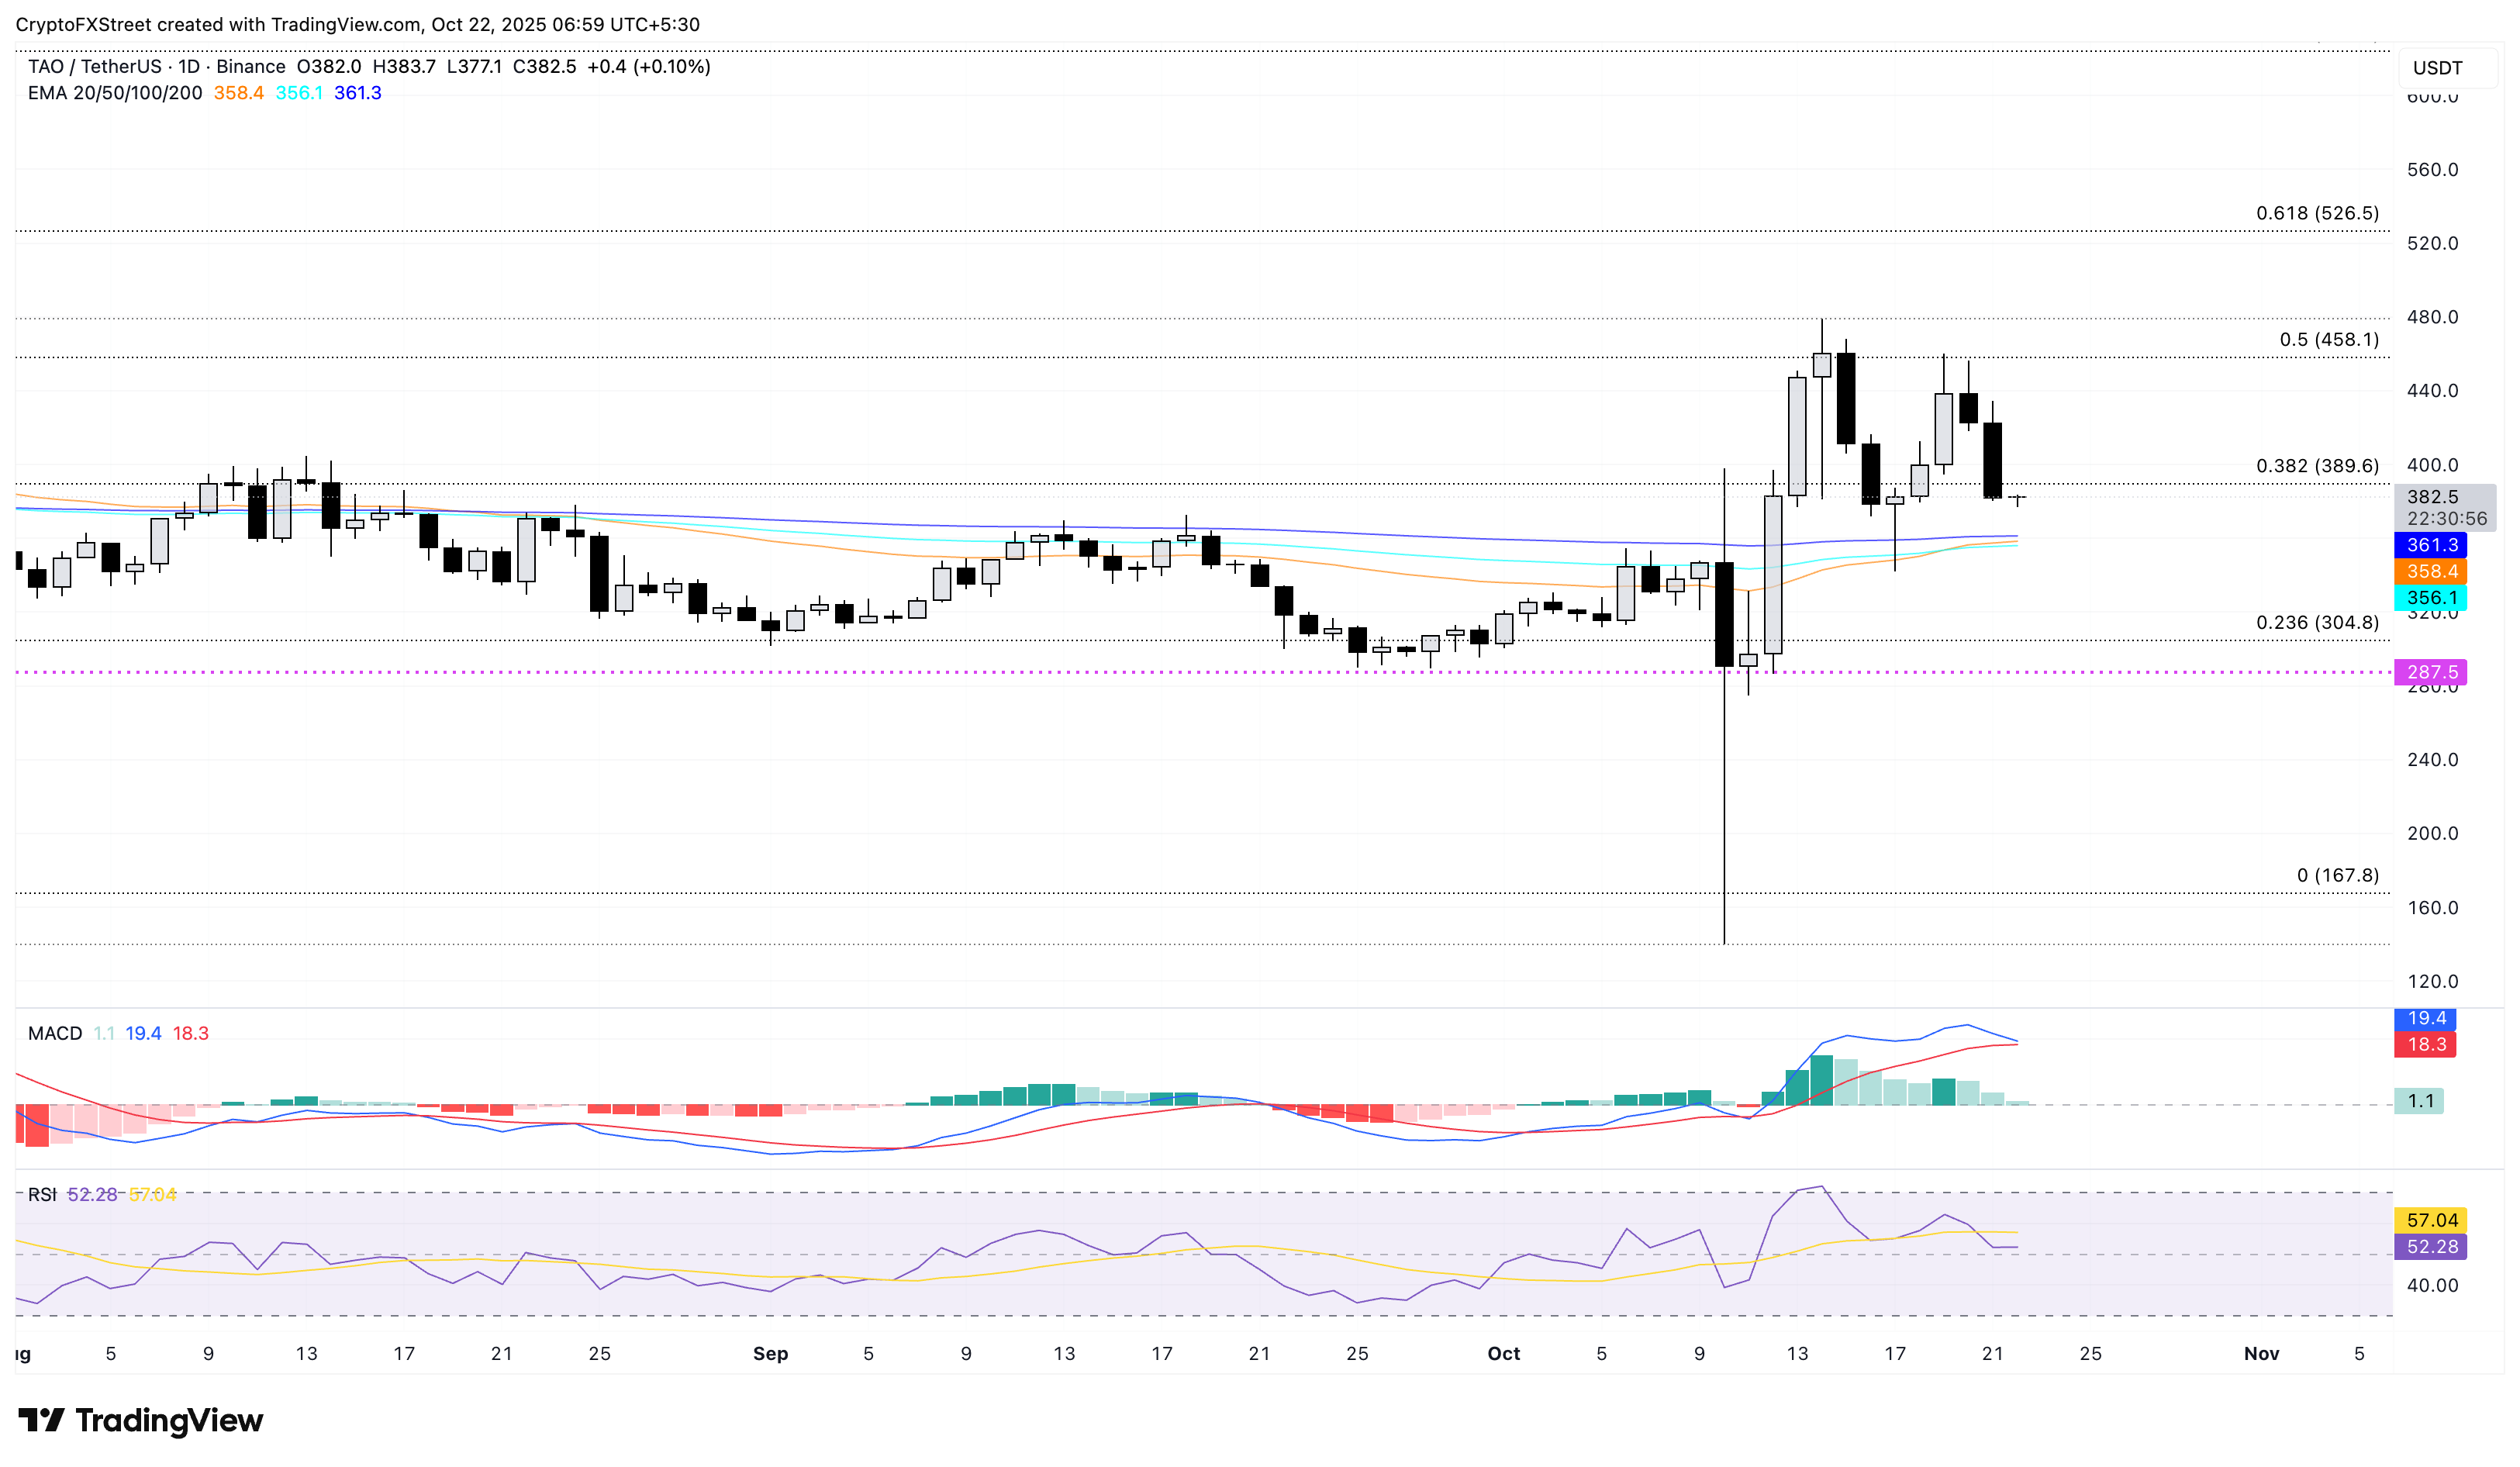
TAO/USDT daily price chart.
If TAO bounces off the 200-day EMA at $361, it could face the $400 milestone and the $458 level as overhead resistances.
Mantle puts pressure on the key monthly support level
Mantle edges lower by 1% at press time on Wednesday, extending the decline for the third consecutive day, which accounts for a 13% loss so far this week. The ongoing pullback tests the $1.59 support zone, which provided multiple reversals earlier this month, risking a potential breakdown.
A potential close below this level could result in a free-fall S1 Pivot Point level at $1.24, slightly above the 200-day EMA.
The bearish grip on the Mantle price trend tightens, as indicated by the declining MACD below the zero line. Furthermore, the rise in red histogram bars below the same line corroborates a rise in bearish momentum.
Simultaneously, the RSI at 44, slipping below the midpoint, points to a bearish shift from the neutral zone.
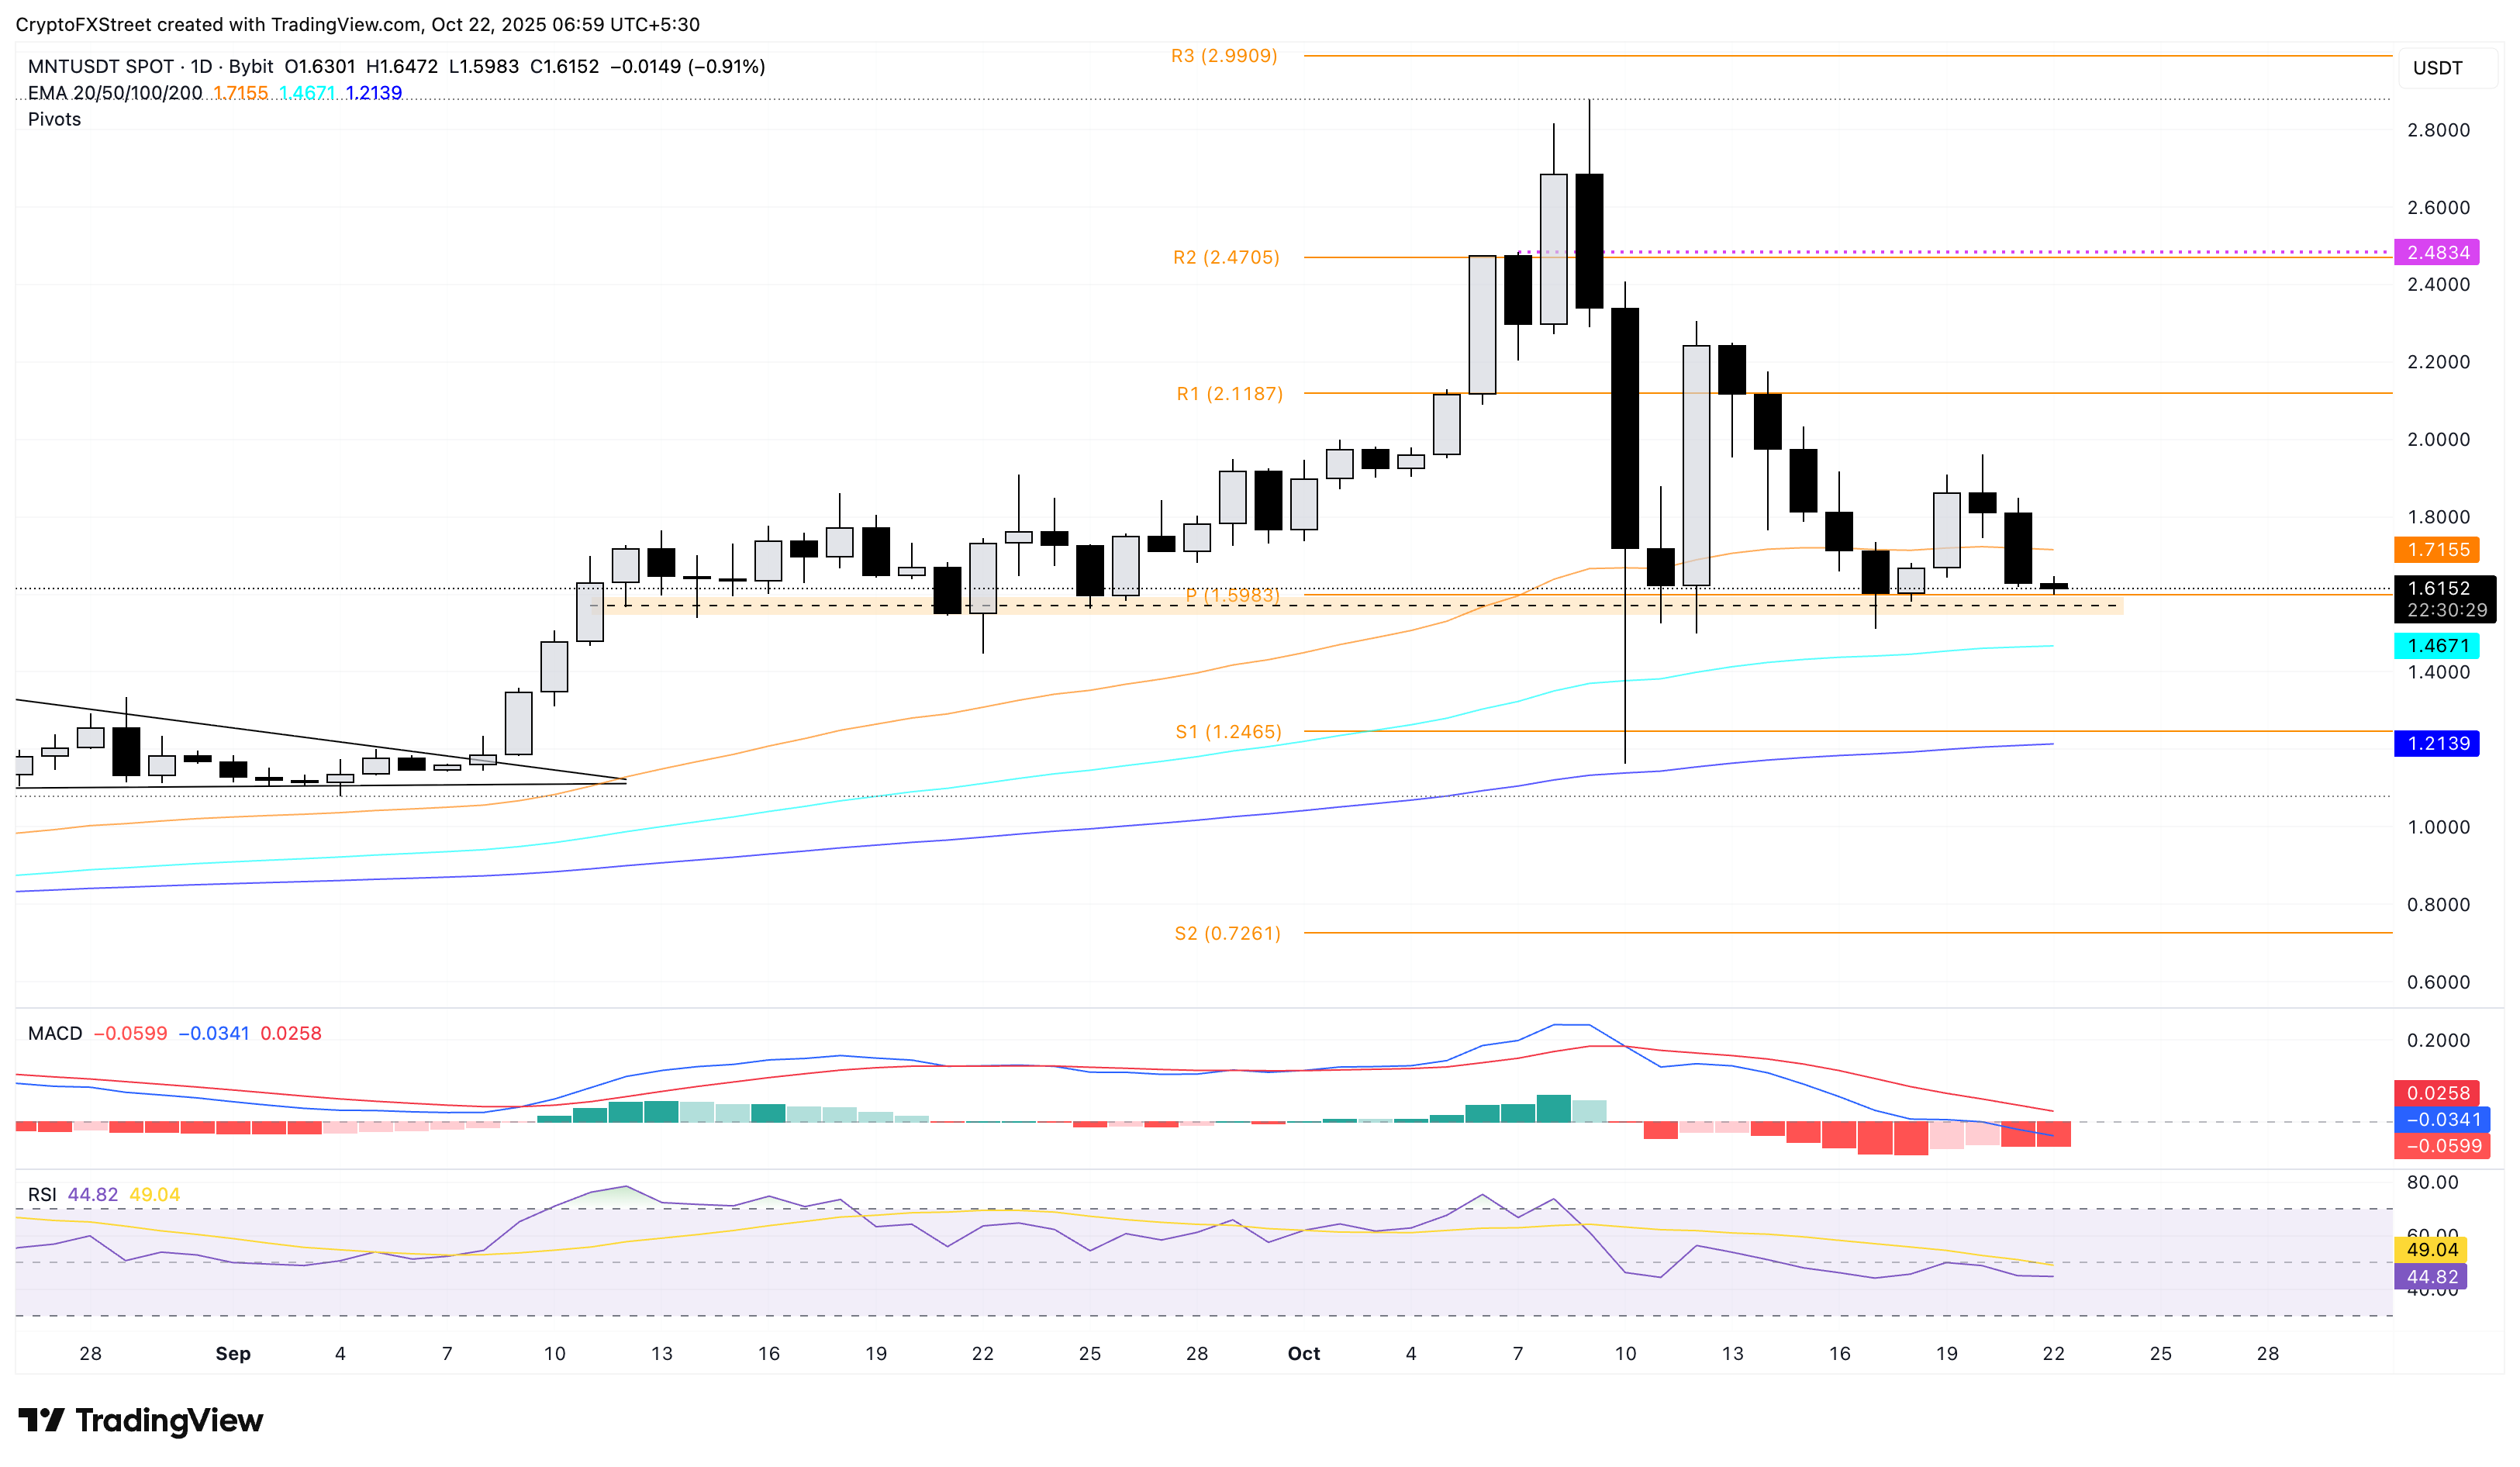
MNT/USDT daily price chart.
On the flip side, if MNT rebounds from $1.59, the key resistance lies at the R1 Pivot Point level at $2.11.
Aster risks losing the $1 mark
Aster holds above the $1 psychological level at the time of writing on Wednesday, following two consecutive days of losses. If the Decentralized Exchange (DEX) token drops below $1.00, it could find support at the S1 Pivot Point at $0.94.
The technical indicators on the daily chart corroborate the downside possibility as the MACD crosses below its signal line, reflecting a bearish shift in trend momentum. Additionally, the RSI at 34, near the oversold zone, suggests a heightened selling pressure.
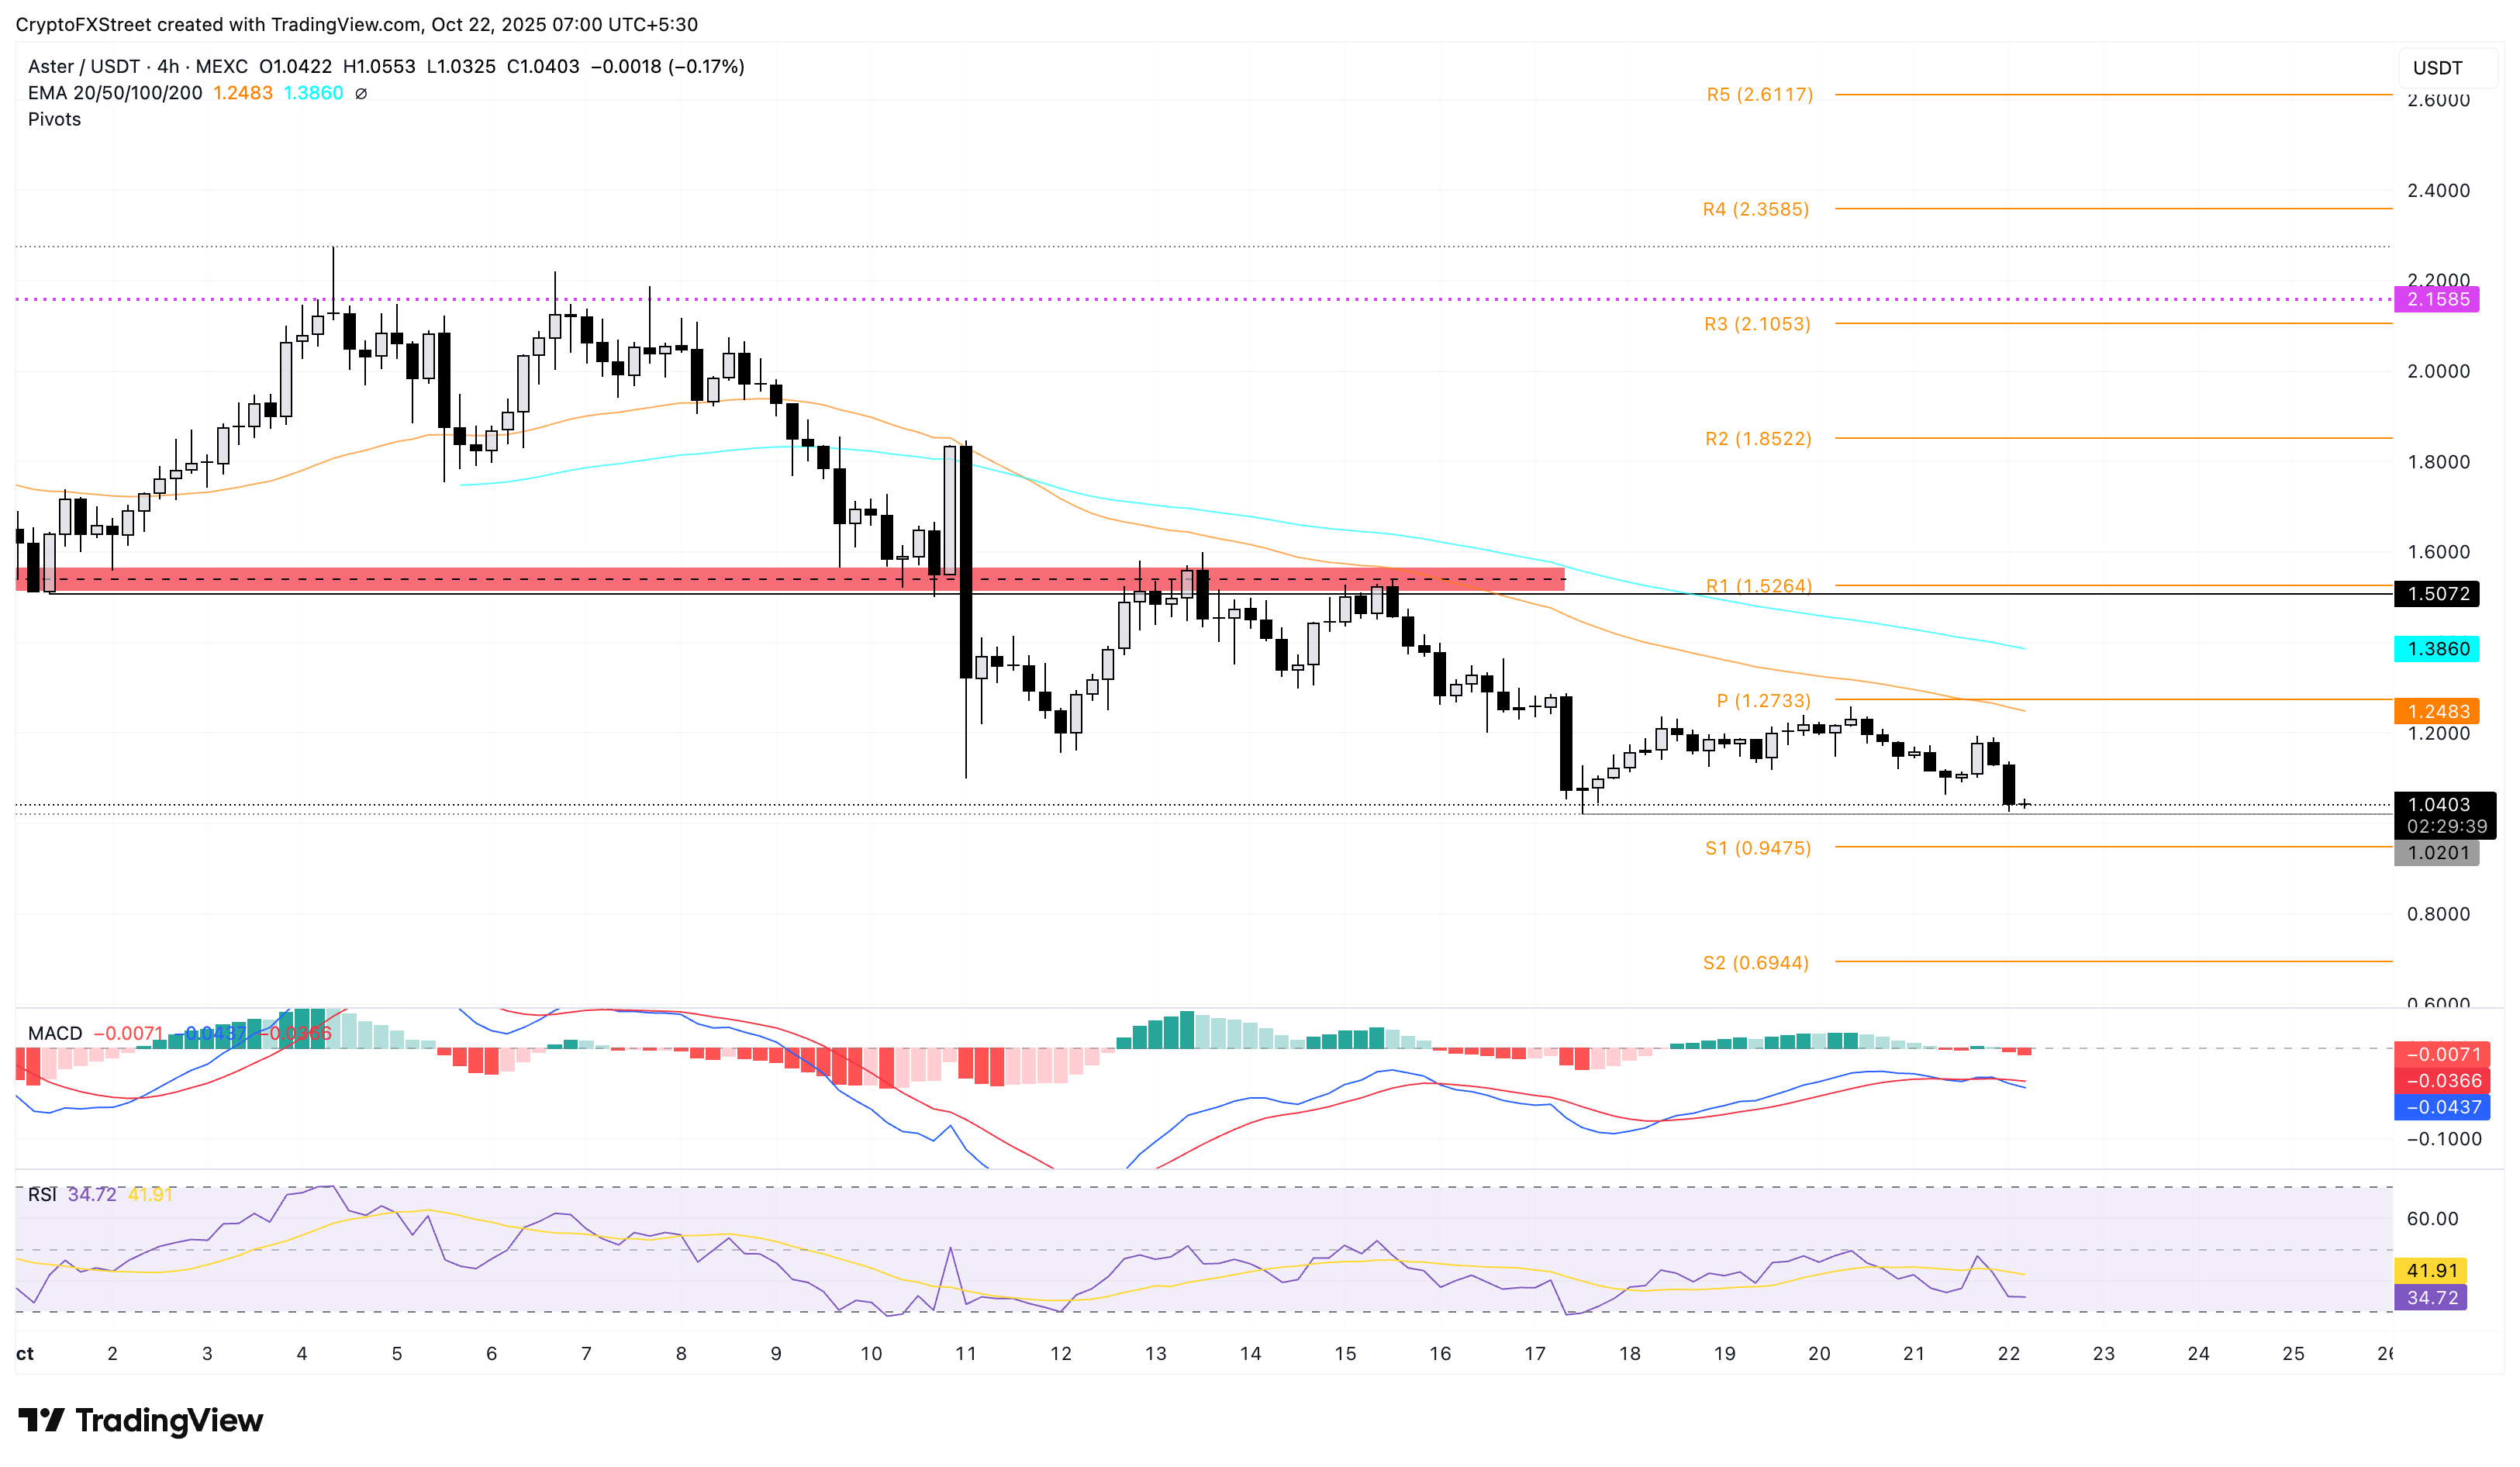
ASTER/USDT 4-hour price chart.
If ASTER flips to the north from the $1.00 level, it could test the centre Pivot Point at $1.27.

FXStreet
超過一百萬用戶依賴 FXStreet 獲取即時市場數據、圖表工具、專家洞見與外匯新聞。其全面的經濟日曆與教育網路研討會協助交易者保持資訊領先、做出審慎決策。FXStreet 擁有約 60 人的團隊,分布於巴塞隆納總部及全球各地。
Read More


