
Trade The World
Crypto Today: Bitcoin, Ethereum, XRP eye short-term recovery despite sticky bearish sentiment
作者 John Isige
發布日期: 24 Nov 2025 | 修改日期: 24 Nov 2025


POPULAR ARTICLES

Bitcoin (BTC) is trading above $86,000 at the time of writing on Monday, as bulls battle to regain control and bolster a breakout above $90,000 this week. Altcoins, including Ethereum (ETH) and Ripple (XRP), are holding above key support levels at $2,800 and $2.00, respectively.
- Bitcoin struggles to hold above $86,000 despite a resurgence in ETF inflows.
- Ethereum could confirm a second Death Cross pattern on the daily chart as price holds above $2,800.
- XRP steadies above $2.00, supported by ETF inflows and a relatively stable derivatives market.
Bitcoin (BTC) is trading above $86,000 at the time of writing on Monday, as bulls battle to regain control and bolster a breakout above $90,000 this week. Altcoins, including Ethereum (ETH) and Ripple (XRP), are holding above key support levels at $2,800 and $2.00, respectively.
Data spotlight: Bitcoin, ETH ETF inflows resume
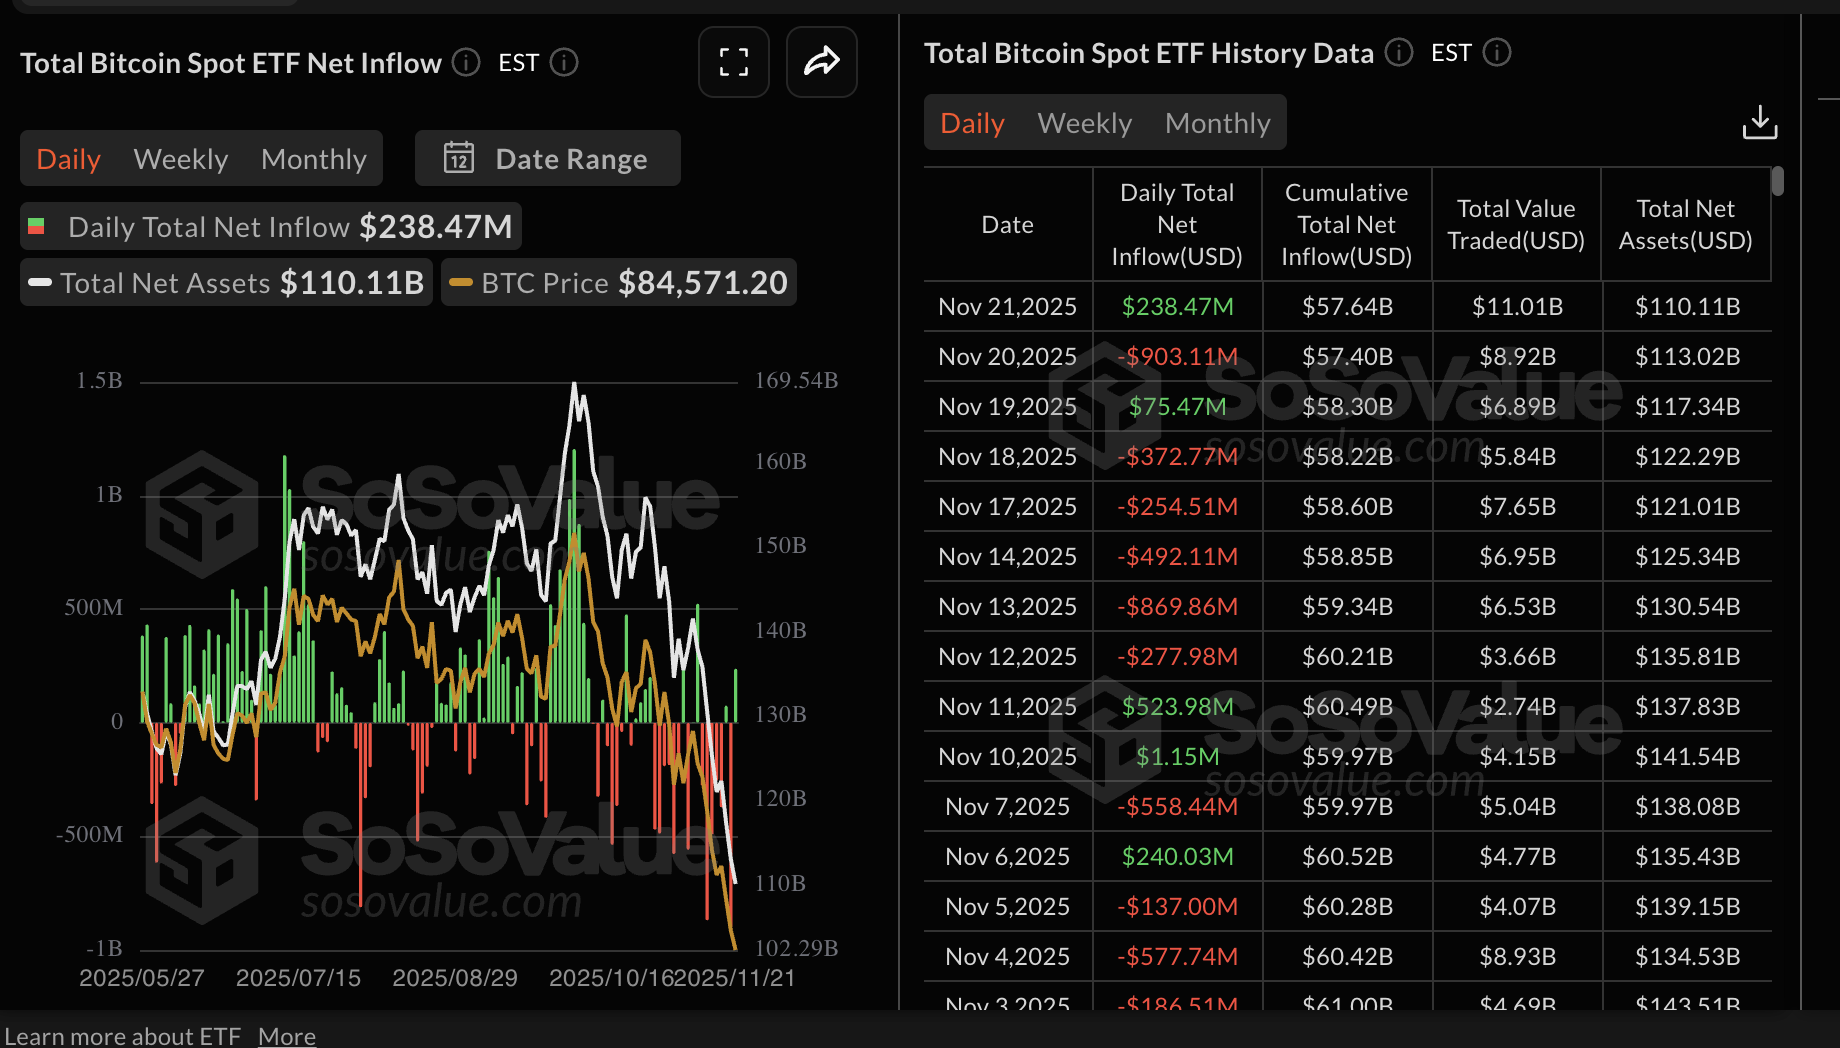
Bitcoin experienced a mild return of institutional investors last week, highlighted by two days of inflows. US-listed spot Exchange Traded Funds (ETFs) recorded approximately $238 million in inflows on Friday and $75 million on Wednesday.
Since the October 10 flash crash, demand for crypto-related financial products, such as ETFs, has not recovered. Macroeconomic uncertainty, concerns about the Federal Reserve's (Fed) December policy meeting, and a lack of conviction in the market's ability to sustain the recovery are among the factors contributing to the deteriorating outlook.
Institutional investors' behaviour in the coming days will help gauge the overall sentiment in the crypto market. Steady ETF inflows would reinforce the bullish outlook. Still, if ETF outflows resume, it will be an uphill task to sustain the recovery toward $90,000.
Ethereum spot ETFs listed in the US flipped slightly bullish, with nearly $56 million in inflows on Friday. This inflow resurgence broke an eight-day streak of outflows, according to SoSoValue data. Steady inflows are required to back positive market sentiment, subsequently increasing the odds of a bullish breakout.

Meanwhile, XRP highlights a weak but stable derivatives market, with the futures Open Interest (OI) averaging between $3 billion and $4 billion over the past two weeks.
CoinGlass data shows OI, which tracks the notional value of outstanding futures contracts, averaging $3.61 billion on Monday, up from $3.28 billion on the previous day. OI must steadily rise to bolster risk-on sentiment, as investors increase their risk exposure.
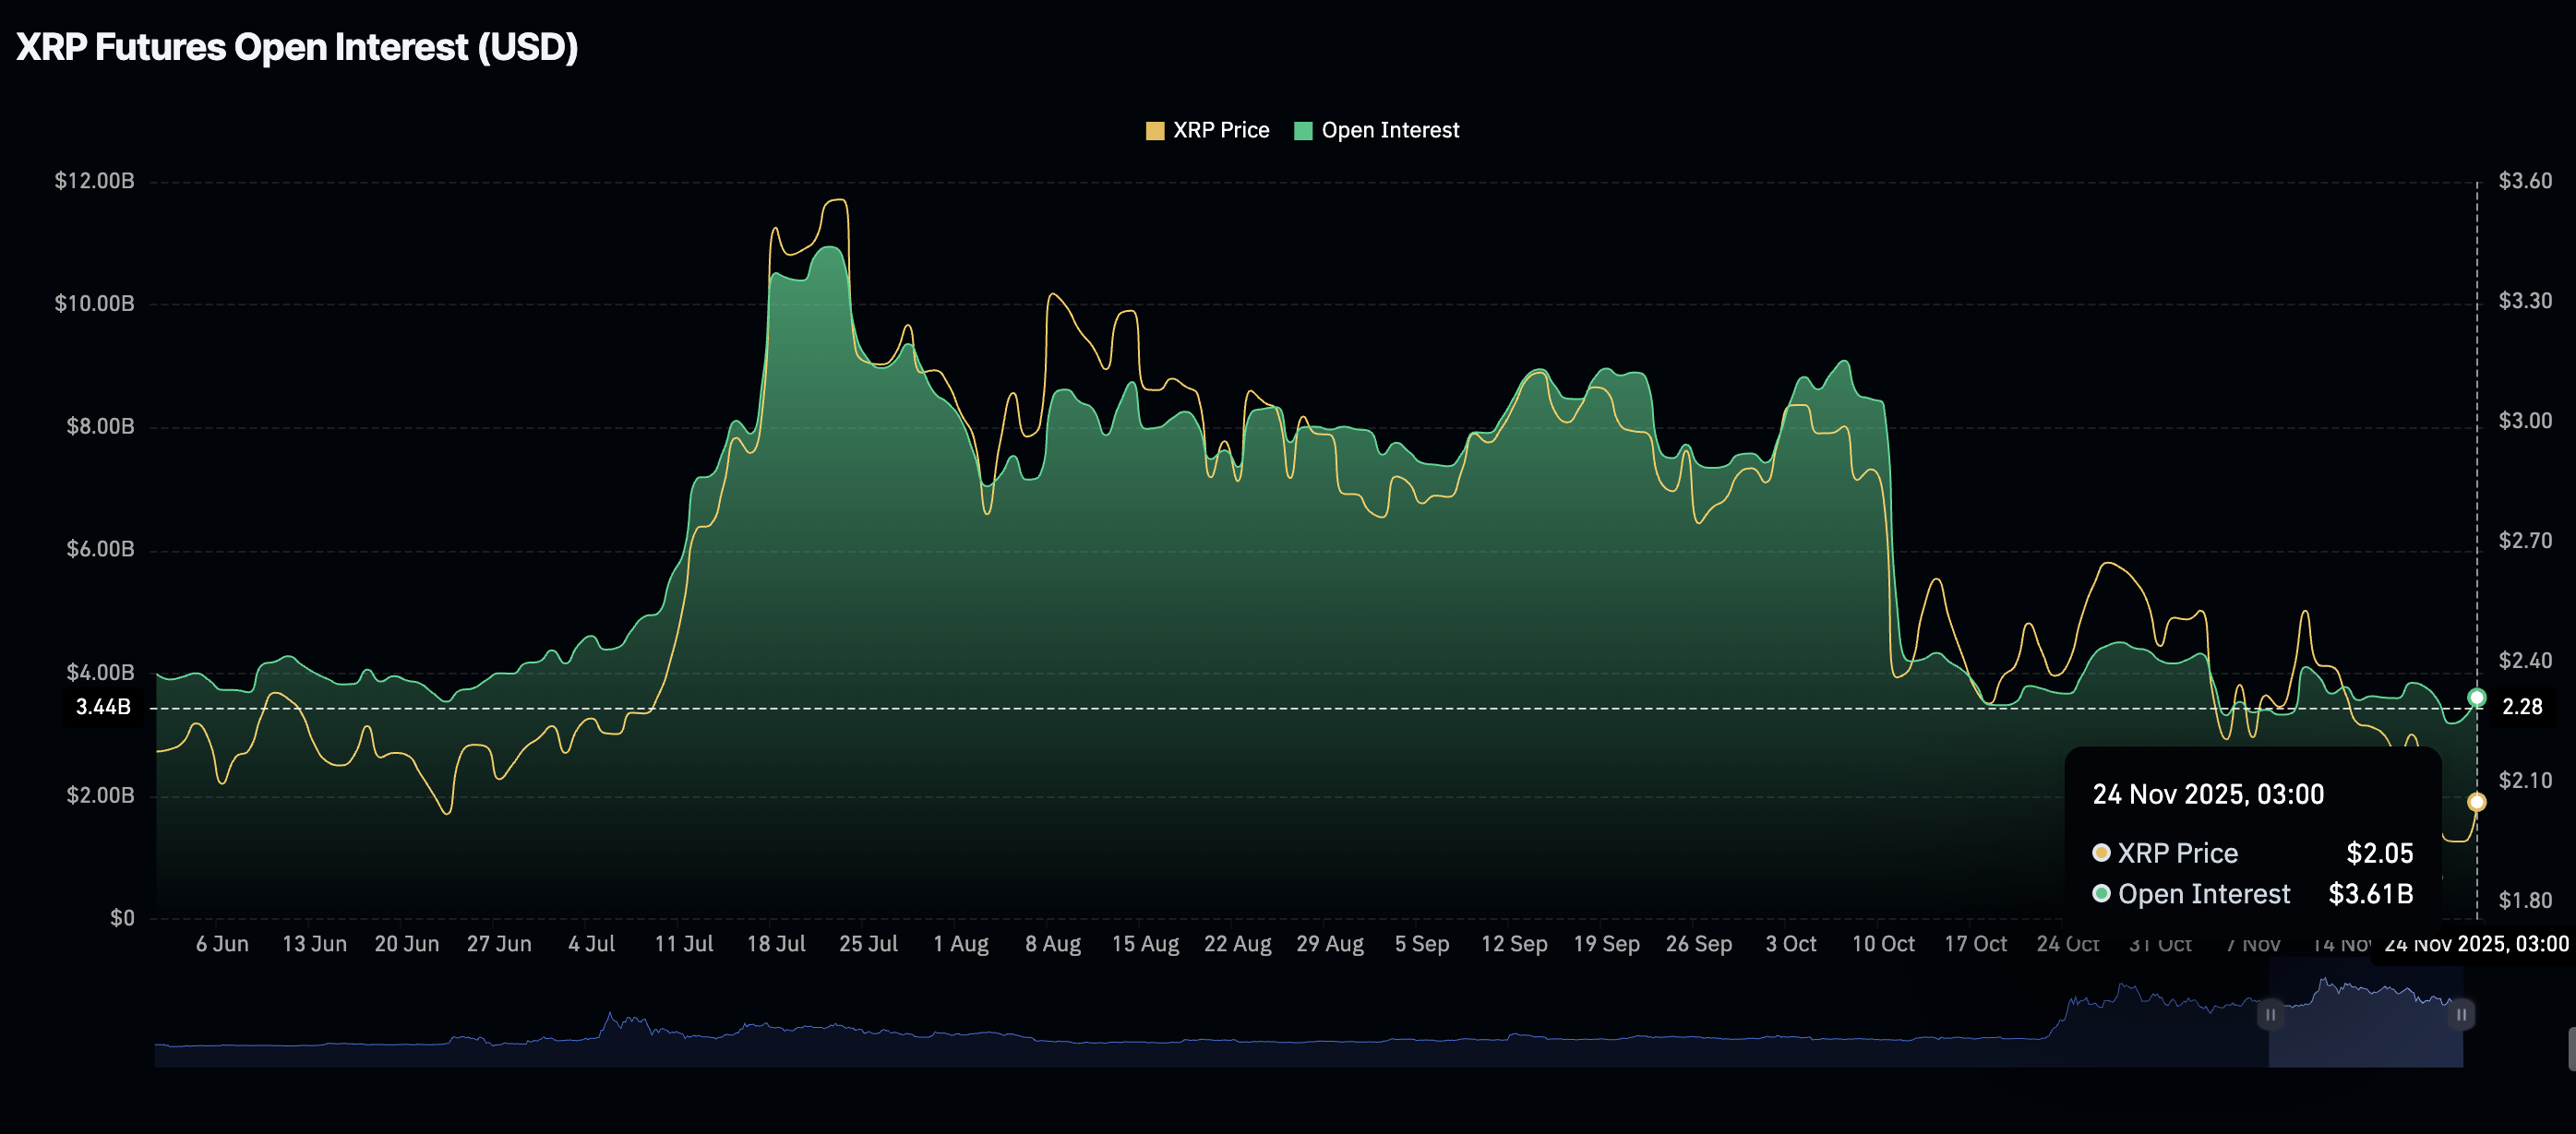
Chart of the day: Can Bitcoin sustain recovery despite weak technical structure?
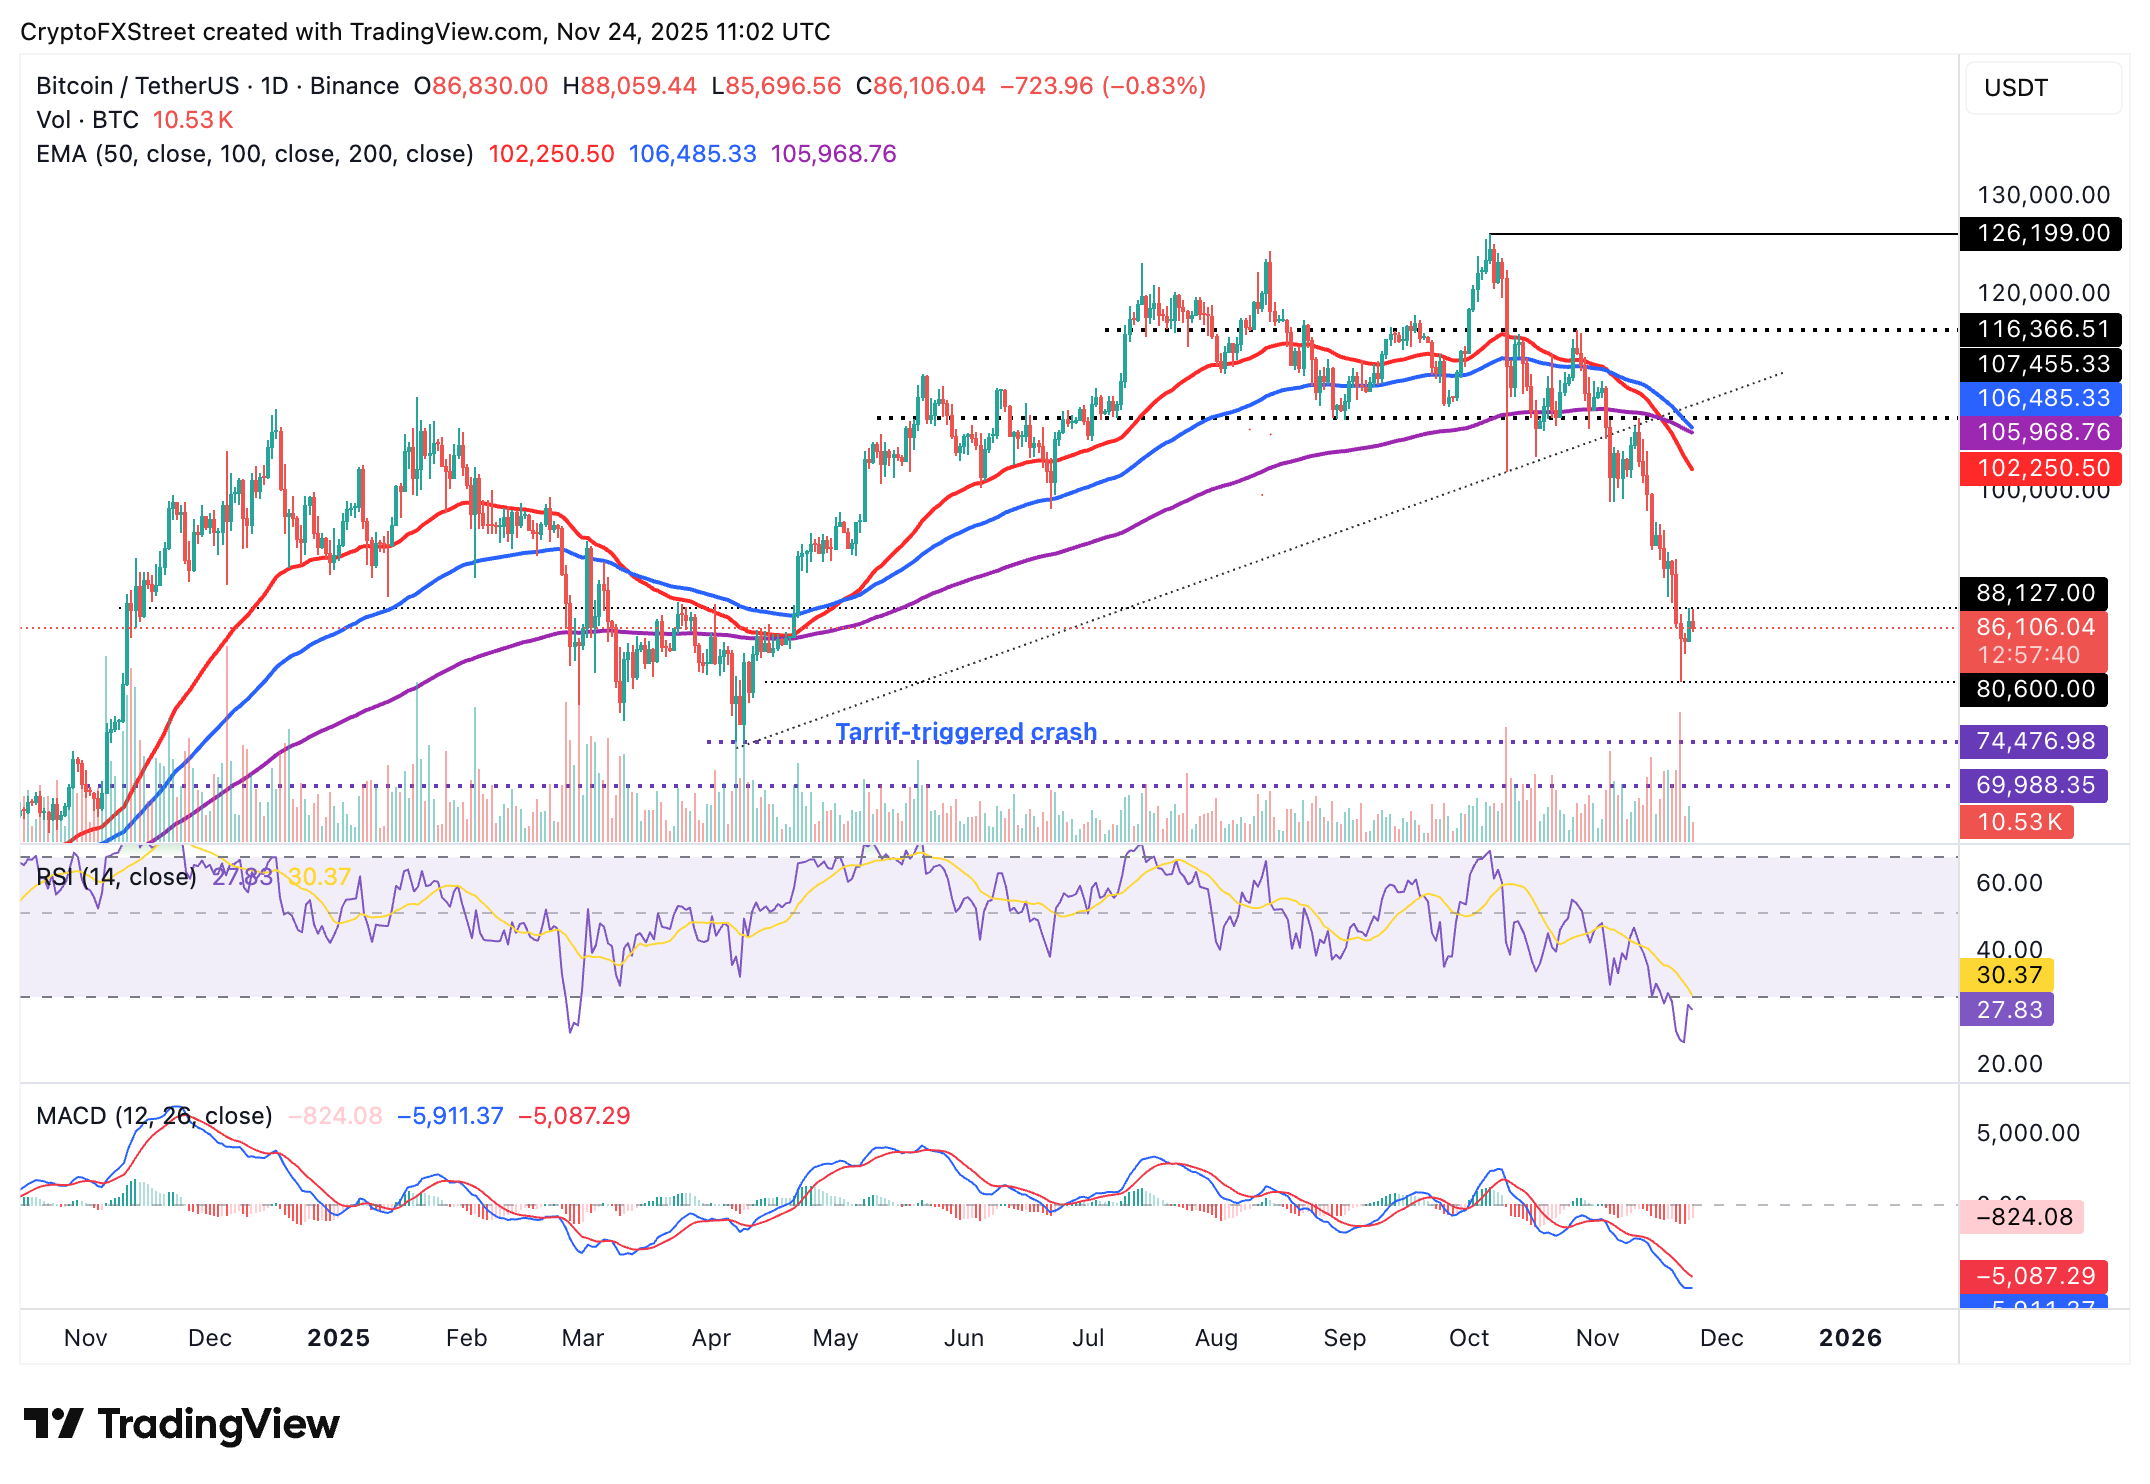
Bitcoin is trading marginally above $86,000 at the time of writing on Monday, following a knee-jerk reversal from a Friday low of $80,600.
The digital asset's position below key moving averages, including the 50-day Exponential Moving Average (EMA) at $102,250, the 200-day EMA at $105,968 and the 100-day EMA at $106,485, underpins the prevailing bearish outlook.
A sell signal from the Moving Average Convergence Divergence (MACD) indicator, maintained since November 3 on the daily chart, reinforces the bearish grip. The red histogram bars below the zero line indicate that bearish momentum is increasing.
The Relative Strength Index (RSI) on the same daily chart remains in the oversold region at 27. This RSI position shows weakness, which could accelerate the downtrend toward support at $80,600.
A break above $88,127, a resistance tested on Sunday, would affirm a short-term bullish outlook and increase the odds of a breakout above the $90,000 round-number hurdle.
Altcoins update: Ethereum, XRP battle volatility as recovery stalls
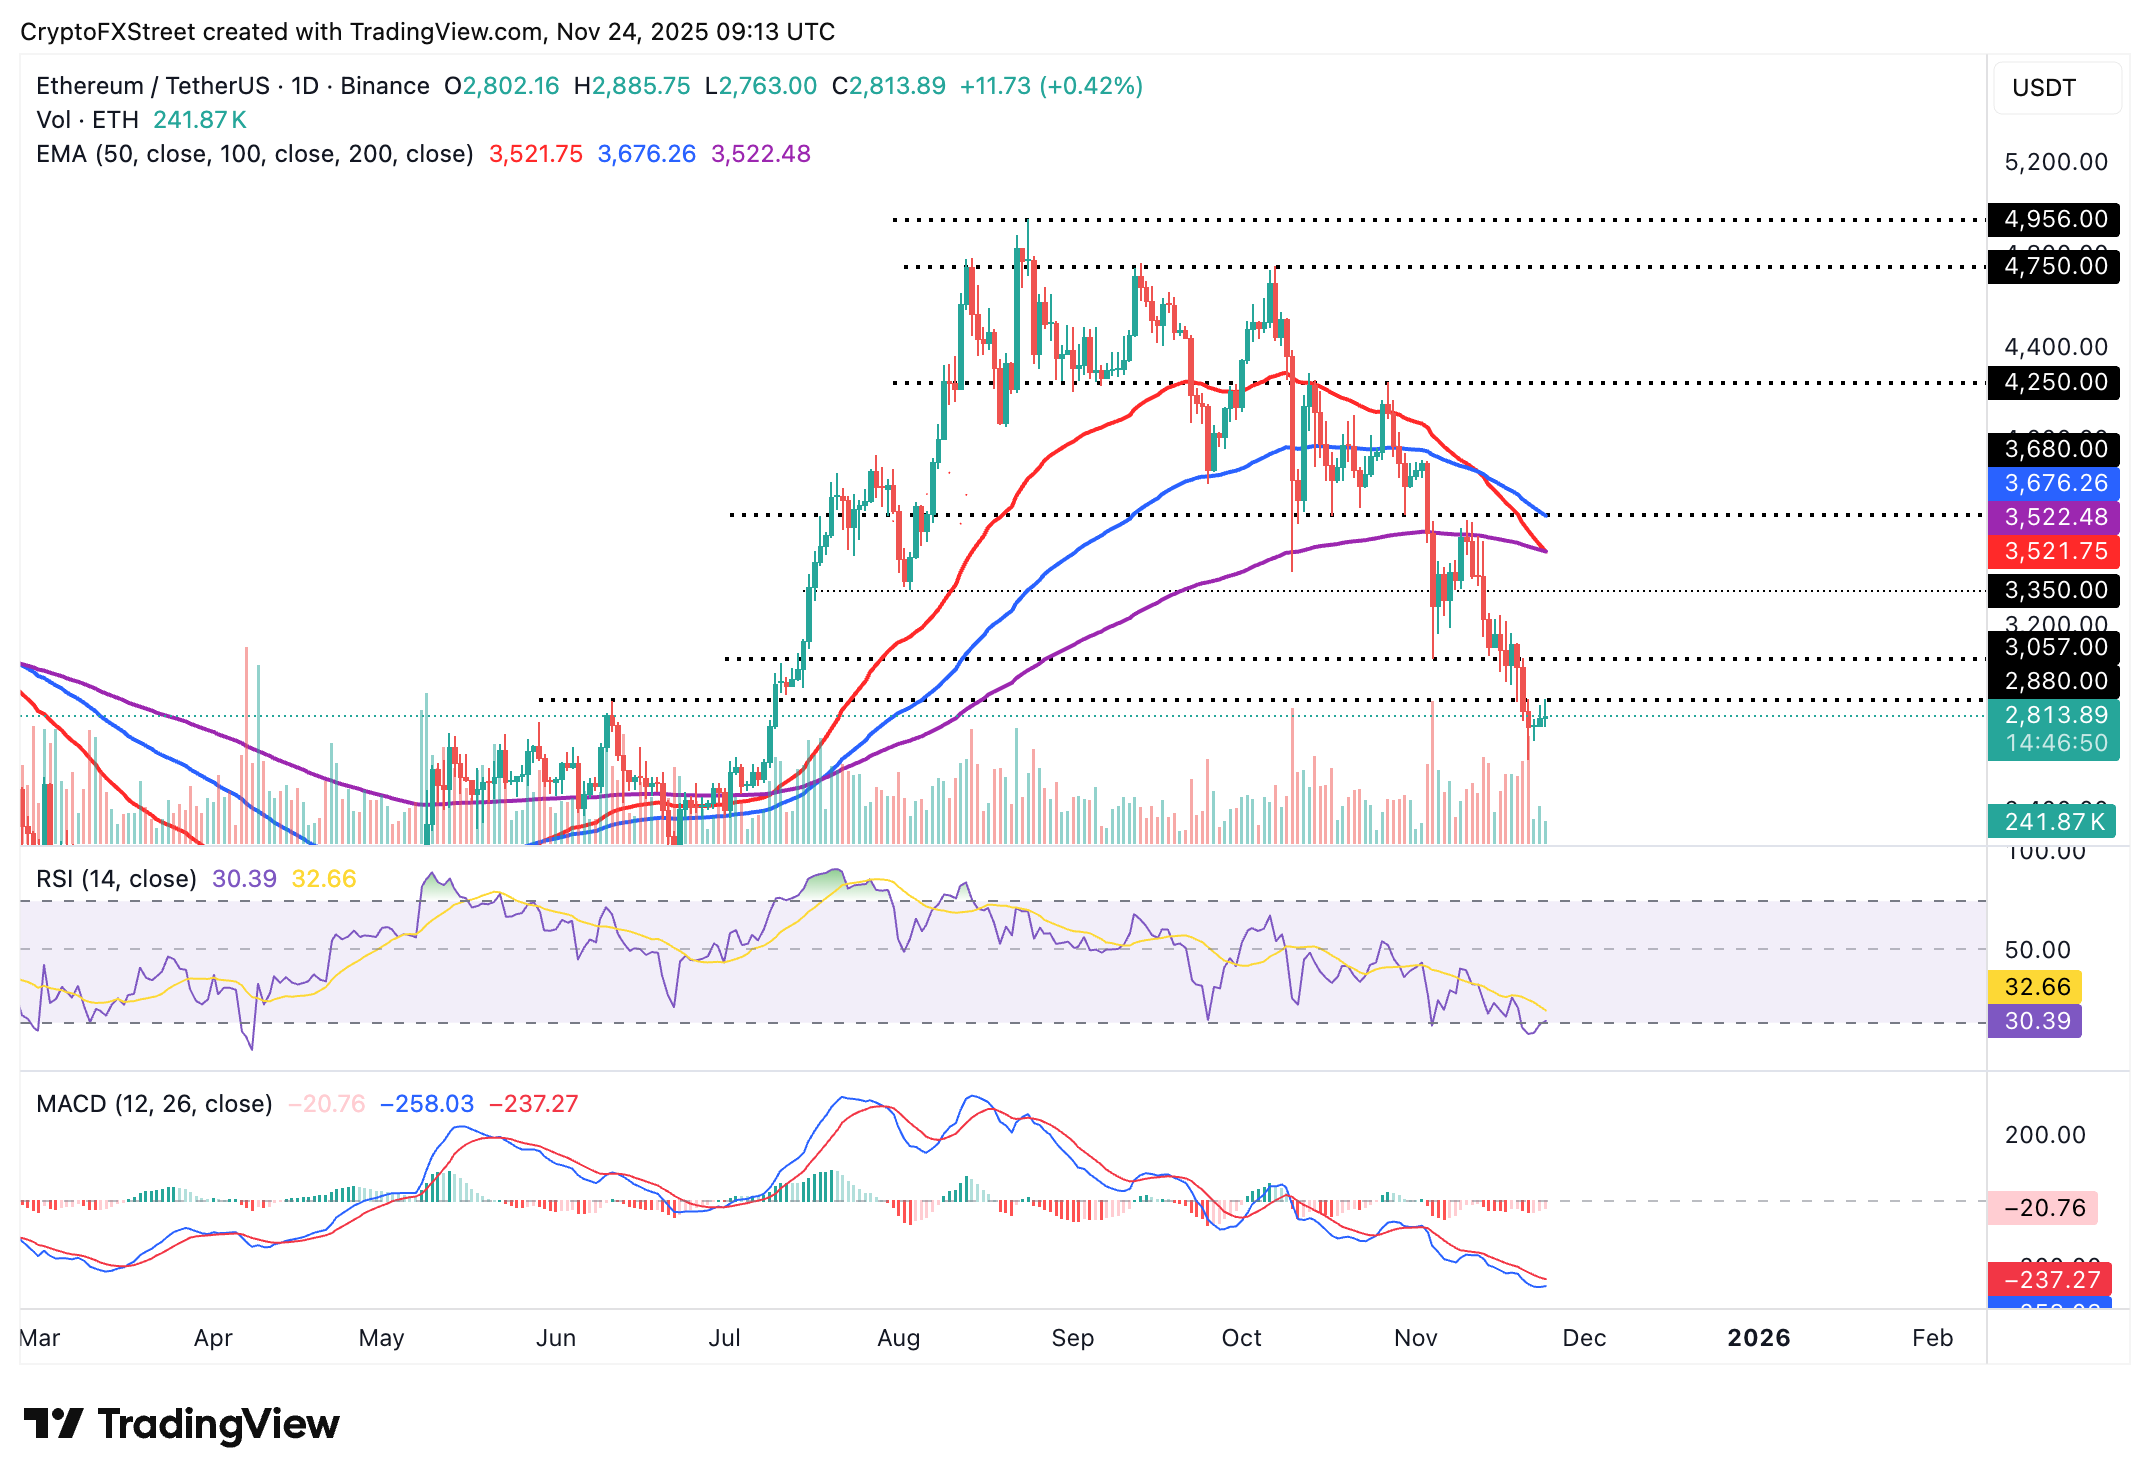
Ethereum is holding above $2,800 support at the time of writing on Monday. The smart contracts token hit an intraday high of $2,885 but retraced amid high volatility and potential profit-taking.
If the 50-day EMA crosses below the 200-day EMA, establishing a Death Cross pattern, the path of least resistance will remain downward, weighted down by bearish sentiment.
The MACD indicator has maintained a sell signal on the daily chart since November 3, encouraging investors to reduce their risk exposure. Meanwhile, the RSI remains stable at 30 within the same daily range, suggesting possible consolidation before the next breakout. A daily close below $2,800 would reinforce risk-off sentiment and increase the likelihood of an extended downtrend toward the round-number support at $2,500.
As for XRP, bulls are pushing to hold above the near-term $2.00 support, supported by an uptrending RSI on the daily chart. The RSI at 39 and rising indicates that bullish momentum is increasing, as traders position themselves, anticipating a steady upswing.
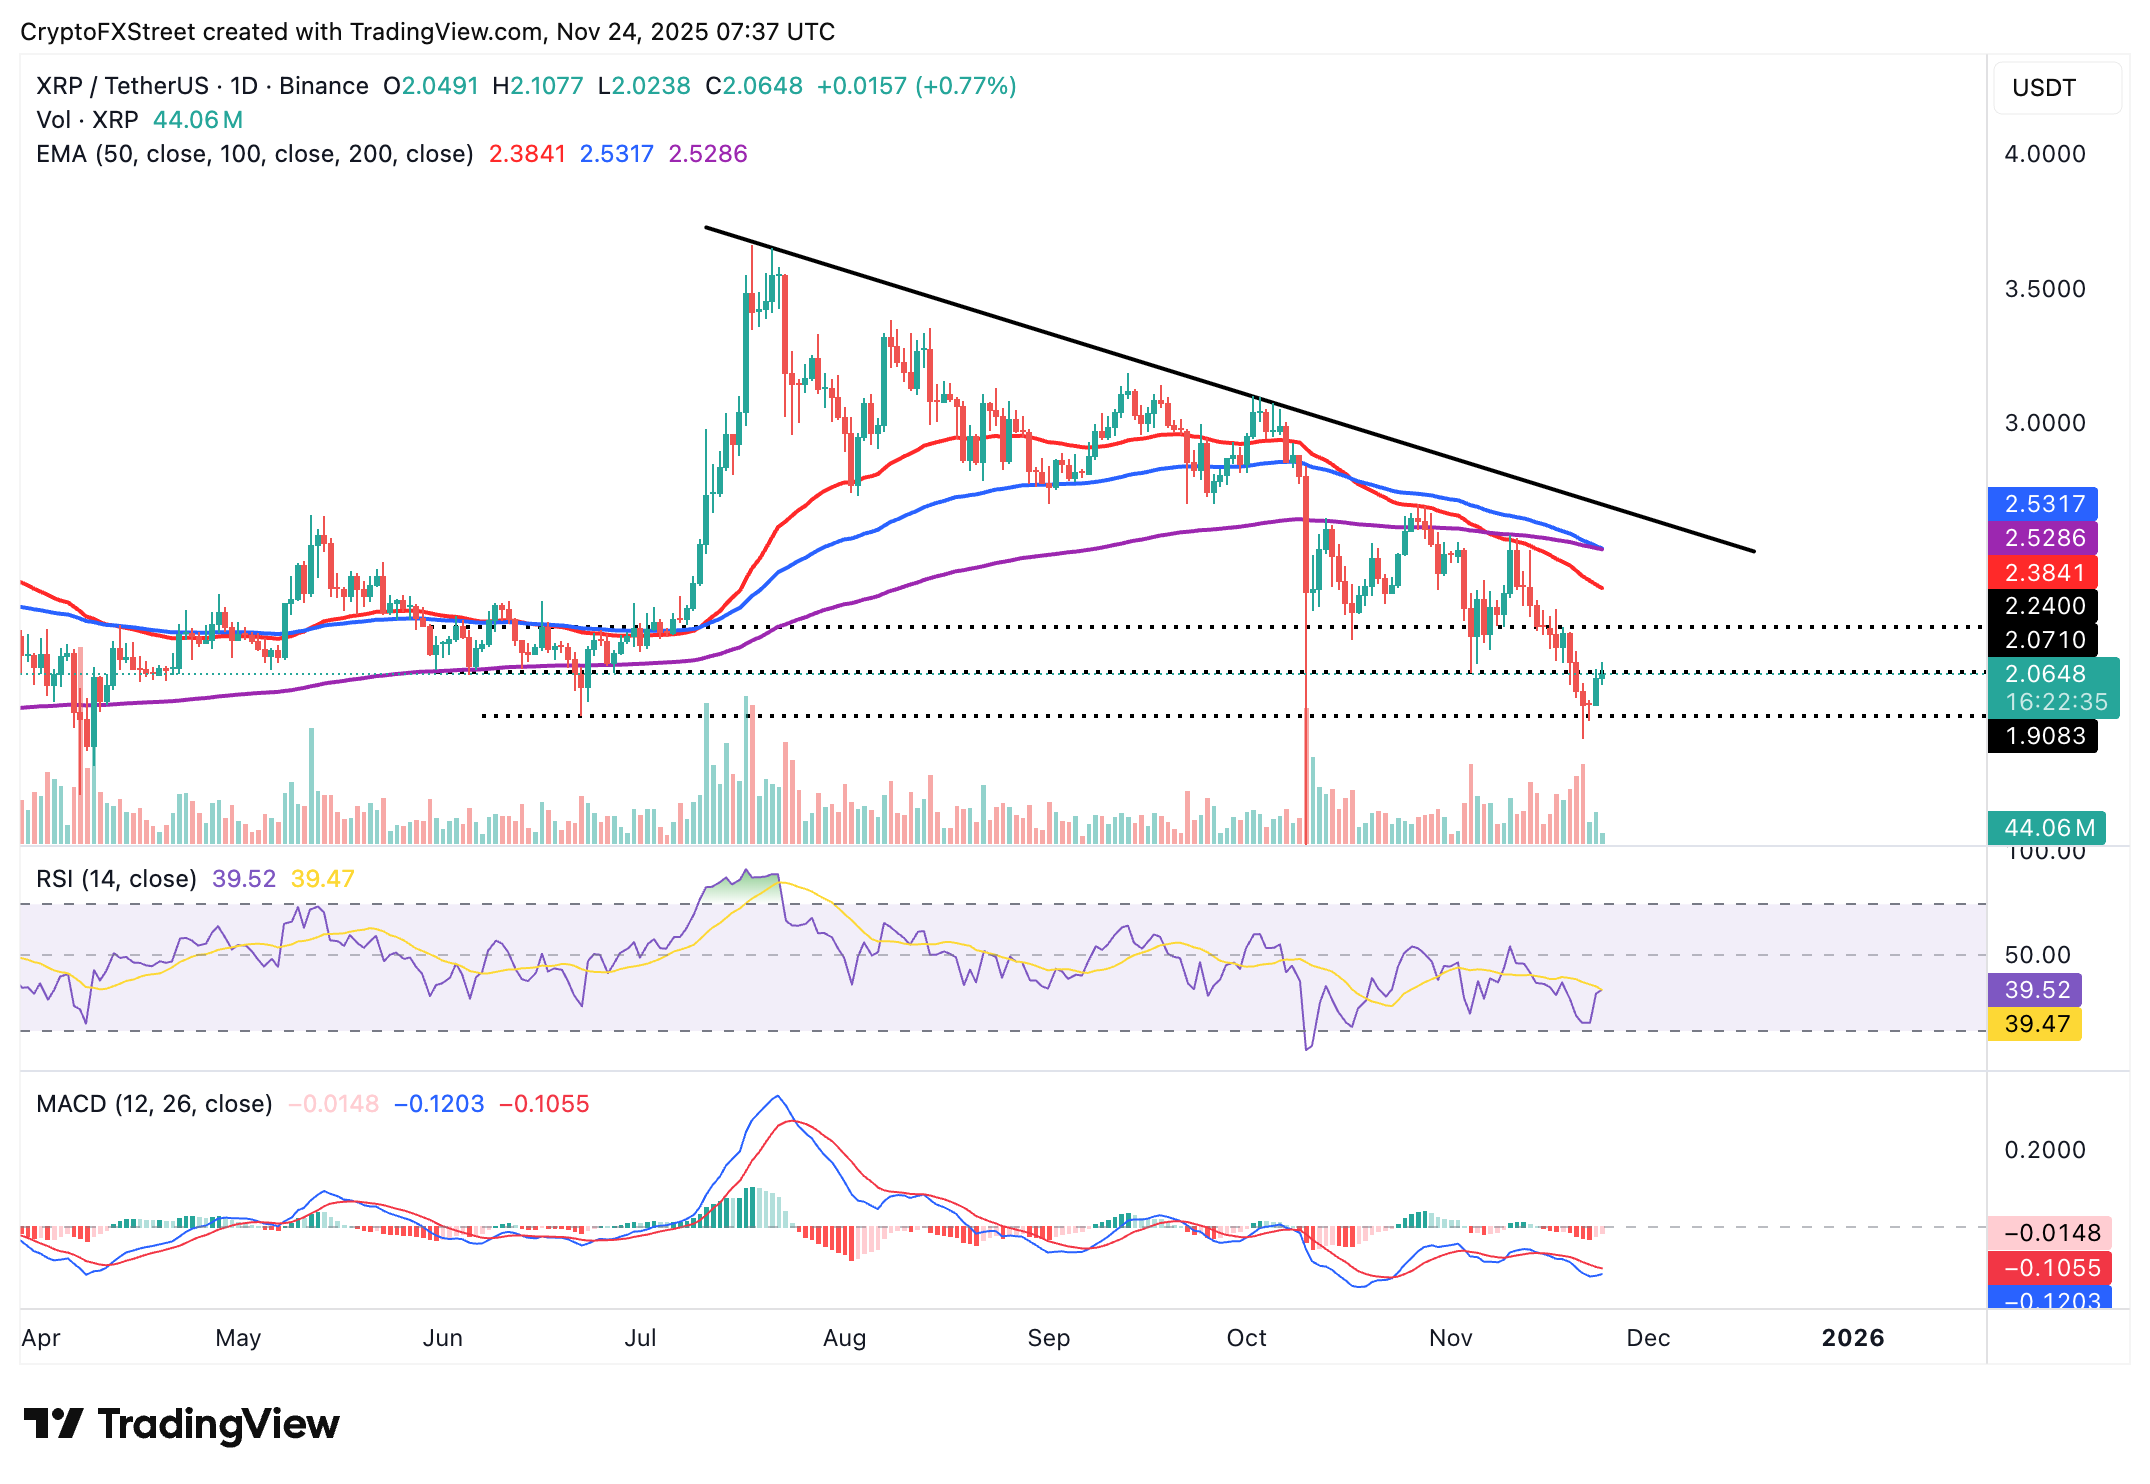
A daily close above $2.00 would back bullish sentiment and increase the chances of an extended uptrend above resistance at $2.24, which was tested on Tuesday. Further action above the same hurdle could pave the way for gains targeting the 50-day EMA at $2.38 and the 200-day EMA at $2.52.
Cryptocurrency prices FAQs
Token launches influence demand and adoption among market participants. Listings on crypto exchanges deepen the liquidity for an asset and add new participants to an asset’s network. This is typically bullish for a digital asset.
A hack is an event in which an attacker captures a large volume of the asset from a DeFi bridge or hot wallet of an exchange or any other crypto platform via exploits, bugs or other methods. The exploiter then transfers these tokens out of the exchange platforms to ultimately sell or swap the assets for other cryptocurrencies or stablecoins. Such events often involve an en masse panic triggering a sell-off in the affected assets.
Macroeconomic events like the US Federal Reserve’s decision on interest rates influence crypto assets mainly through the direct impact they have on the US Dollar. An increase in interest rate typically negatively influences Bitcoin and altcoin prices, and vice versa. If the US Dollar index declines, risk assets and associated leverage for trading gets cheaper, in turn driving crypto prices higher.
Halvings are typically considered bullish events as they slash the block reward in half for miners, constricting the supply of the asset. At consistent demand if the supply reduces, the asset’s price climbs.

FXStreet
超過一百萬用戶依賴 FXStreet 獲取即時市場數據、圖表工具、專家洞見與外匯新聞。其全面的經濟日曆與教育網路研討會協助交易者保持資訊領先、做出審慎決策。FXStreet 擁有約 60 人的團隊,分布於巴塞隆納總部及全球各地。
Read More


