
Trade The World
Crypto Today: Bitcoin renews bid for $118,000, Ethereum and XRP show recovery signs
作者 John Isige
發布日期: 5 Sep 2025 | 修改日期: 5 Sep 2025


POPULAR ARTICLES

Cryptocurrency prices are showing signs of recovery on Friday, led by Bitcoin (BTC), which has reclaimed support above $112,000. Altcoins, including Ethereum (ETH) and Ripple (XRP), are edging higher, reflecting easing selling pressure.
- Bitcoin rises above $112,500, reflecting easing selling pressure among long-term holders.
- Ethereum rebounds from ascending trendline support, targeting record highs toward $5,000.
- XRP extends sideways trading between the 50-day EMA and the 100-day EMA amid cooling Open Interest.
Cryptocurrency prices are showing signs of recovery on Friday, led by Bitcoin (BTC), which has reclaimed support above $112,000. Altcoins, including Ethereum (ETH) and Ripple (XRP), are edging higher, reflecting easing selling pressure.
Data spotlight: Bitcoin rebounds amid easing selling pressure
Bitcoin, having reached its record high of $124,474, has since encountered intense volatility, triggered by macroeconomic uncertainty and profit-taking, especially from long-term holders. The risk-off sentiment spread to the derivatives market, which saw significant cooling. Bitcoin’s Open Interest (OI) averages at $79.21 billion at the time of writing after peaking at $88 billion on July 15.
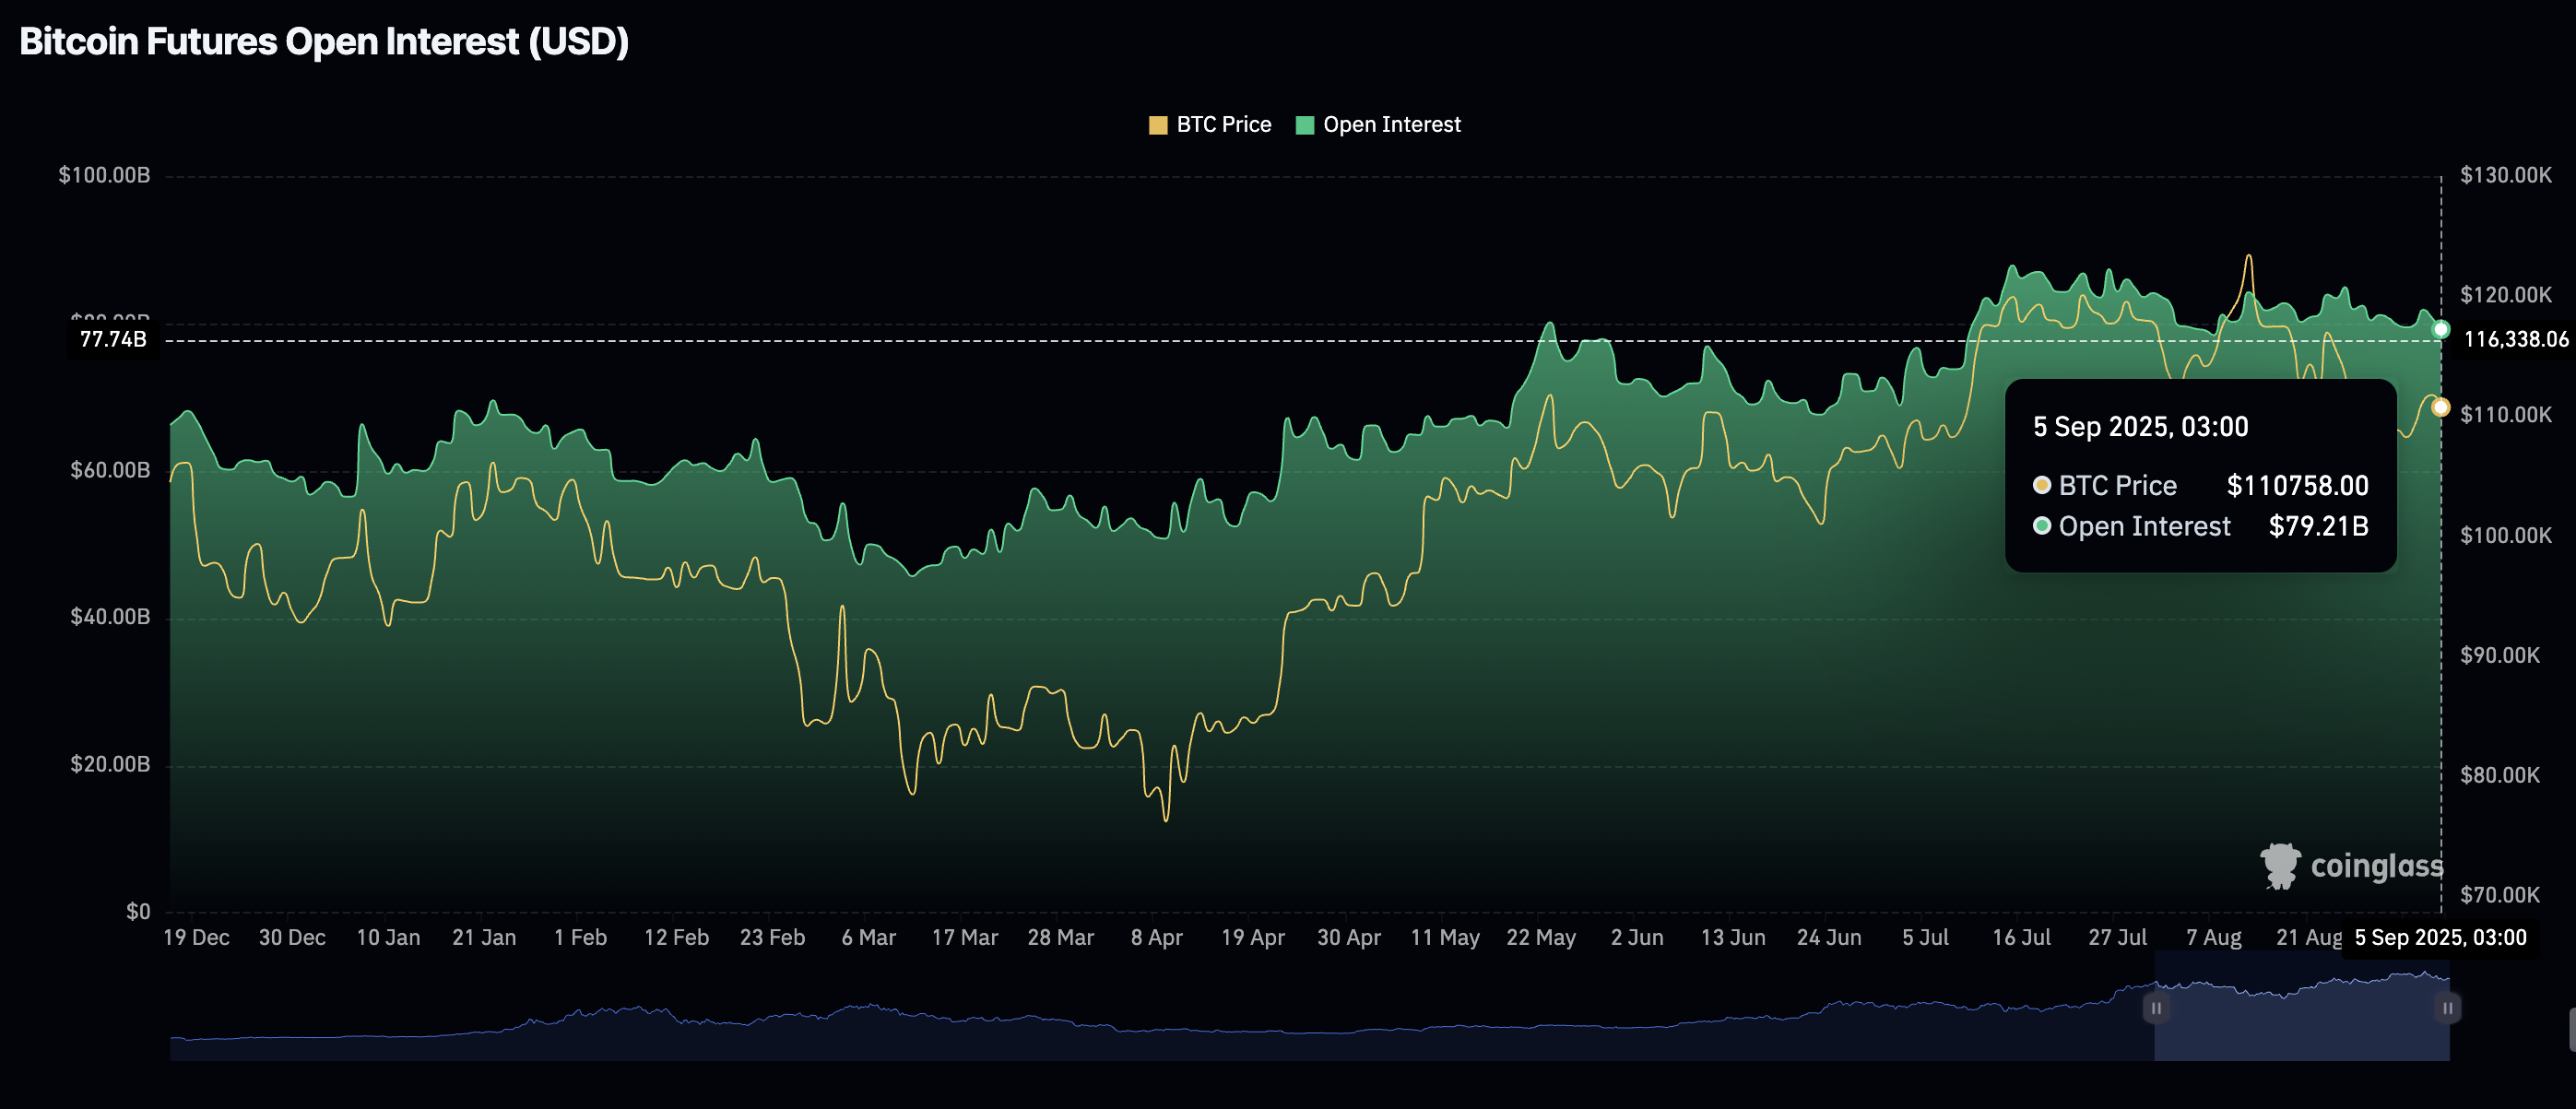
Bitcoin Open Interest | Source: CoinGlass
The current uptick in price mirrors easing selling pressure, especially among long-term holders. CryptoQuant highlights noticeable flows from dormant Bitcoin wallets that characterised the selling pressure over the past few weeks.
“This cycle has once again confirmed that long-term holders, or even dormant BTC, continue to represent a powerful selling pressure, still capable of shaking the market,” Darkfost, an analyst, highlighted on the CryptoQuant insights page.
According to the Value Days Destroyed (VDD) chart below, which accounts for the holding time of BTC before it is moved, long-term holder selling activities have slowed, setting the stage for a sustainable rebound.
After the VDD rose to a significant level of 2.4, which is considered a critical threshold, it began to decline and is currently approaching levels similar to those in previous corrections.
“If this selling pressure keeps easing, it will certainly provide relief to the market and may allow for a renewed move higher, provided demand steps in,” the analyst added.
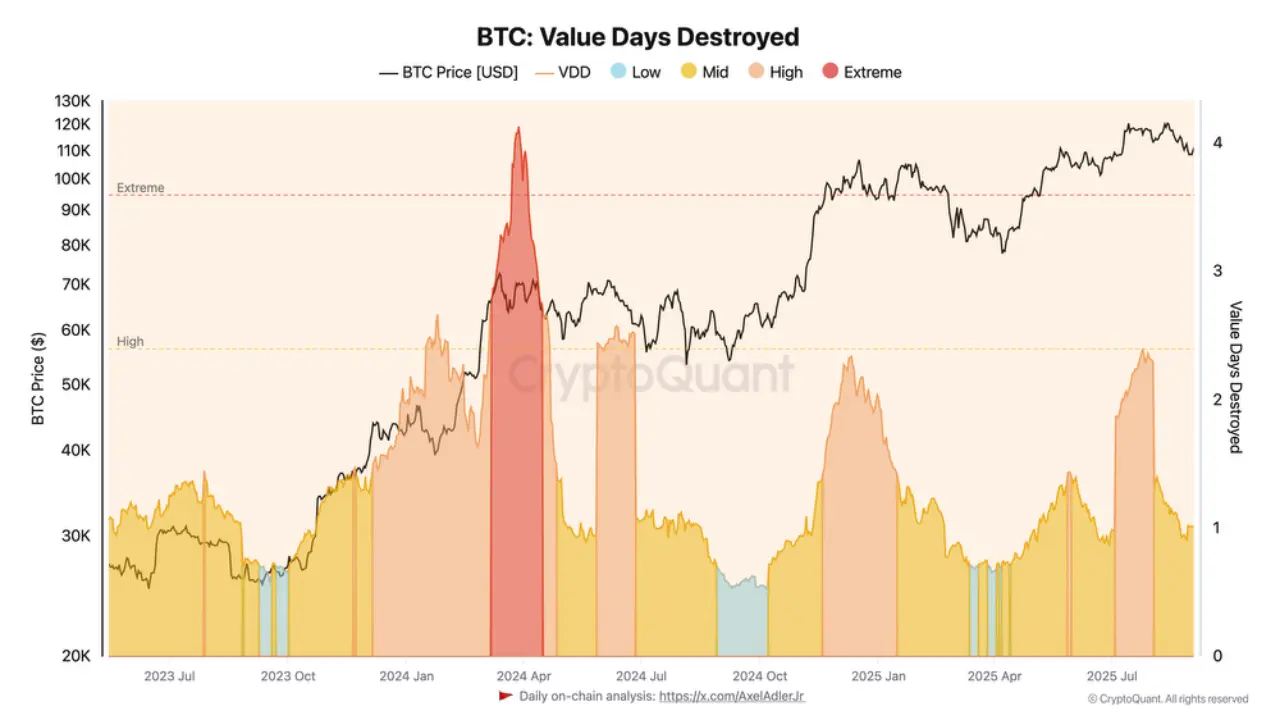
Bitcoin VDD chart | Source: CryptoQuant
Chart of the day: Bitcoin bulls regain control
Bitcoin price edges higher on Friday following a brief correction below $110,000 the previous day. The 100-day Exponential Moving Average (EMA) at $110,765 provides immediate resistance. However, price action is currently capped below the 50-day EMA at $113,236.
Based on the Moving Average Convergence Divergence (MACD) indicator on the daily chart, risk-on sentiment is gradually returning, buoyed by a buy signal confirmed earlier in the day. If demand steadies, the path of least resistance would remain upward, increasing the chances of Bitcoin price rising to close the gap toward the $118,000 round-number demand zone.
The Relative Strength Index (RSI) at 49 on the same chart backs the bullish outlook, reflecting increasing buying pressure. A sustained breakout above the midline, along with the subsequent movement toward overbought territory, implies a strong bullish grip.
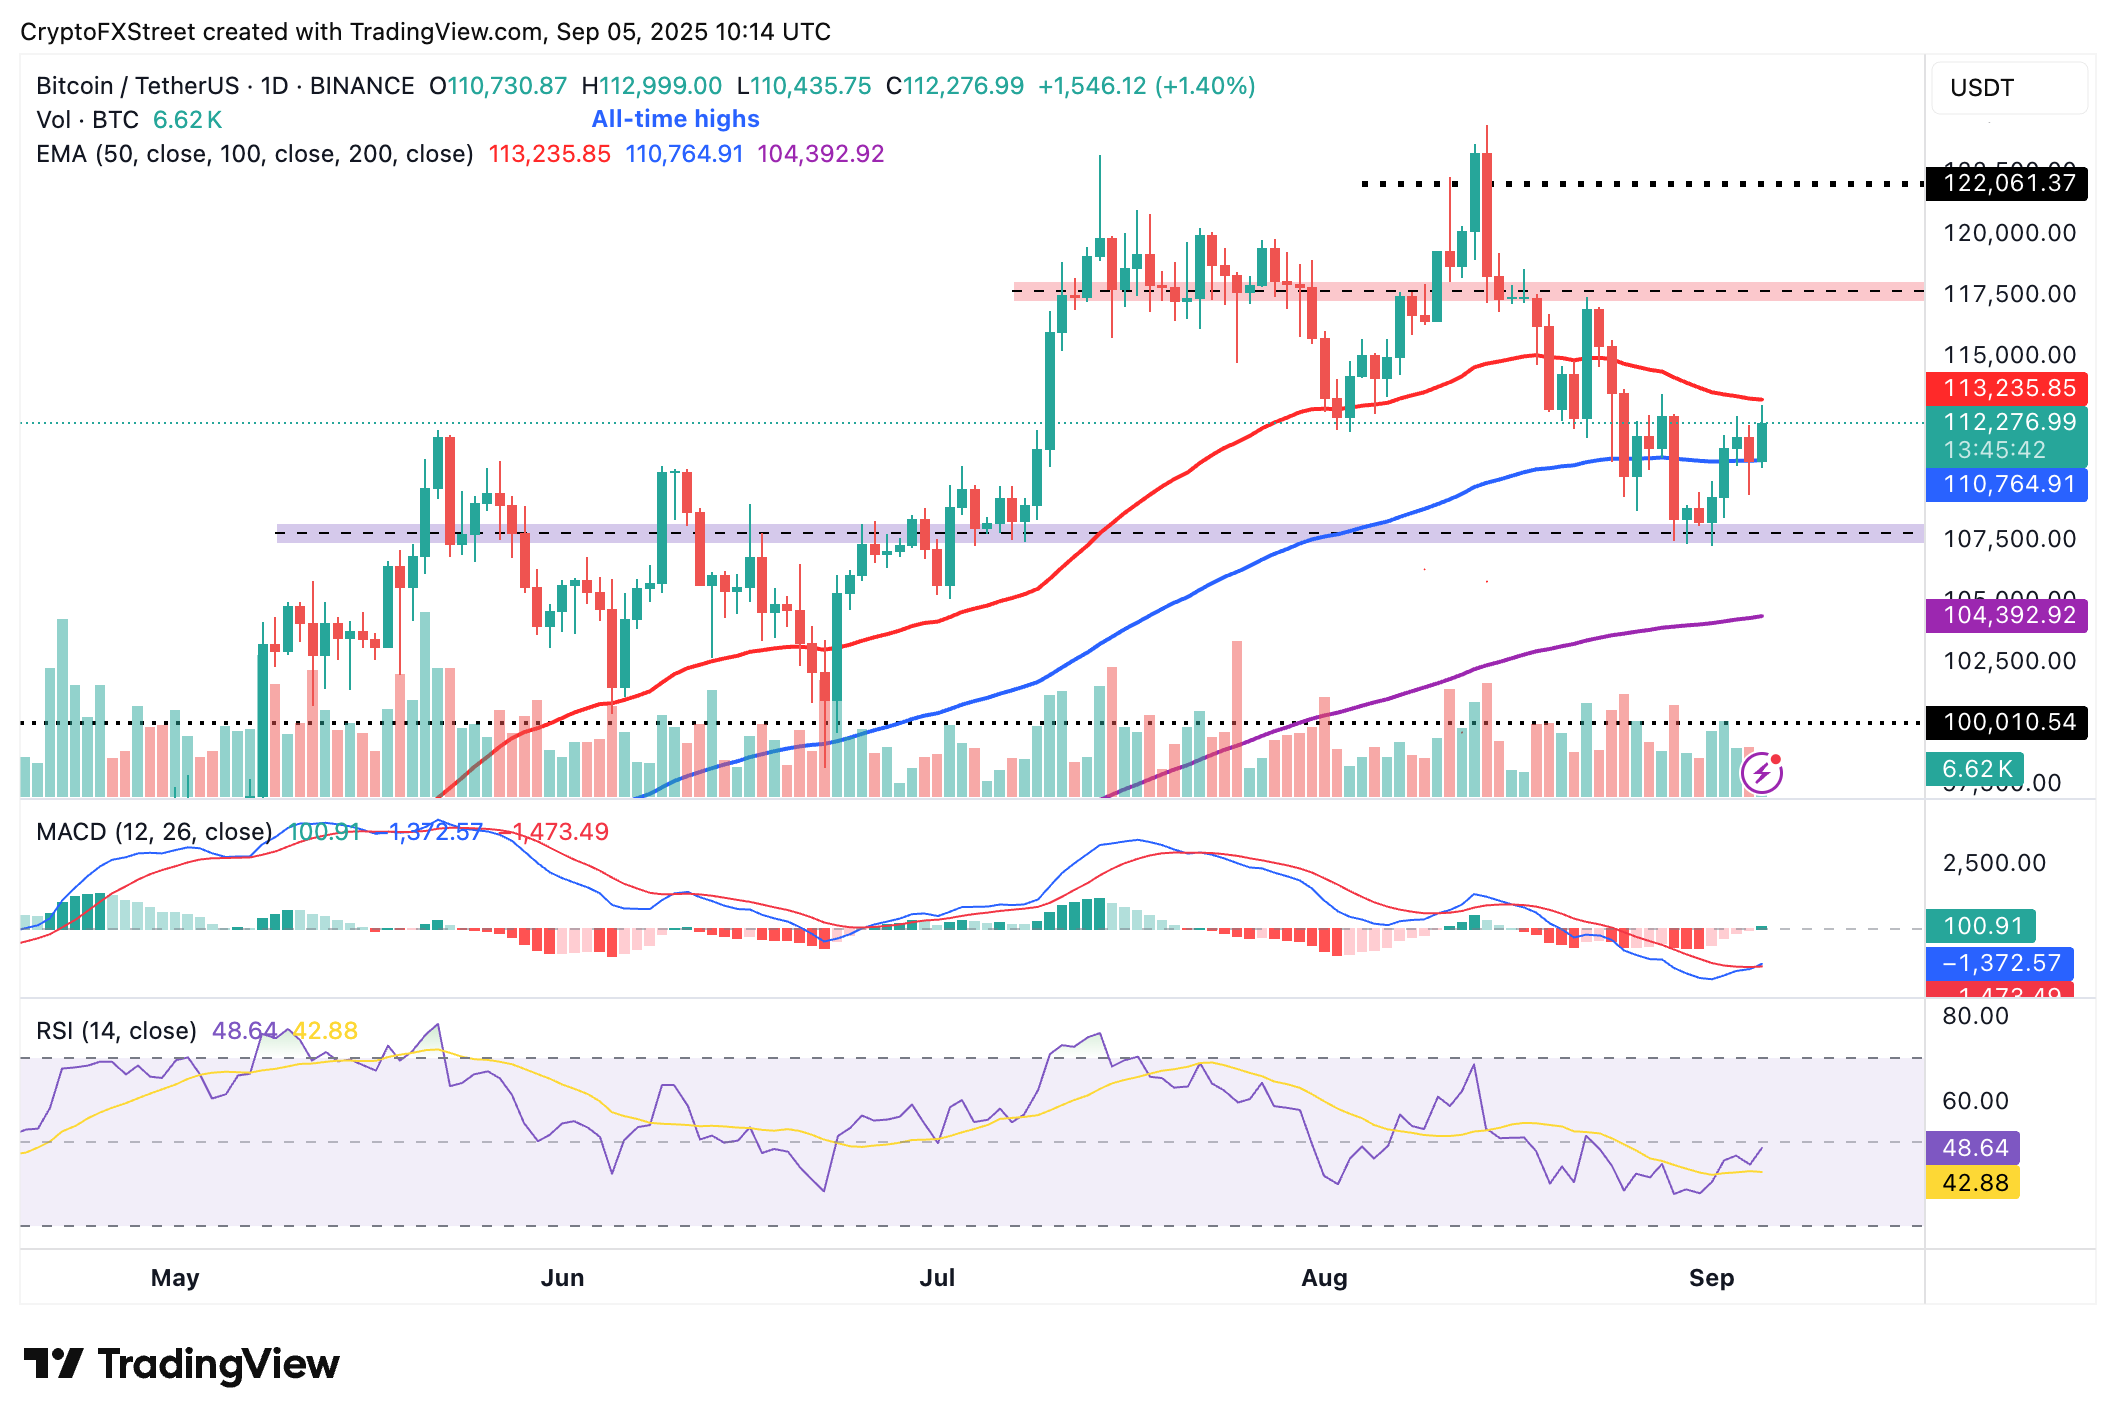
BTC/USDT daily chart
Still, traders must exercise caution ahead of the United States (US) Federal Reserve (Fed) September interest rate decision. As key economic data is released over the next week, it will become clearer what the Fed’s monetary policy direction is. In the event of a reversal below the 100-day EMA support at $110,765, risk-off sentiment could drive BTC below the support at around $107,255, which was tested on Monday and the 200-day EMA at $104,392.
Altcoins update: Ethereum, XRP edge higher
Ethereum price holds above $4,400 at the time of writing, following a rebound from an ascending trendline on the daily chart. The RSI, currently at 52, supports the short-term bullish outlook. Higher RSI readings, approaching overbought territory, indicate growing demand from retail investors.
Key areas of interest for traders include ETH’s record high of $4,956 reached on August 24 and the psychological $5,000 level. Still, the 50-day EMA at $4,053 and the 100-day EMA at $3,580 could provide support in the event of aggressive selling.
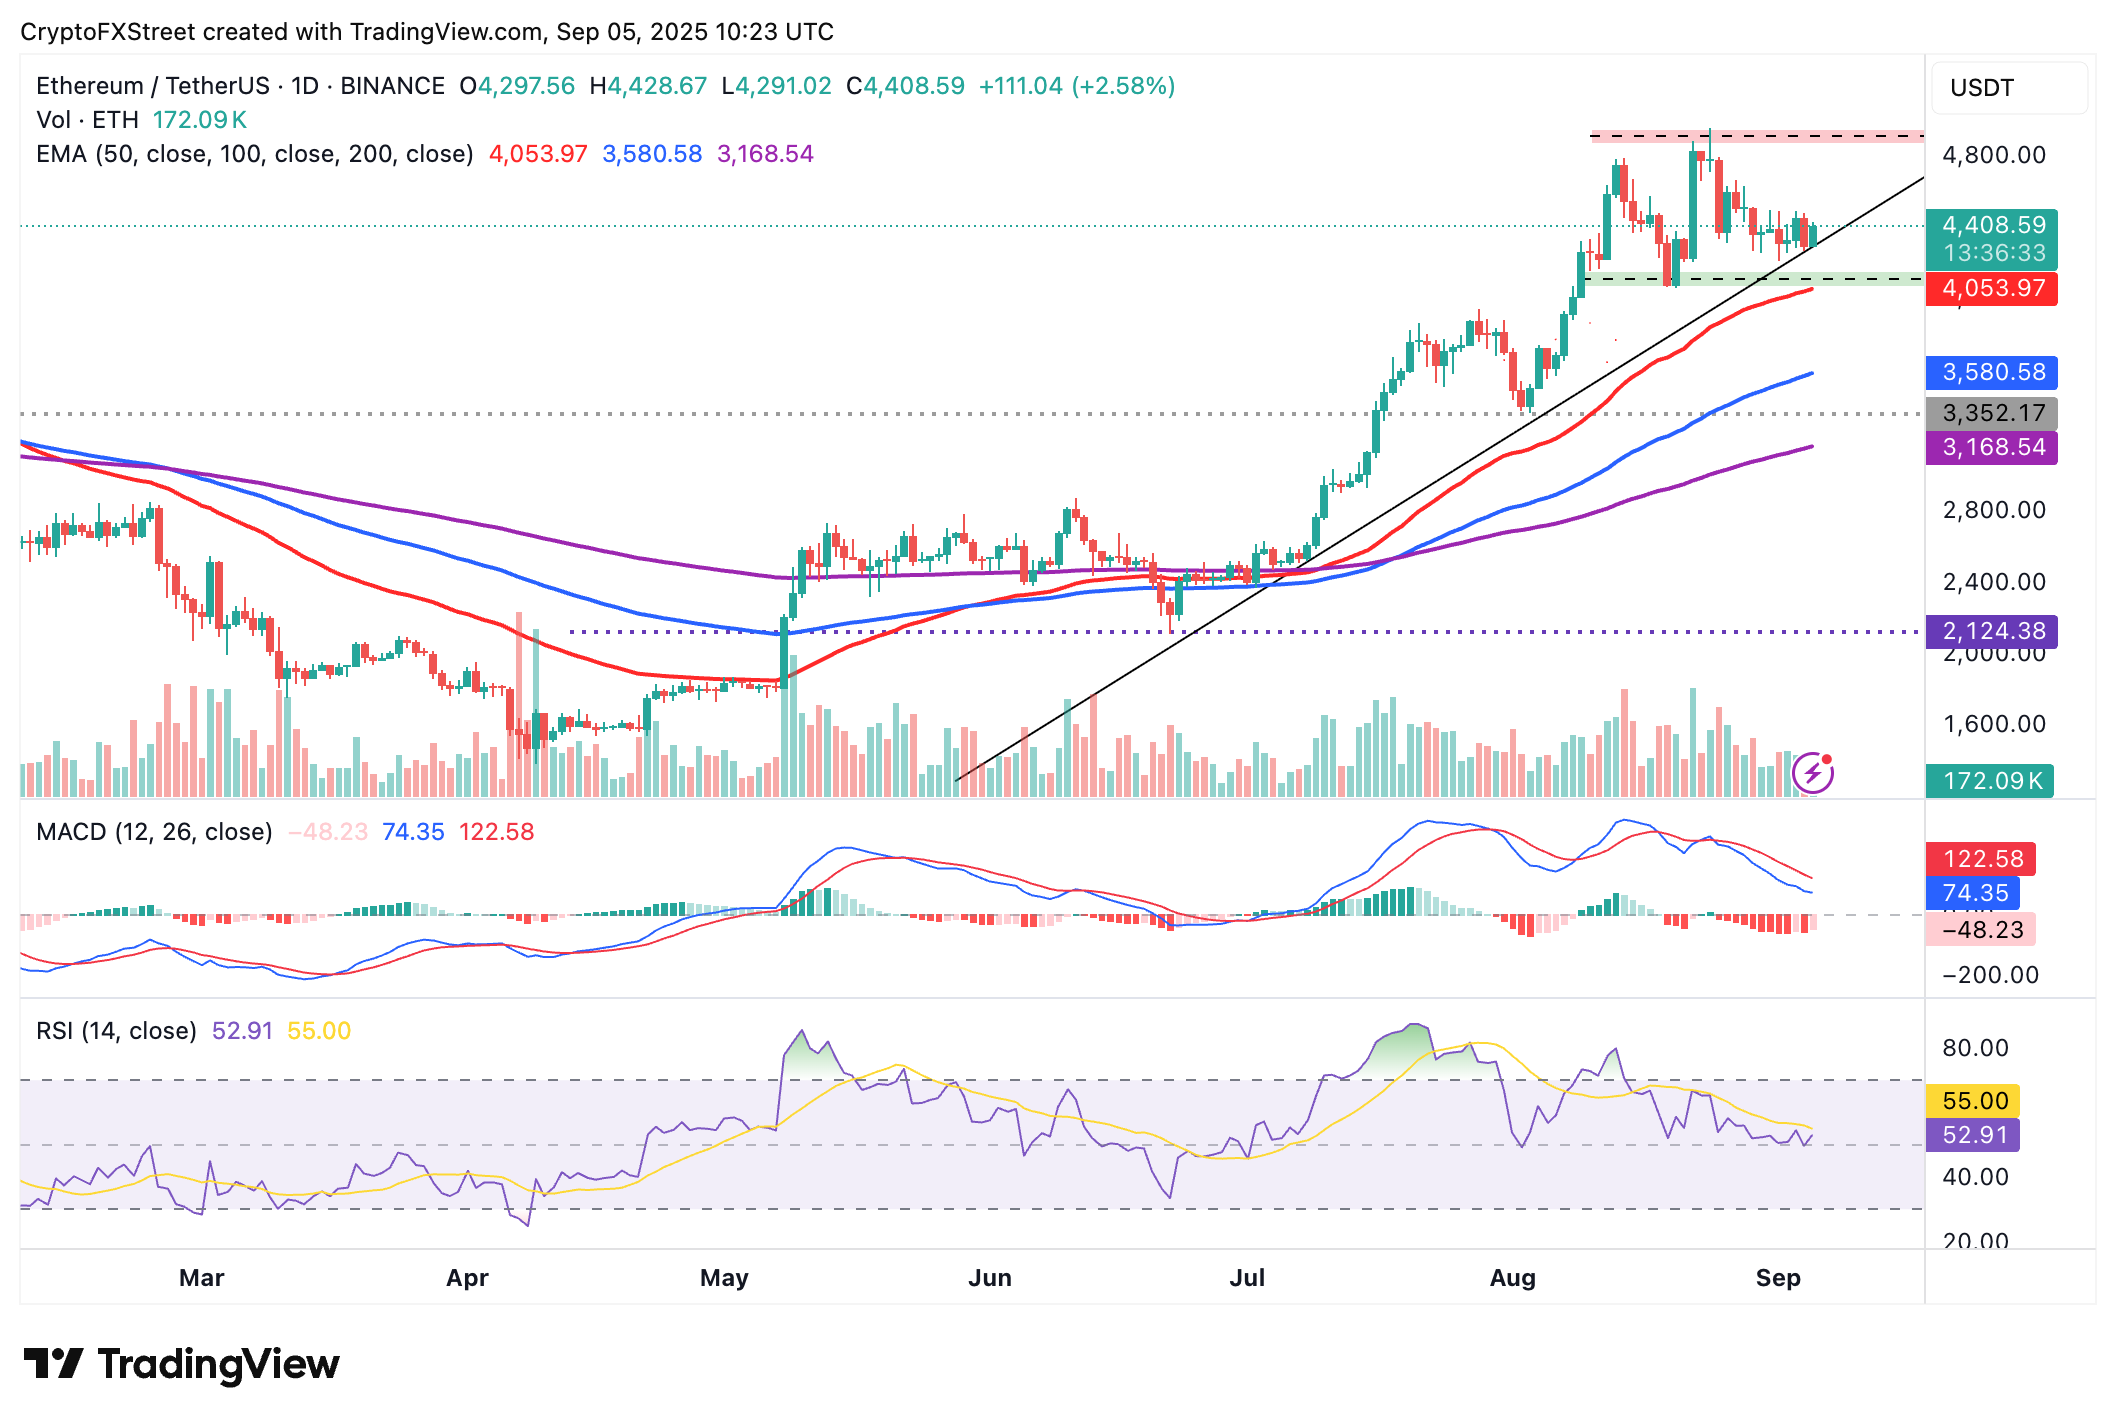
ETH/USDT daily chart
As for XRP, its current position between the 100-day EMA support at $2.77 and the 50-day EMA resistance at $2.91 points to a prolonged consolidation period ahead of the next breakout. A sell signal from the MACD indicator since July 25 hints at the downtrend continuing toward the 200-day EMA support at $2.52.
Traders should look out for a potential buy signal, which will manifest with the blue MACD line crossing above the red signal line. Stability in the broader crypto market and a favorable Fed monetary policy could boost risk-on sentiment, paving the way for a breakout above the $3.00 level and later the all-time high of $3.66.
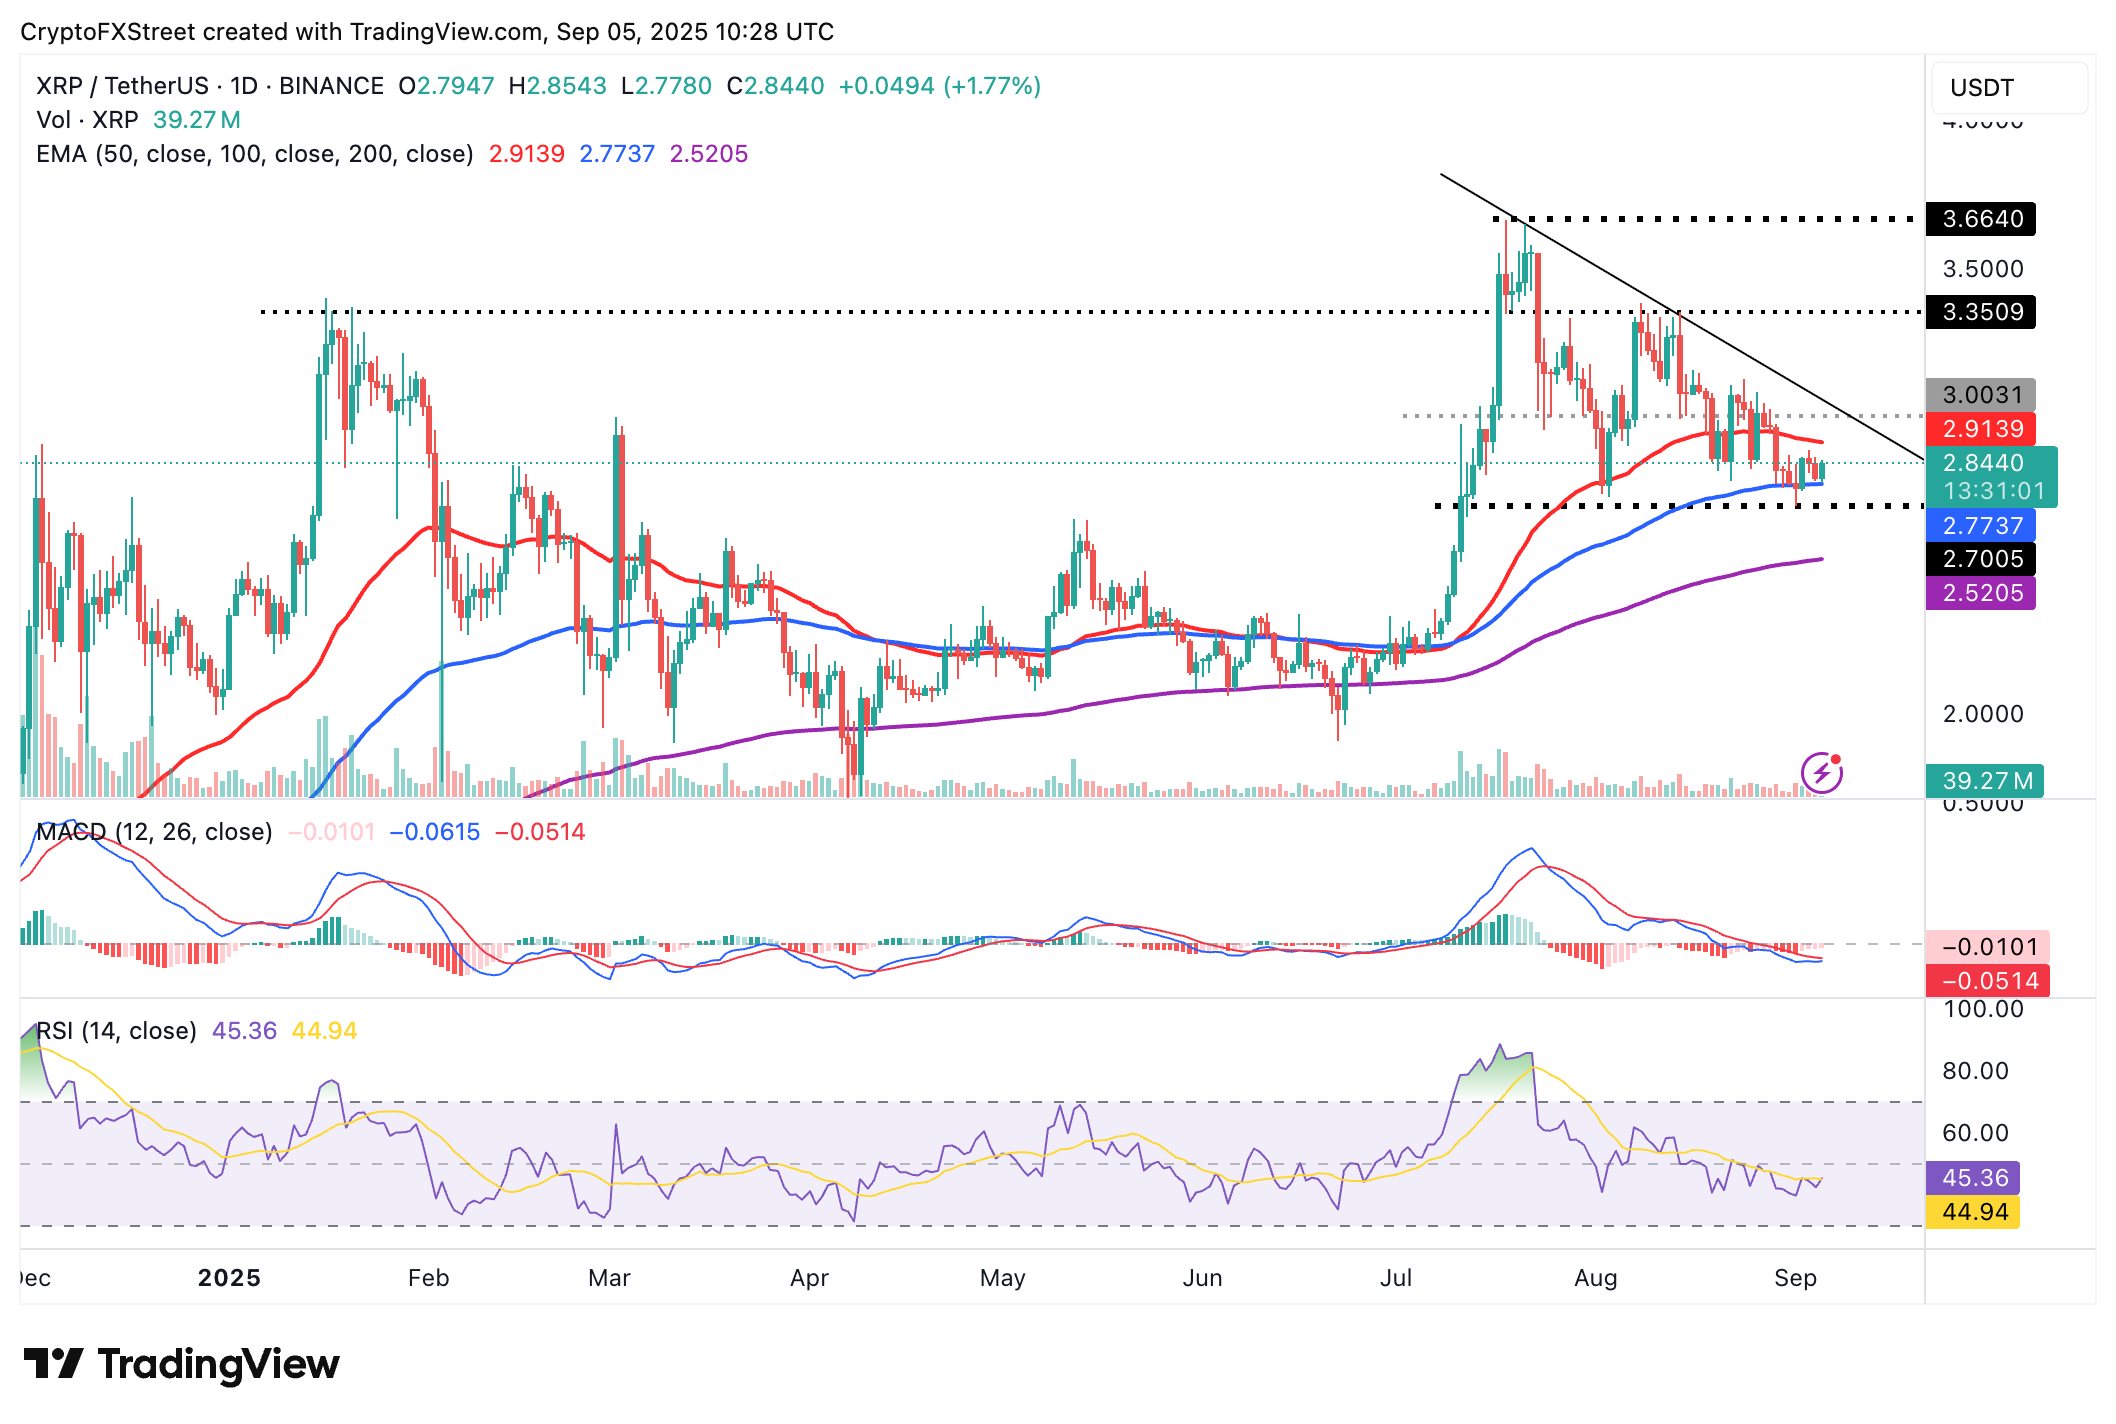
XRP/USDT daily chart
The RSI uptrend at 45 reflects growing demand for XRP. If the RSI rises above the midline, buying pressure will surge, increasing the chances of XRP reclaiming the $3.00 support level in the short term.
Bitcoin, altcoins, stablecoins FAQs
Bitcoin is the largest cryptocurrency by market capitalization, a virtual currency designed to serve as money. This form of payment cannot be controlled by any one person, group, or entity, which eliminates the need for third-party participation during financial transactions.
Altcoins are any cryptocurrency apart from Bitcoin, but some also regard Ethereum as a non-altcoin because it is from these two cryptocurrencies that forking happens. If this is true, then Litecoin is the first altcoin, forked from the Bitcoin protocol and, therefore, an “improved” version of it.
Stablecoins are cryptocurrencies designed to have a stable price, with their value backed by a reserve of the asset it represents. To achieve this, the value of any one stablecoin is pegged to a commodity or financial instrument, such as the US Dollar (USD), with its supply regulated by an algorithm or demand. The main goal of stablecoins is to provide an on/off-ramp for investors willing to trade and invest in cryptocurrencies. Stablecoins also allow investors to store value since cryptocurrencies, in general, are subject to volatility.
Bitcoin dominance is the ratio of Bitcoin's market capitalization to the total market capitalization of all cryptocurrencies combined. It provides a clear picture of Bitcoin’s interest among investors. A high BTC dominance typically happens before and during a bull run, in which investors resort to investing in relatively stable and high market capitalization cryptocurrency like Bitcoin. A drop in BTC dominance usually means that investors are moving their capital and/or profits to altcoins in a quest for higher returns, which usually triggers an explosion of altcoin rallies.

FXStreet
超過一百萬用戶依賴 FXStreet 獲取即時市場數據、圖表工具、專家洞見與外匯新聞。其全面的經濟日曆與教育網路研討會協助交易者保持資訊領先、做出審慎決策。FXStreet 擁有約 60 人的團隊,分布於巴塞隆納總部及全球各地。
Read More


