
Trade The World
EUR/USD Price Forecast: Remains below 1.1700 amid weakening momentum
作者 Akhtar Faruqui
發布日期: 8 Jan 2026 | 修改日期: 8 Jan 2026


POPULAR ARTICLES

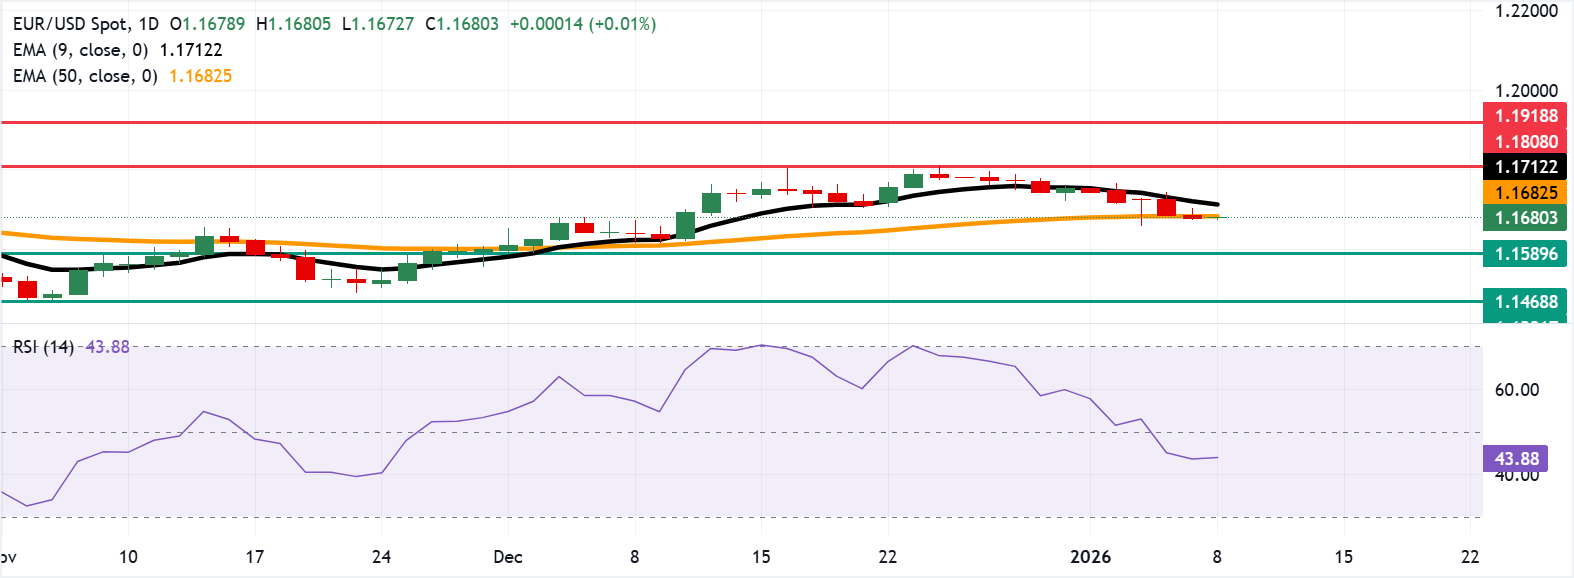
EUR/USD remains steady after four days of losses, trading around 1.1680 during the Asian hours on Thursday. On the daily chart, the 14-day Relative Strength Index (RSI) at 42.6 (neutral-bearish) indicates weakening momentum after slipping below the 50 midline.
- EUR/USD hovers around the 50-day EMA at 1.1682.
- The 14-day RSI at 42.6 signals weakening momentum with a neutral-to-bearish bias.
- The initial resistance lies at the nine-day EMA of 1.1711.
EUR/USD remains steady after four days of losses, trading around 1.1680 during the Asian hours on Thursday. On the daily chart, the 14-day Relative Strength Index (RSI) at 42.6 (neutral-bearish) indicates weakening momentum after slipping below the 50 midline. RSI staying sub-50 would keep bears engaged and limit recovery attempts.
The EUR/USD pair is currently positioned below the nine-day Exponential Moving Average (EMA) and marginally below the 50-day EMA, underscoring fading upside momentum. The medium-term average edges higher but is flattening, while the short-term average has rolled over, keeping a near-term cap in place.
The EUR/USD pair remains vulnerable while it holds under the declining nine-day EMA. Sustained weakness beneath the short-term average could keep risks skewed to the downside. A close below the 50-day EMA at 1.1682 would weaken the medium-term price momentum and put downward pressure on the pair to test the monthly low of 1.1589, set on December 1.
On the upside, a rebound above the nine-day EMA at 1.1711 would revive the momentum and support the EUR/USD pair to target the three-month high of 1.1808, which was recorded on December 24. Further advances would improve the short-term momentum and open the doors toward the 1.1918, the highest level since June 2021.
Euro Price Today
The table below shows the percentage change of Euro (EUR) against listed major currencies today. Euro was the strongest against the New Zealand Dollar.
| USD | EUR | GBP | JPY | CAD | AUD | NZD | CHF | |
|---|---|---|---|---|---|---|---|---|
| USD | -0.01% | 0.05% | 0.03% | 0.09% | 0.15% | 0.15% | -0.03% | |
| EUR | 0.01% | 0.06% | 0.05% | 0.10% | 0.15% | 0.16% | -0.02% | |
| GBP | -0.05% | -0.06% | 0.00% | 0.04% | 0.10% | 0.11% | -0.07% | |
| JPY | -0.03% | -0.05% | 0.00% | 0.04% | 0.11% | 0.08% | -0.08% | |
| CAD | -0.09% | -0.10% | -0.04% | -0.04% | 0.07% | 0.06% | -0.12% | |
| AUD | -0.15% | -0.15% | -0.10% | -0.11% | -0.07% | 0.00% | -0.17% | |
| NZD | -0.15% | -0.16% | -0.11% | -0.08% | -0.06% | -0.00% | -0.18% | |
| CHF | 0.03% | 0.02% | 0.07% | 0.08% | 0.12% | 0.17% | 0.18% |
The heat map shows percentage changes of major currencies against each other. The base currency is picked from the left column, while the quote currency is picked from the top row. For example, if you pick the Euro from the left column and move along the horizontal line to the US Dollar, the percentage change displayed in the box will represent EUR (base)/USD (quote).
(The technical analysis of this story was written with the help of an AI tool.)

FXStreet
超過一百萬用戶依賴 FXStreet 獲取即時市場數據、圖表工具、專家洞見與外匯新聞。其全面的經濟日曆與教育網路研討會協助交易者保持資訊領先、做出審慎決策。FXStreet 擁有約 60 人的團隊,分布於巴塞隆納總部及全球各地。
Read More


