
Trade The World
GBP/JPY Price Forecast: Breaks above 203.00 as bulls eye 204.25
作者 Christian Borjon Valencia
發布日期: 11 Nov 2025 | 修改日期: 11 Nov 2025


POPULAR ARTICLES

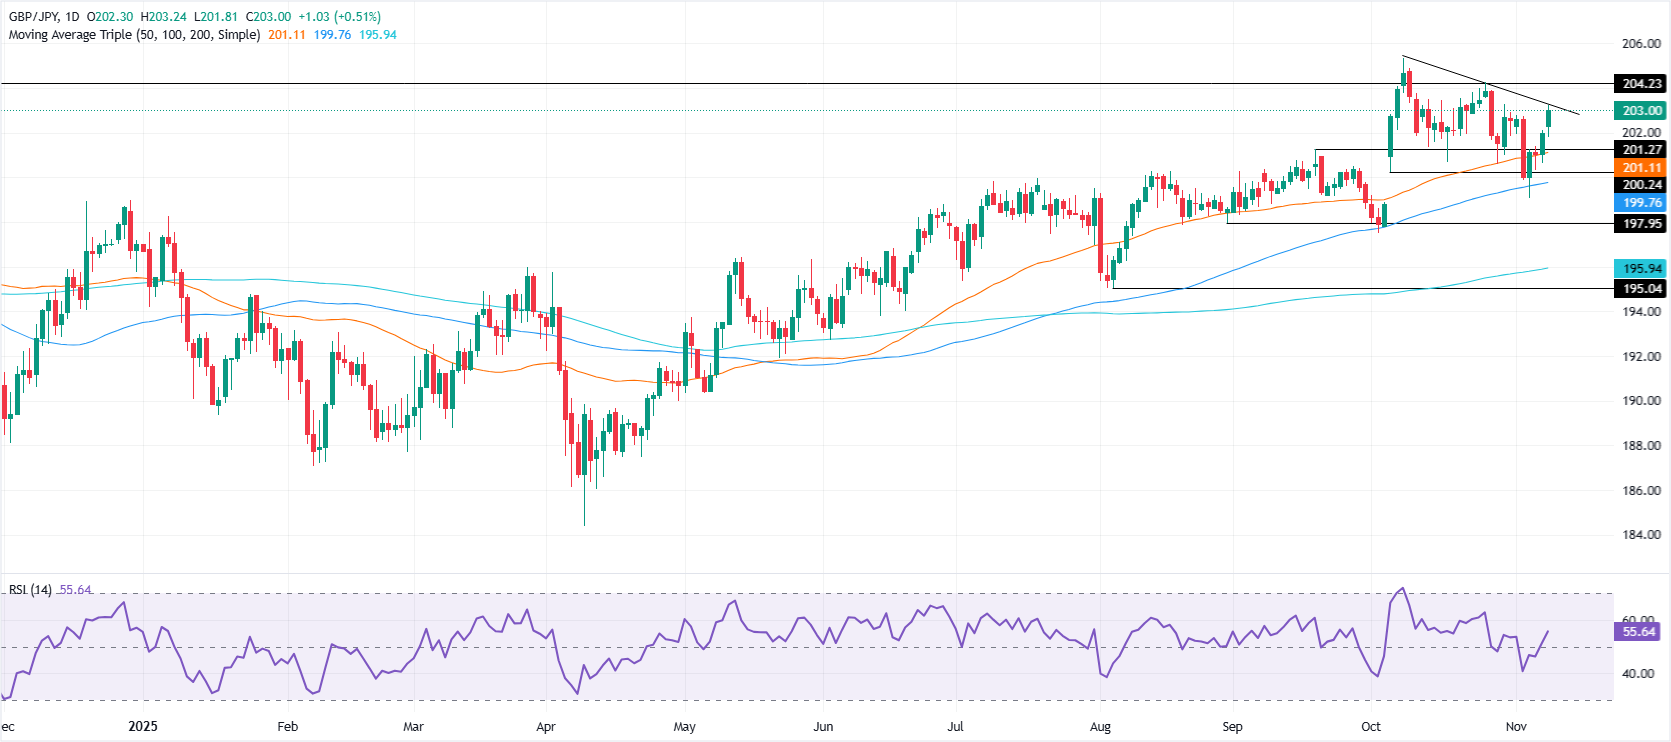
The Pound Sterling extended its gains versus the Japanese Yen on Monday, surpassing the 203.00 milestone as it gains over 0.54% clearing key previous resistance level turned support at the 20-day SMA at 202.37.
- GBP/JPY climbs above resistance amid renewed buying, turning 202.37 into key support zone.
- Bulls eye 204.24 and year-to-date high near 205.32 as RSI signals further upside momentum.
- Break below 202.00 risks deeper pullback toward 50-day SMA and November 7 swing low.
The Pound Sterling extended its gains versus the Japanese Yen on Monday, surpassing the 203.00 milestone as it gains over 0.54% clearing key previous resistance level turned support at the 20-day SMA at 202.37.
GBP/JPY Price Forecast: Technical outlook
Despite this, the GBP/JPY seems poised to consolidate unless buyers clear the next key resistance at 204.24 October 27 swing high. An uptrend resumption above the latter and the next stop would be the year-to-date (YTD) high at 205.32.
For a bearish scenario, sellers need to push the cross below the 20-dat SMA to test 202.00. Subsequent support rests at the 50-day SMA at 201.27, and a clear break, puts 201.00 to the test ahead of challenging the November 7 daily low of 200.65.
Given the backdrop described and the bullish momentum depicted by the Relative Strength Index (RSI), further upside is seen, but it is crucial for buyers, to hold firm above 203.00.
GBP/JPY Price Chart – Daily
Pound Sterling Price This week
The table below shows the percentage change of British Pound (GBP) against listed major currencies this week. British Pound was the strongest against the Swiss Franc.
| USD | EUR | GBP | JPY | CAD | AUD | NZD | CHF | |
|---|---|---|---|---|---|---|---|---|
| USD | 0.05% | 0.04% | 0.02% | 0.04% | 0.04% | -0.01% | 0.06% | |
| EUR | -0.05% | -0.01% | -0.05% | -0.01% | -0.02% | -0.07% | 0.00% | |
| GBP | -0.04% | 0.01% | 0.00% | -0.01% | -0.01% | -0.05% | 0.01% | |
| JPY | -0.02% | 0.05% | 0.00% | 0.00% | -0.00% | -0.04% | 0.02% | |
| CAD | -0.04% | 0.01% | 0.00% | -0.00% | -0.01% | -0.03% | 0.02% | |
| AUD | -0.04% | 0.02% | 0.00% | 0.00% | 0.00% | -0.04% | 0.00% | |
| NZD | 0.00% | 0.07% | 0.05% | 0.04% | 0.03% | 0.04% | 0.06% | |
| CHF | -0.06% | -0.00% | -0.01% | -0.02% | -0.02% | -0.01% | -0.06% |
The heat map shows percentage changes of major currencies against each other. The base currency is picked from the left column, while the quote currency is picked from the top row. For example, if you pick the British Pound from the left column and move along the horizontal line to the US Dollar, the percentage change displayed in the box will represent GBP (base)/USD (quote).

FXStreet
超過一百萬用戶依賴 FXStreet 獲取即時市場數據、圖表工具、專家洞見與外匯新聞。其全面的經濟日曆與教育網路研討會協助交易者保持資訊領先、做出審慎決策。FXStreet 擁有約 60 人的團隊,分布於巴塞隆納總部及全球各地。
Read More


