
Trade The World
NZD/USD Price Forecast: Slumps to near 0.5850 as 20-day EMA remains key barrier
作者 Sagar Dua
發布日期: 2 Sep 2025 | 修改日期: 2 Sep 2025


POPULAR ARTICLES

The NZD/USD pair is down 0.8% to near 0.5850 during the European trading session on Tuesday. The Kiwi pair tumbles as the US Dollar (USD) strengthens ahead of the opening of United States (US) markets after an extended weekend.
- NZD/USD plummets to near 0.5850 as the US Dollar strengthens ahead of the US Manufacturing PMI data for August.
- Investors expect the Fed to cut interest rates in September.
- NZD/USD falls back after a mean-recovery move to near the 20-day EMA.
The NZD/USD pair is down 0.8% to near 0.5850 during the European trading session on Tuesday. The Kiwi pair tumbles as the US Dollar (USD) strengthens ahead of the opening of United States (US) markets after an extended weekend.
At the time of writing, the US Dollar Index (DXY), which tracks the Greenback’s value against six major currencies, advances 0.6% to near 98.30.
US Dollar Price Today
The table below shows the percentage change of US Dollar (USD) against listed major currencies today. US Dollar was the strongest against the British Pound.
| USD | EUR | GBP | JPY | CAD | AUD | NZD | CHF | |
|---|---|---|---|---|---|---|---|---|
| USD | 0.59% | 1.03% | 0.89% | 0.16% | 0.62% | 0.77% | 0.46% | |
| EUR | -0.59% | 0.42% | 0.31% | -0.43% | 0.07% | 0.17% | -0.14% | |
| GBP | -1.03% | -0.42% | -0.10% | -0.84% | -0.36% | -0.25% | -0.55% | |
| JPY | -0.89% | -0.31% | 0.10% | -0.74% | -0.28% | -0.12% | -0.40% | |
| CAD | -0.16% | 0.43% | 0.84% | 0.74% | 0.44% | 0.64% | 0.30% | |
| AUD | -0.62% | -0.07% | 0.36% | 0.28% | -0.44% | 0.12% | -0.19% | |
| NZD | -0.77% | -0.17% | 0.25% | 0.12% | -0.64% | -0.12% | -0.30% | |
| CHF | -0.46% | 0.14% | 0.55% | 0.40% | -0.30% | 0.19% | 0.30% |
The heat map shows percentage changes of major currencies against each other. The base currency is picked from the left column, while the quote currency is picked from the top row. For example, if you pick the US Dollar from the left column and move along the horizontal line to the Japanese Yen, the percentage change displayed in the box will represent USD (base)/JPY (quote).
The US Dollar had been underperforming its peers from almost a month as traders remained increasingly confident that the Federal Reserve (Fed) will cut interest rates in the September policy meeting.
In Tuesday’s session, investors will focus on the US ISM and S&P Global Manufacturing PMI Data for August, which will be published during North American trading hours. The ISM Manufacturing PMI is seen higher at 49.0, against 48.0 in July.
This week, the New Zealand Dollar (NZD) is expected to be guided by market sentiment due to light New Zealand (NZ) economic calendar.
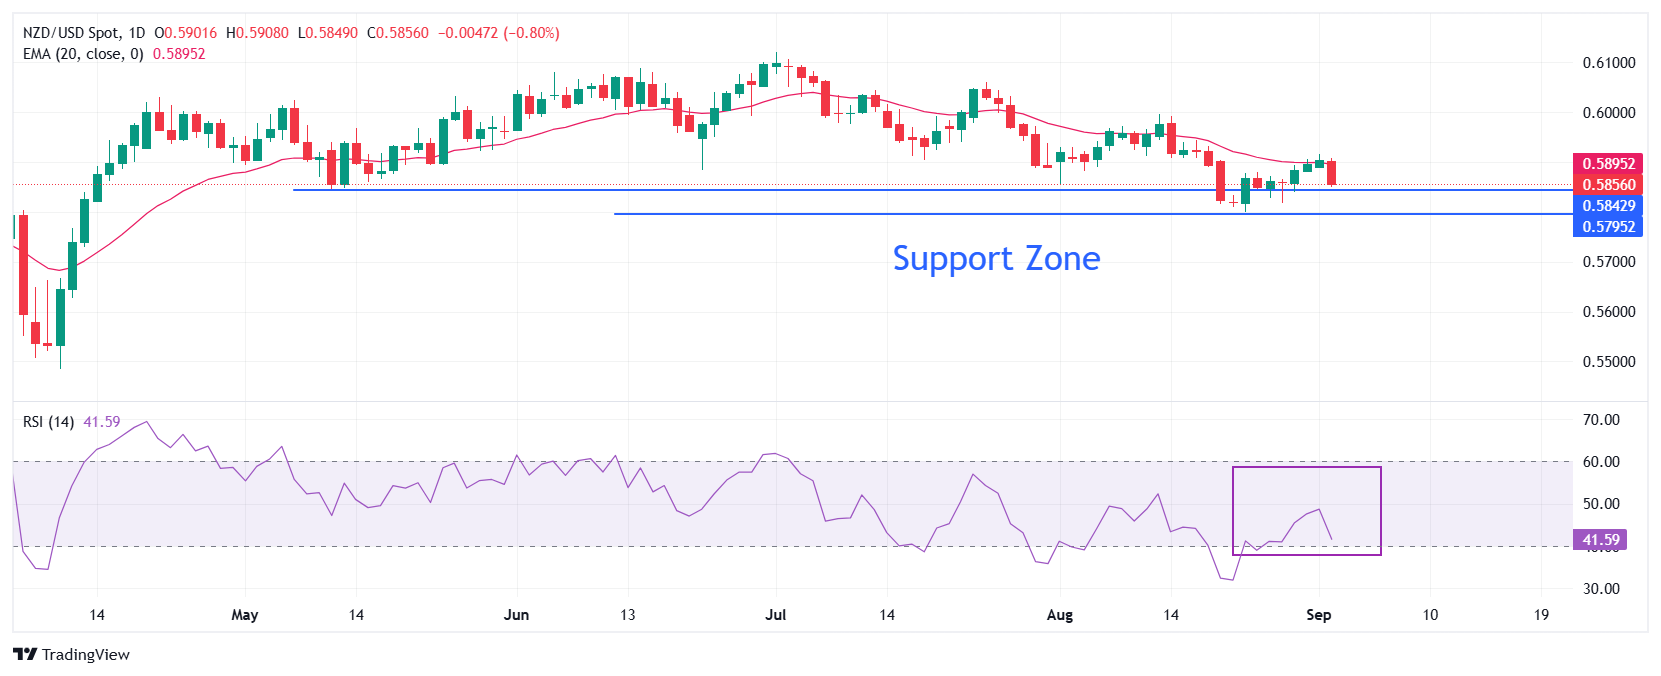
NZD/USD turns upside down after facing selling pressure near the 20-day Exponential Moving Average (EMA), which trades around 0.5900.
The 14-day Relative Strength Index (RSI) slides to near 40.00. A fresh bearish momentum would emerge if the RSI breaks below that level.
Going forward, a downside move by the pair below the support zone formed in a range between 0.5800 and 0.5850 will expose it to the April 11 low of 0.5730, followed by the round-level support of 0.5700.
In an alternate scenario, the Kiwi pair would rise towards the June 19 high of 0.6040 and the September 11 low of 0.6100 if it manages to return above the psychological level of 0.6000.
NZD/USD daily chart
US Dollar FAQs
The US Dollar (USD) is the official currency of the United States of America, and the ‘de facto’ currency of a significant number of other countries where it is found in circulation alongside local notes. It is the most heavily traded currency in the world, accounting for over 88% of all global foreign exchange turnover, or an average of $6.6 trillion in transactions per day, according to data from 2022. Following the second world war, the USD took over from the British Pound as the world’s reserve currency. For most of its history, the US Dollar was backed by Gold, until the Bretton Woods Agreement in 1971 when the Gold Standard went away.
The most important single factor impacting on the value of the US Dollar is monetary policy, which is shaped by the Federal Reserve (Fed). The Fed has two mandates: to achieve price stability (control inflation) and foster full employment. Its primary tool to achieve these two goals is by adjusting interest rates. When prices are rising too quickly and inflation is above the Fed’s 2% target, the Fed will raise rates, which helps the USD value. When inflation falls below 2% or the Unemployment Rate is too high, the Fed may lower interest rates, which weighs on the Greenback.
In extreme situations, the Federal Reserve can also print more Dollars and enact quantitative easing (QE). QE is the process by which the Fed substantially increases the flow of credit in a stuck financial system. It is a non-standard policy measure used when credit has dried up because banks will not lend to each other (out of the fear of counterparty default). It is a last resort when simply lowering interest rates is unlikely to achieve the necessary result. It was the Fed’s weapon of choice to combat the credit crunch that occurred during the Great Financial Crisis in 2008. It involves the Fed printing more Dollars and using them to buy US government bonds predominantly from financial institutions. QE usually leads to a weaker US Dollar.
Quantitative tightening (QT) is the reverse process whereby the Federal Reserve stops buying bonds from financial institutions and does not reinvest the principal from the bonds it holds maturing in new purchases. It is usually positive for the US Dollar.

FXStreet
超過一百萬用戶依賴 FXStreet 獲取即時市場數據、圖表工具、專家洞見與外匯新聞。其全面的經濟日曆與教育網路研討會協助交易者保持資訊領先、做出審慎決策。FXStreet 擁有約 60 人的團隊,分布於巴塞隆納總部及全球各地。
Read More


