
Trade The World
NZD/USD Price Forecast: USD bulls keep Kiwi pair below 200-day EMA
作者 Sagar Dua
發布日期: 19 Sep 2025 | 修改日期: 19 Sep 2025


POPULAR ARTICLES

The NZD/USD pair slides to near 0.5855 during the late European trading session on Friday, the lowest level seen in 10 days. The Kiwi pair weakens as the US Dollar (USD) extends its recent recovery move, with the US Dollar Index (DXY) rising to near 97.60.
- NZD/USD falls to near 0.5855 as the US Dollar extends its winning streak.
- The Fed started its monetary easing campaign with a 25-bps interest rate reduction.
- Investors expect the RBNZ to cut interest rates again next month.
The NZD/USD pair slides to near 0.5855 during the late European trading session on Friday, the lowest level seen in 10 days. The Kiwi pair weakens as the US Dollar (USD) extends its recent recovery move, with the US Dollar Index (DXY) rising to near 97.60.
The US Dollar has been outperforming its peers since the monetary policy announcement by the Federal Reserve (Fed). On Wednesday, the Fed reduced interest rates by 25 basis points (bps) to 4.00%-4.25% and signaled that there will be two more interest rate cuts in the remainder of the year.
The Fed pivoted to unwinding the monetary policy restrictiveness as the United States (US) labor market conditions have deteriorated. “Demand for labour is down a little more sharply than supply of labour, and I can no longer say labor market is solid,” Fed Chair Jerome Powell said.
Meanwhile, the broader outlook of the New Zealand Dollar (NZD) remains weak as traders expect the Reserve Bank of New Zealand (RBNZ) to cut interest rates again in the monetary policy meeting next month. In August, the RBNZ reduced its Official Cash Rate (OCR) by 25 basis points (bps) to 3%.
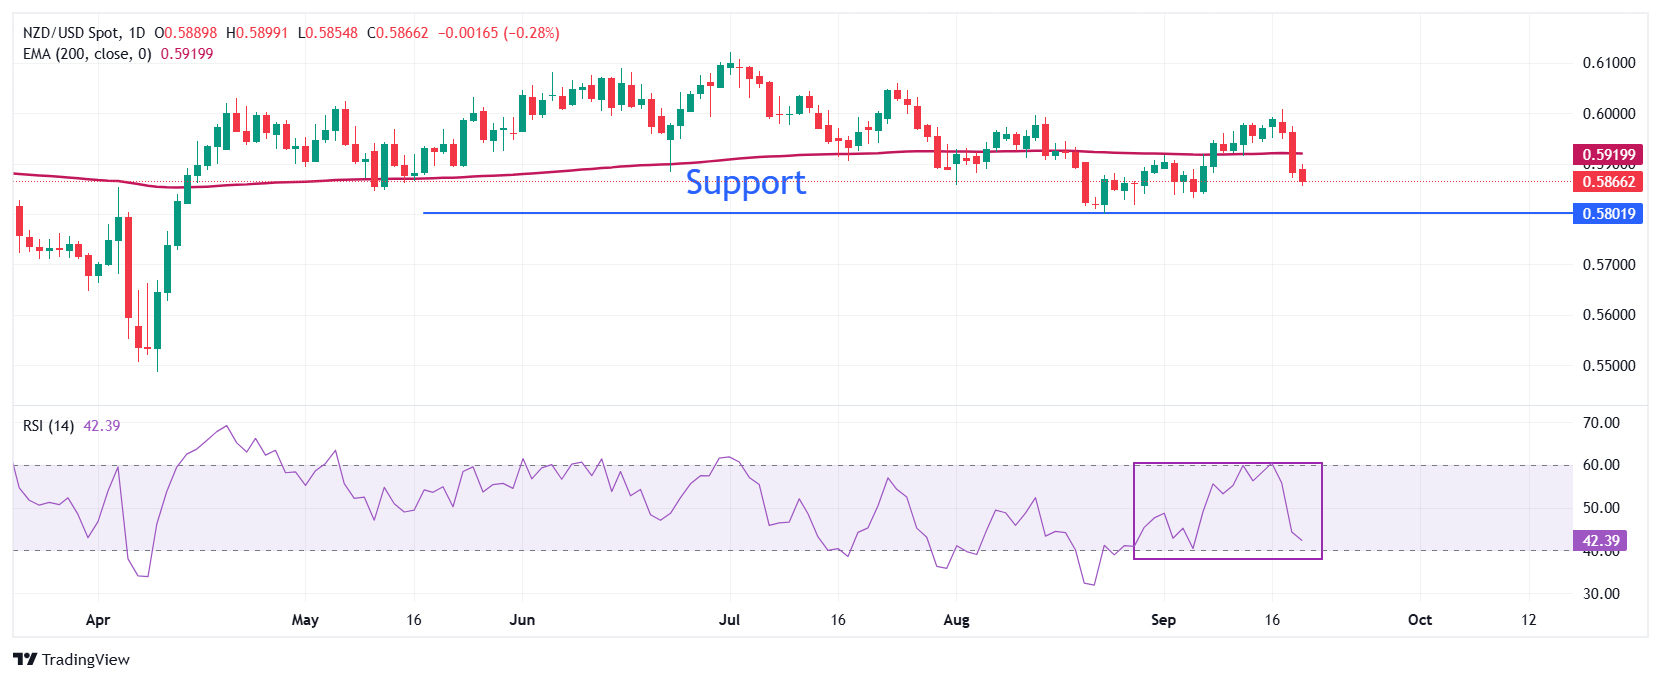
NZD/USD extends its winning streak for the third trading day on Friday. The Kiwi pair stays below the 200-day Exponential Moving Average (EMA), which trades around 0.5920, indicating that the overall trend is bearish.
The 14-day Relative Strength Index (RSI) falls to near 40.00. A fresh bearish momentum would emerge if the RSI breaks below that level.
Going forward, a downside move by the pair below the August 2 low of 0.5800 will expose it to the April 11 low of 0.5730, followed by the round-level support of 0.5700.
In an alternate scenario, the Kiwi pair would rise towards the June 19 high of 0.6040 and the September 11 low of 0.6100 if it manages to return above the psychological level of 0.6000.
NZD/USD daily chart
US Dollar FAQs
The US Dollar (USD) is the official currency of the United States of America, and the ‘de facto’ currency of a significant number of other countries where it is found in circulation alongside local notes. It is the most heavily traded currency in the world, accounting for over 88% of all global foreign exchange turnover, or an average of $6.6 trillion in transactions per day, according to data from 2022. Following the second world war, the USD took over from the British Pound as the world’s reserve currency. For most of its history, the US Dollar was backed by Gold, until the Bretton Woods Agreement in 1971 when the Gold Standard went away.
The most important single factor impacting on the value of the US Dollar is monetary policy, which is shaped by the Federal Reserve (Fed). The Fed has two mandates: to achieve price stability (control inflation) and foster full employment. Its primary tool to achieve these two goals is by adjusting interest rates. When prices are rising too quickly and inflation is above the Fed’s 2% target, the Fed will raise rates, which helps the USD value. When inflation falls below 2% or the Unemployment Rate is too high, the Fed may lower interest rates, which weighs on the Greenback.
In extreme situations, the Federal Reserve can also print more Dollars and enact quantitative easing (QE). QE is the process by which the Fed substantially increases the flow of credit in a stuck financial system. It is a non-standard policy measure used when credit has dried up because banks will not lend to each other (out of the fear of counterparty default). It is a last resort when simply lowering interest rates is unlikely to achieve the necessary result. It was the Fed’s weapon of choice to combat the credit crunch that occurred during the Great Financial Crisis in 2008. It involves the Fed printing more Dollars and using them to buy US government bonds predominantly from financial institutions. QE usually leads to a weaker US Dollar.
Quantitative tightening (QT) is the reverse process whereby the Federal Reserve stops buying bonds from financial institutions and does not reinvest the principal from the bonds it holds maturing in new purchases. It is usually positive for the US Dollar.

FXStreet
超過一百萬用戶依賴 FXStreet 獲取即時市場數據、圖表工具、專家洞見與外匯新聞。其全面的經濟日曆與教育網路研討會協助交易者保持資訊領先、做出審慎決策。FXStreet 擁有約 60 人的團隊,分布於巴塞隆納總部及全球各地。
Read More


