
Trade The World
Solana Price Forecast: SOL slides below $200 as US-China trade tension escalates
作者 Manish Chhetri
發布日期: 14 Oct 2025 | 修改日期: 14 Oct 2025


POPULAR ARTICLES

Solana (SOL) price trades below $200 at the time of writing on Tuesday, after facing rejection from the key resistance zone. The broader crypto market came under pressure as escalating US-China trade tensions fueled risk aversion among investors.
- Solana price trades in red on Tuesday, slipping below $200 after facing rejection from the 50-day EMA.
- Rising US-China trade tensions have fueled risk aversion, pressuring major cryptocurrencies.
- Technical indicators point to a potential short-term correction, with a dead-cat bounce scenario possibly unfolding.
Solana (SOL) price trades below $200 at the time of writing on Tuesday, after facing rejection from the key resistance zone. The broader crypto market came under pressure as escalating US-China trade tensions fueled risk aversion among investors. Technical indicators for SOL hint at a possible short-term correction, with price action suggesting that a dead-cat bounce scenario may be unfolding.
US-China trade tension triggers risk-off sentiment
Trade disputes between the US and China have triggered uncertainty and a risk-off sentiment in the market. On Tuesday, the world’s two largest economies are set to start charging new port fees on each other’s ships, according to a BBC report.
China says its levies aim to safeguard the country’s shipping industry from “discriminatory” measures and are to be applied to US-owned, operated, built, or flagged vessels but not to Chinese-built ships. This comes in retaliation for US fees on Chinese ships, which Washington says are imposed to support American shipping companies.
Moreover, on Tuesday, new US tariffs have come into effect on imported timber, kitchen cabinets and upholstered furniture, much of which comes from the Asian country.
Adding to this, China’s Commerce Ministry confirmed early Tuesday that it had notified the US in advance of its new rare earth export controls and held working-level talks on Monday under existing trade consultation channels.
Meanwhile, US Treasury Secretary Scott Bessent said on Monday that US President Donald Trump remains on track to meet Chinese leader Xi Jinping in South Korea in late October.
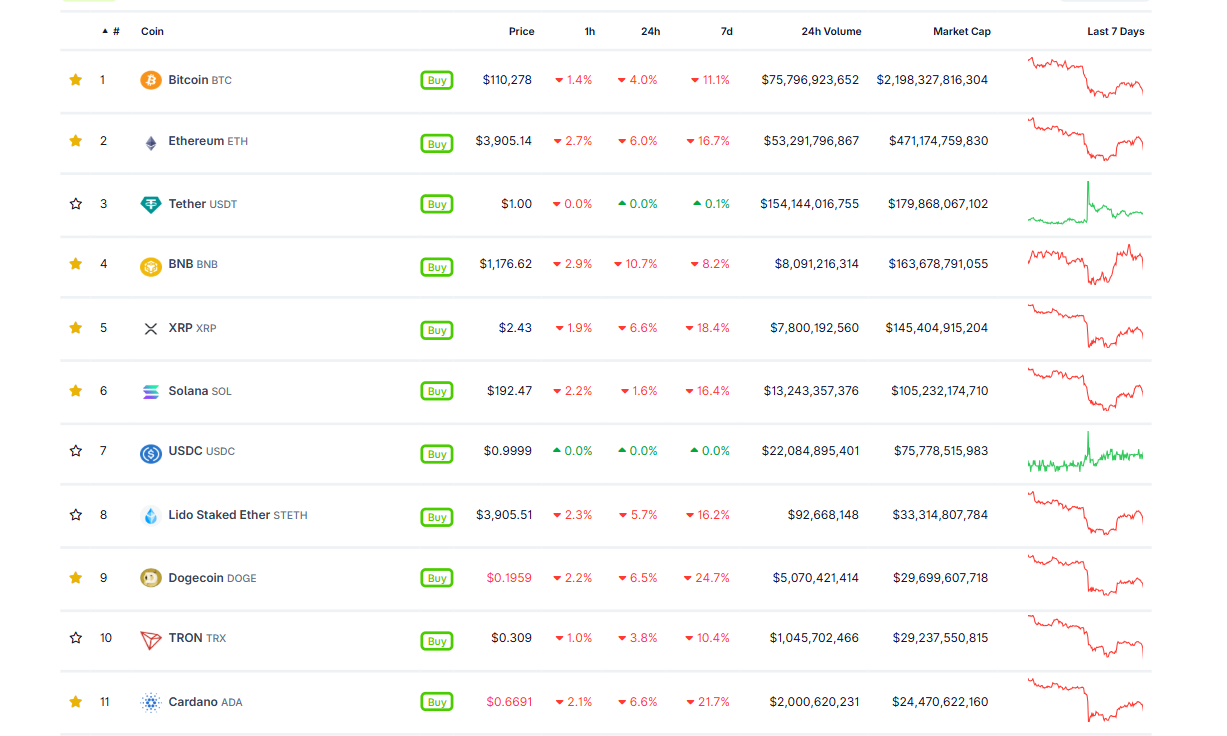
This escalating trade tensions have fueled risk aversion in markets, pressuring major cryptocurrencies, with Bitcoin (BTC), Ethereum (ETH) and Solana (SOL) trading currently in red as shown in the chart below.
Solana Price Forecast: Dead-cat bounce scenario in play
On Friday, Solana’s price on the 4-hour chart faced rejection from the descending trendline (drawn by joining multiple highs since October 6) and declined more than 19% by Saturday. However, SOL recovered slightly in the next two days. At the time of writing on Tuesday, SOL faced rejection from the trendline and trades below $200. This trendline roughly coincides with the 100-day Exponential Moving Average (EMA) at $211.17 and the 61.8% Fibonacci retracement level at $211.56, making this a key resistance level.
In this scenario, the brief price recovery during Sunday and Monday, within a broader downtrend, suggests SOL could be experiencing a dead-cat bounce.
If Solana continues its correction and closes below the daily support at $192.74, it could extend the decline toward Friday’s low near $169.12.
The Relative Strength Index (RSI) on the 4-hour chart slips below the neutral level of 50 on Tuesday, reading 45, indicating bearish momentum gaining traction.
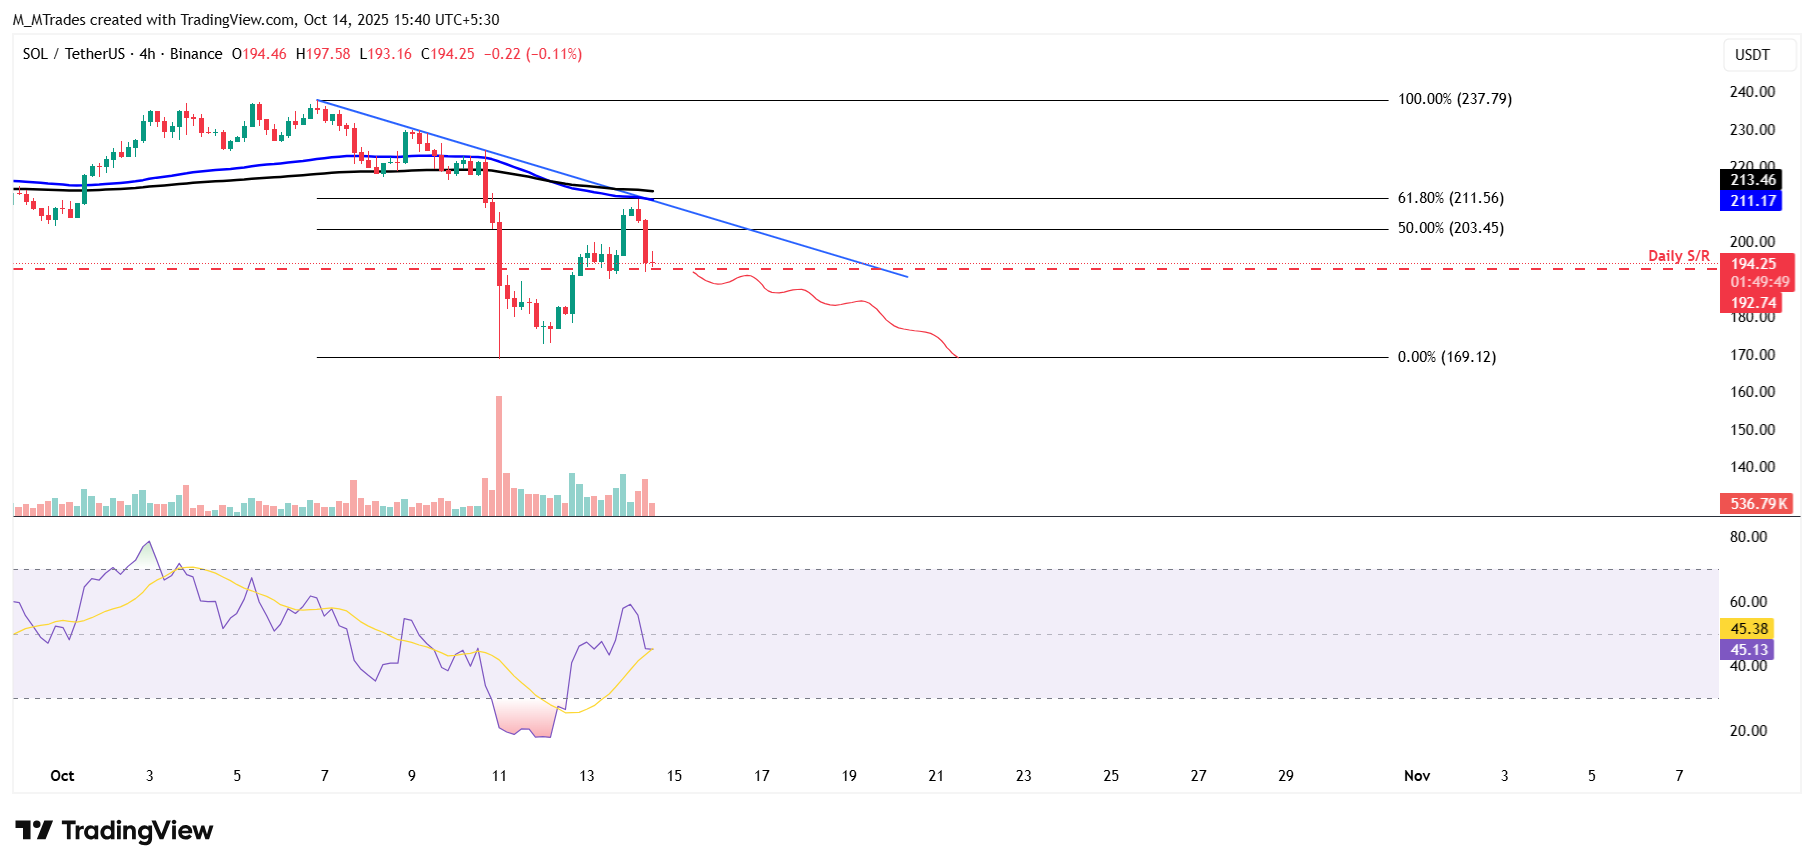
SOL/USDT 4-hr chart
On the daily chart, SOL price found support around the ascending trendline (drawn by joining multiple lows since early April) on Saturday and rose by over 17% in the next two days. At the time of writing on Tuesday, it trades down by 6.9% after retesting the 50-day EMA at $210.69.
If SOL continues its correction, it could extend the decline to retest the next daily support level at $184.13.
The RSI on the daily chart reads 42, below the neutral level of 50, and points downward, indicating bearish momentum gaining traction. Additionally, the Moving Average Convergence Divergence (MACD) showed a bearish crossover on Friday, which still holds, further supporting the bearish view.
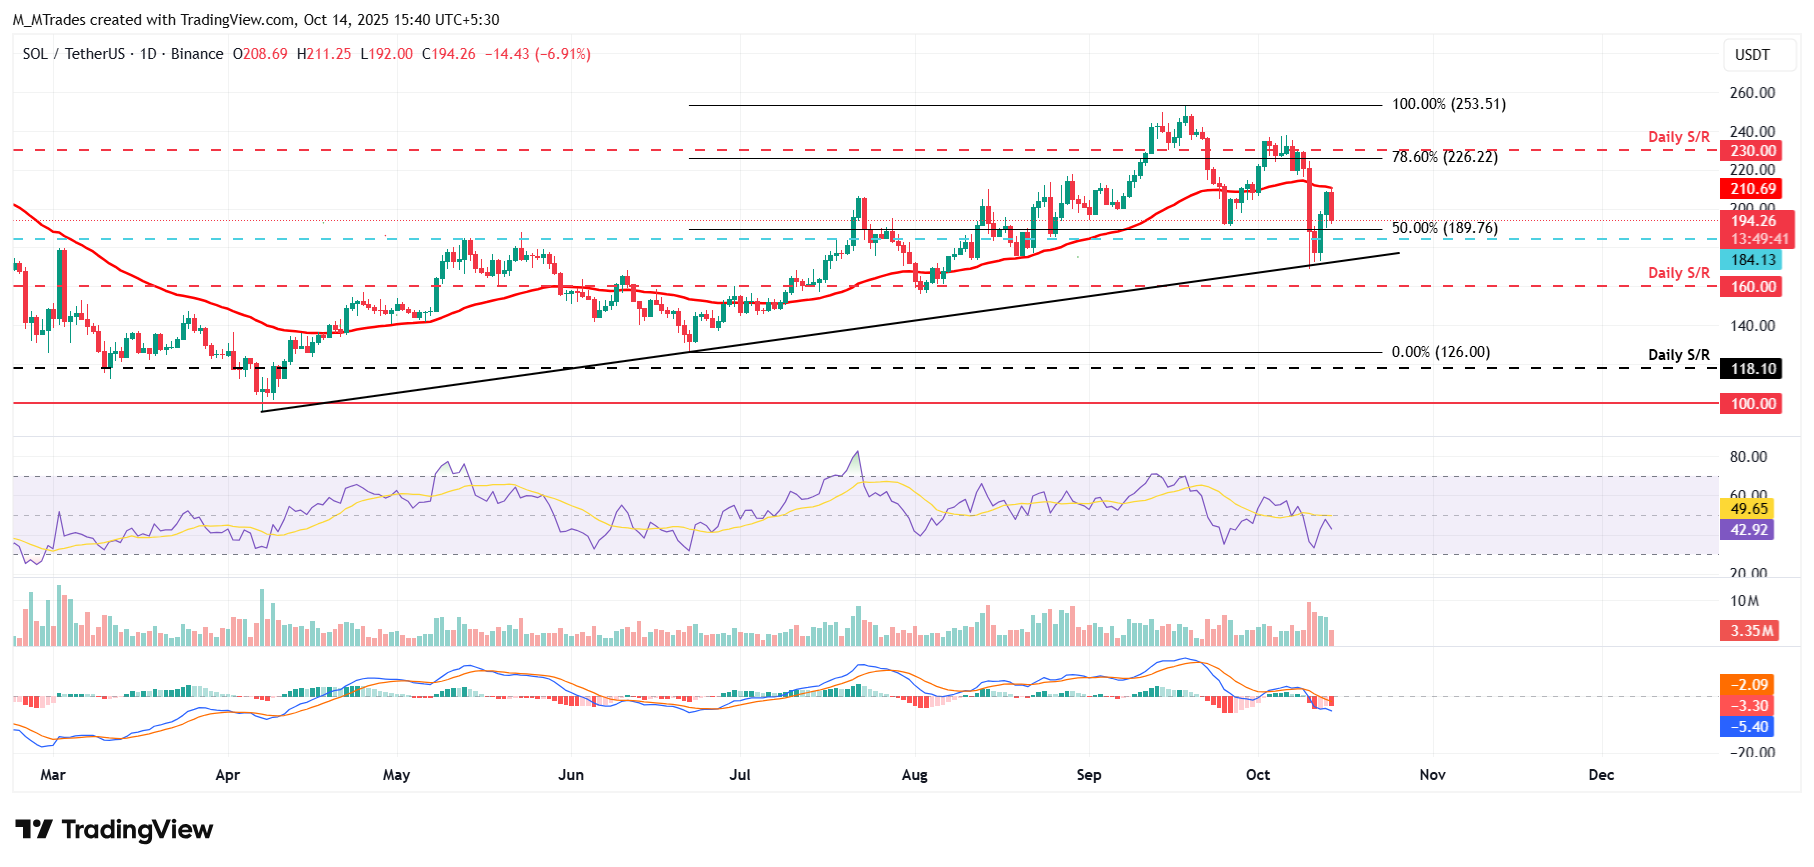
SOL/USDT daily chart
On the other hand, if SOL recovers, it could extend the advance toward the 50-day EMA at $210.69.

FXStreet
超過一百萬用戶依賴 FXStreet 獲取即時市場數據、圖表工具、專家洞見與外匯新聞。其全面的經濟日曆與教育網路研討會協助交易者保持資訊領先、做出審慎決策。FXStreet 擁有約 60 人的團隊,分布於巴塞隆納總部及全球各地。
Read More


