
Trade The World
Stellar Price Forecast: XLM flashes bullish potential as long positions build up
作者 Vishal Dixit
發布日期: 10 Nov 2025 | 修改日期: 10 Nov 2025


POPULAR ARTICLES

Stellar (XLM) edges higher by over 7% at press time on Monday, extending the bounce back within a descending channel pattern. Derivatives market data suggest a rise in risk-on sentiment among traders.
- Stellar price extends gains by over 7% on Monday, recovering the previous week's losses.
- Derivatives data signal a bullish shift in traders' sentiment, increasing risk exposure.
- The technical outlook suggests a bullish incline as the selling pressure decreases.
Stellar (XLM) edges higher by over 7% at press time on Monday, extending the bounce back within a descending channel pattern. Derivatives market data suggest a rise in risk-on sentiment among traders. Still, the technical outlook indicates a bullish shift in trend momentum, but multiple resistances are looming overhead.
Rising optimism among XLM traders
Stellar is gaining interest among derivatives traders as the broader cryptocurrency market begins the week on a strong note, underpinned by US government shutdown resolution hopes. CoinGlass data indicates that the XLM futures Open Interest (OI) stands at $130.16 million, which represents a 11.68% increase over the last 24 hours, suggesting that traders anticipate further gains.
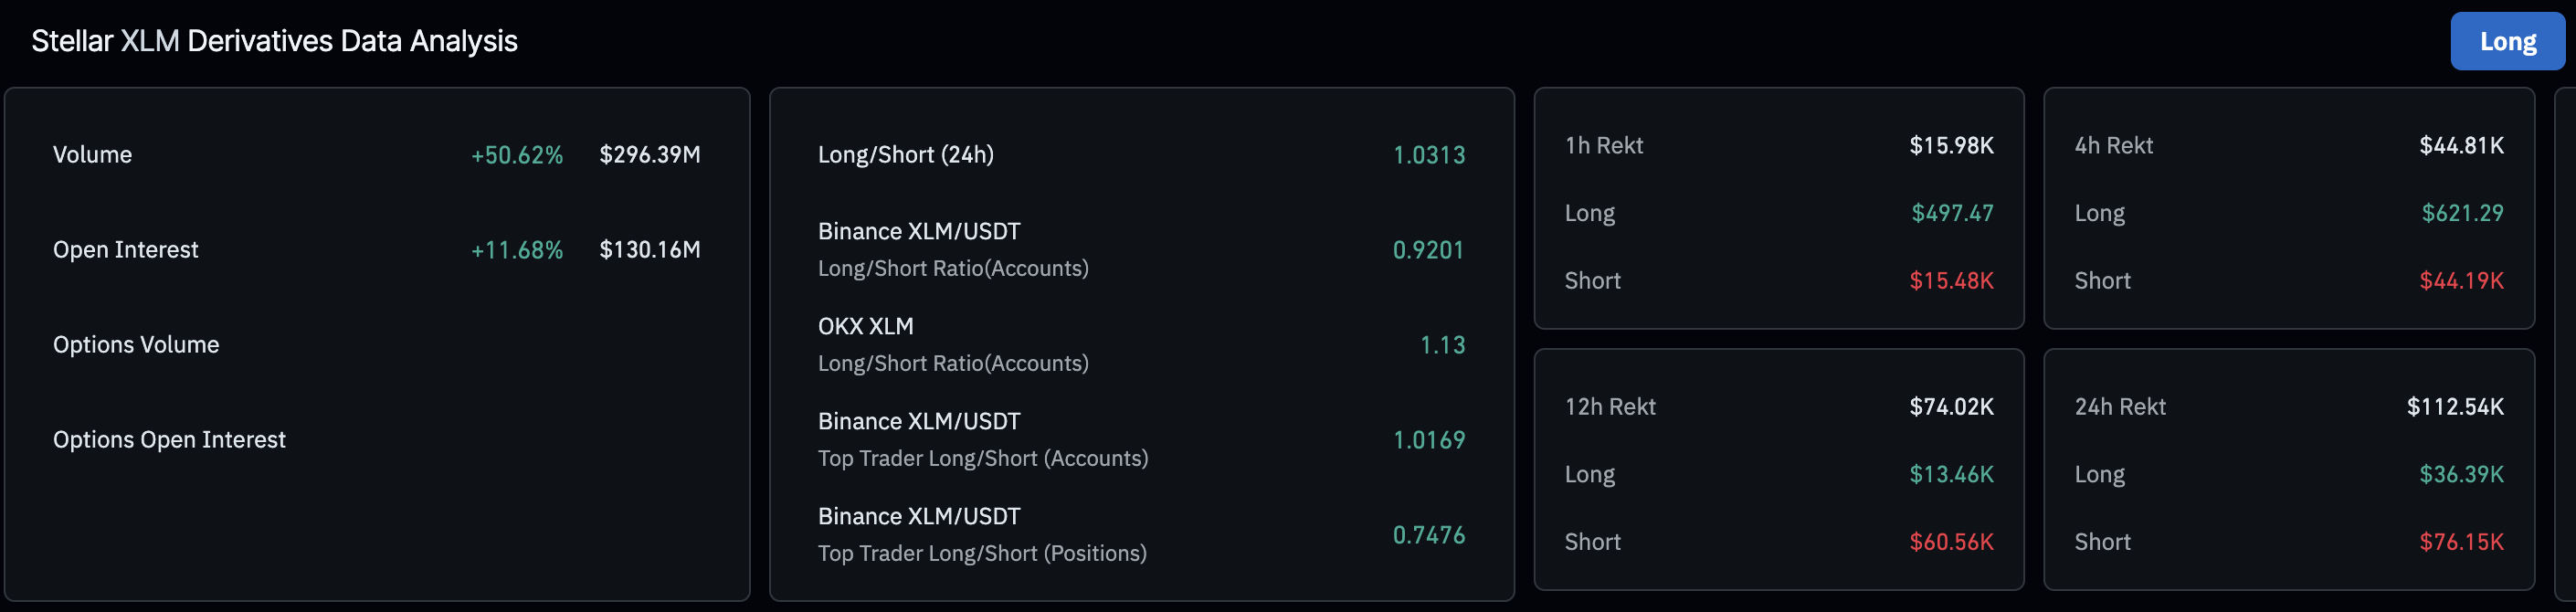
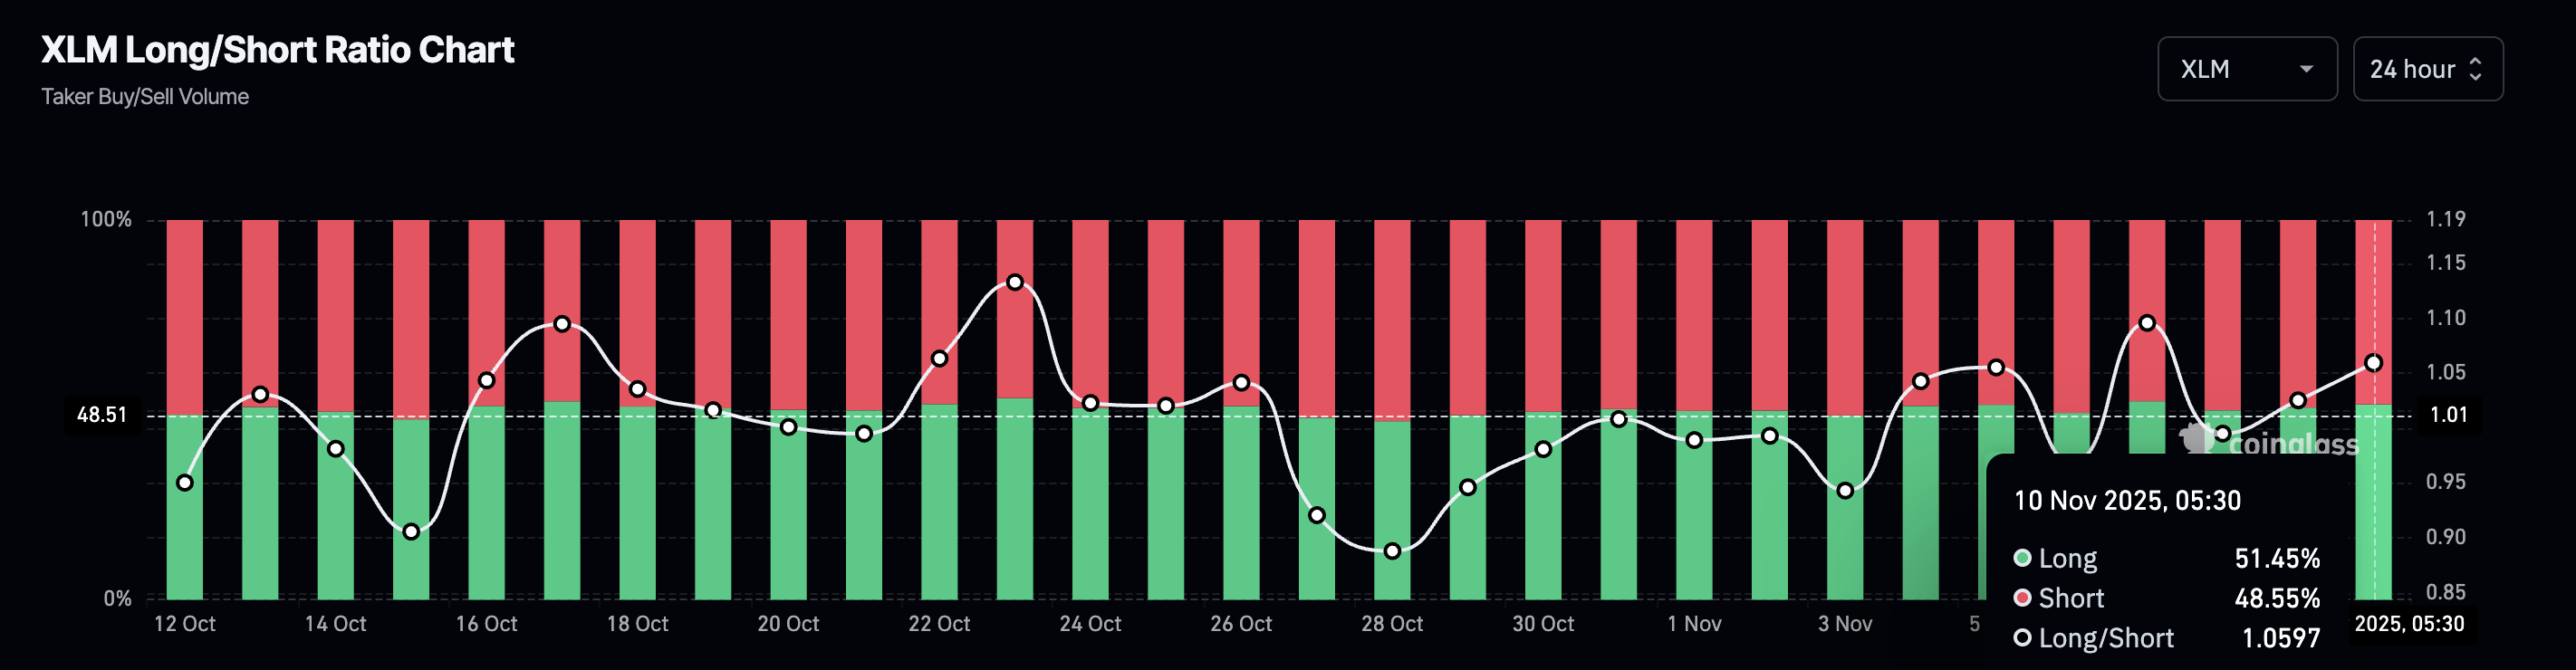
Corroborating the optimistic shift, the long-to-short ratio for the cross-border remittance token over the last 24 hours is at 1.0597. Above 1, this ratio indicates more outstanding long positions compared to short positions, reflecting the underlying bullish sentiment among traders.
Stellar’s recovery rises against declining average lines
Stellar trades close to $0.3000 at press time on Monday, bouncing back within a descending channel pattern on the daily chart. The rebound in the larger downward trend trades below the 50-day, 100-day, and 200-day Exponential Moving Averages at $0.3265, $0.3417, and $0.3361, respectively.
If the recovery run exceeds these average lines, Stellar could target the overhead trendline of the descending channel near $0.3700.
The technical indicators on the daily chart suggest a resurgence in bullish momentum, as the Moving Average Convergence Divergence (MACD) crosses above its signal line. At the same time, the Relative Strength Index (RSI) rises to 49 on the same chart, approaching the midpoint level, which indicates that selling pressure has been dramatically reduced.
Still, the recent Death Cross pattern marked by the 50-day EMA crossing below the 200-day EMA on November 3, reflects the prevailing bearish grip.
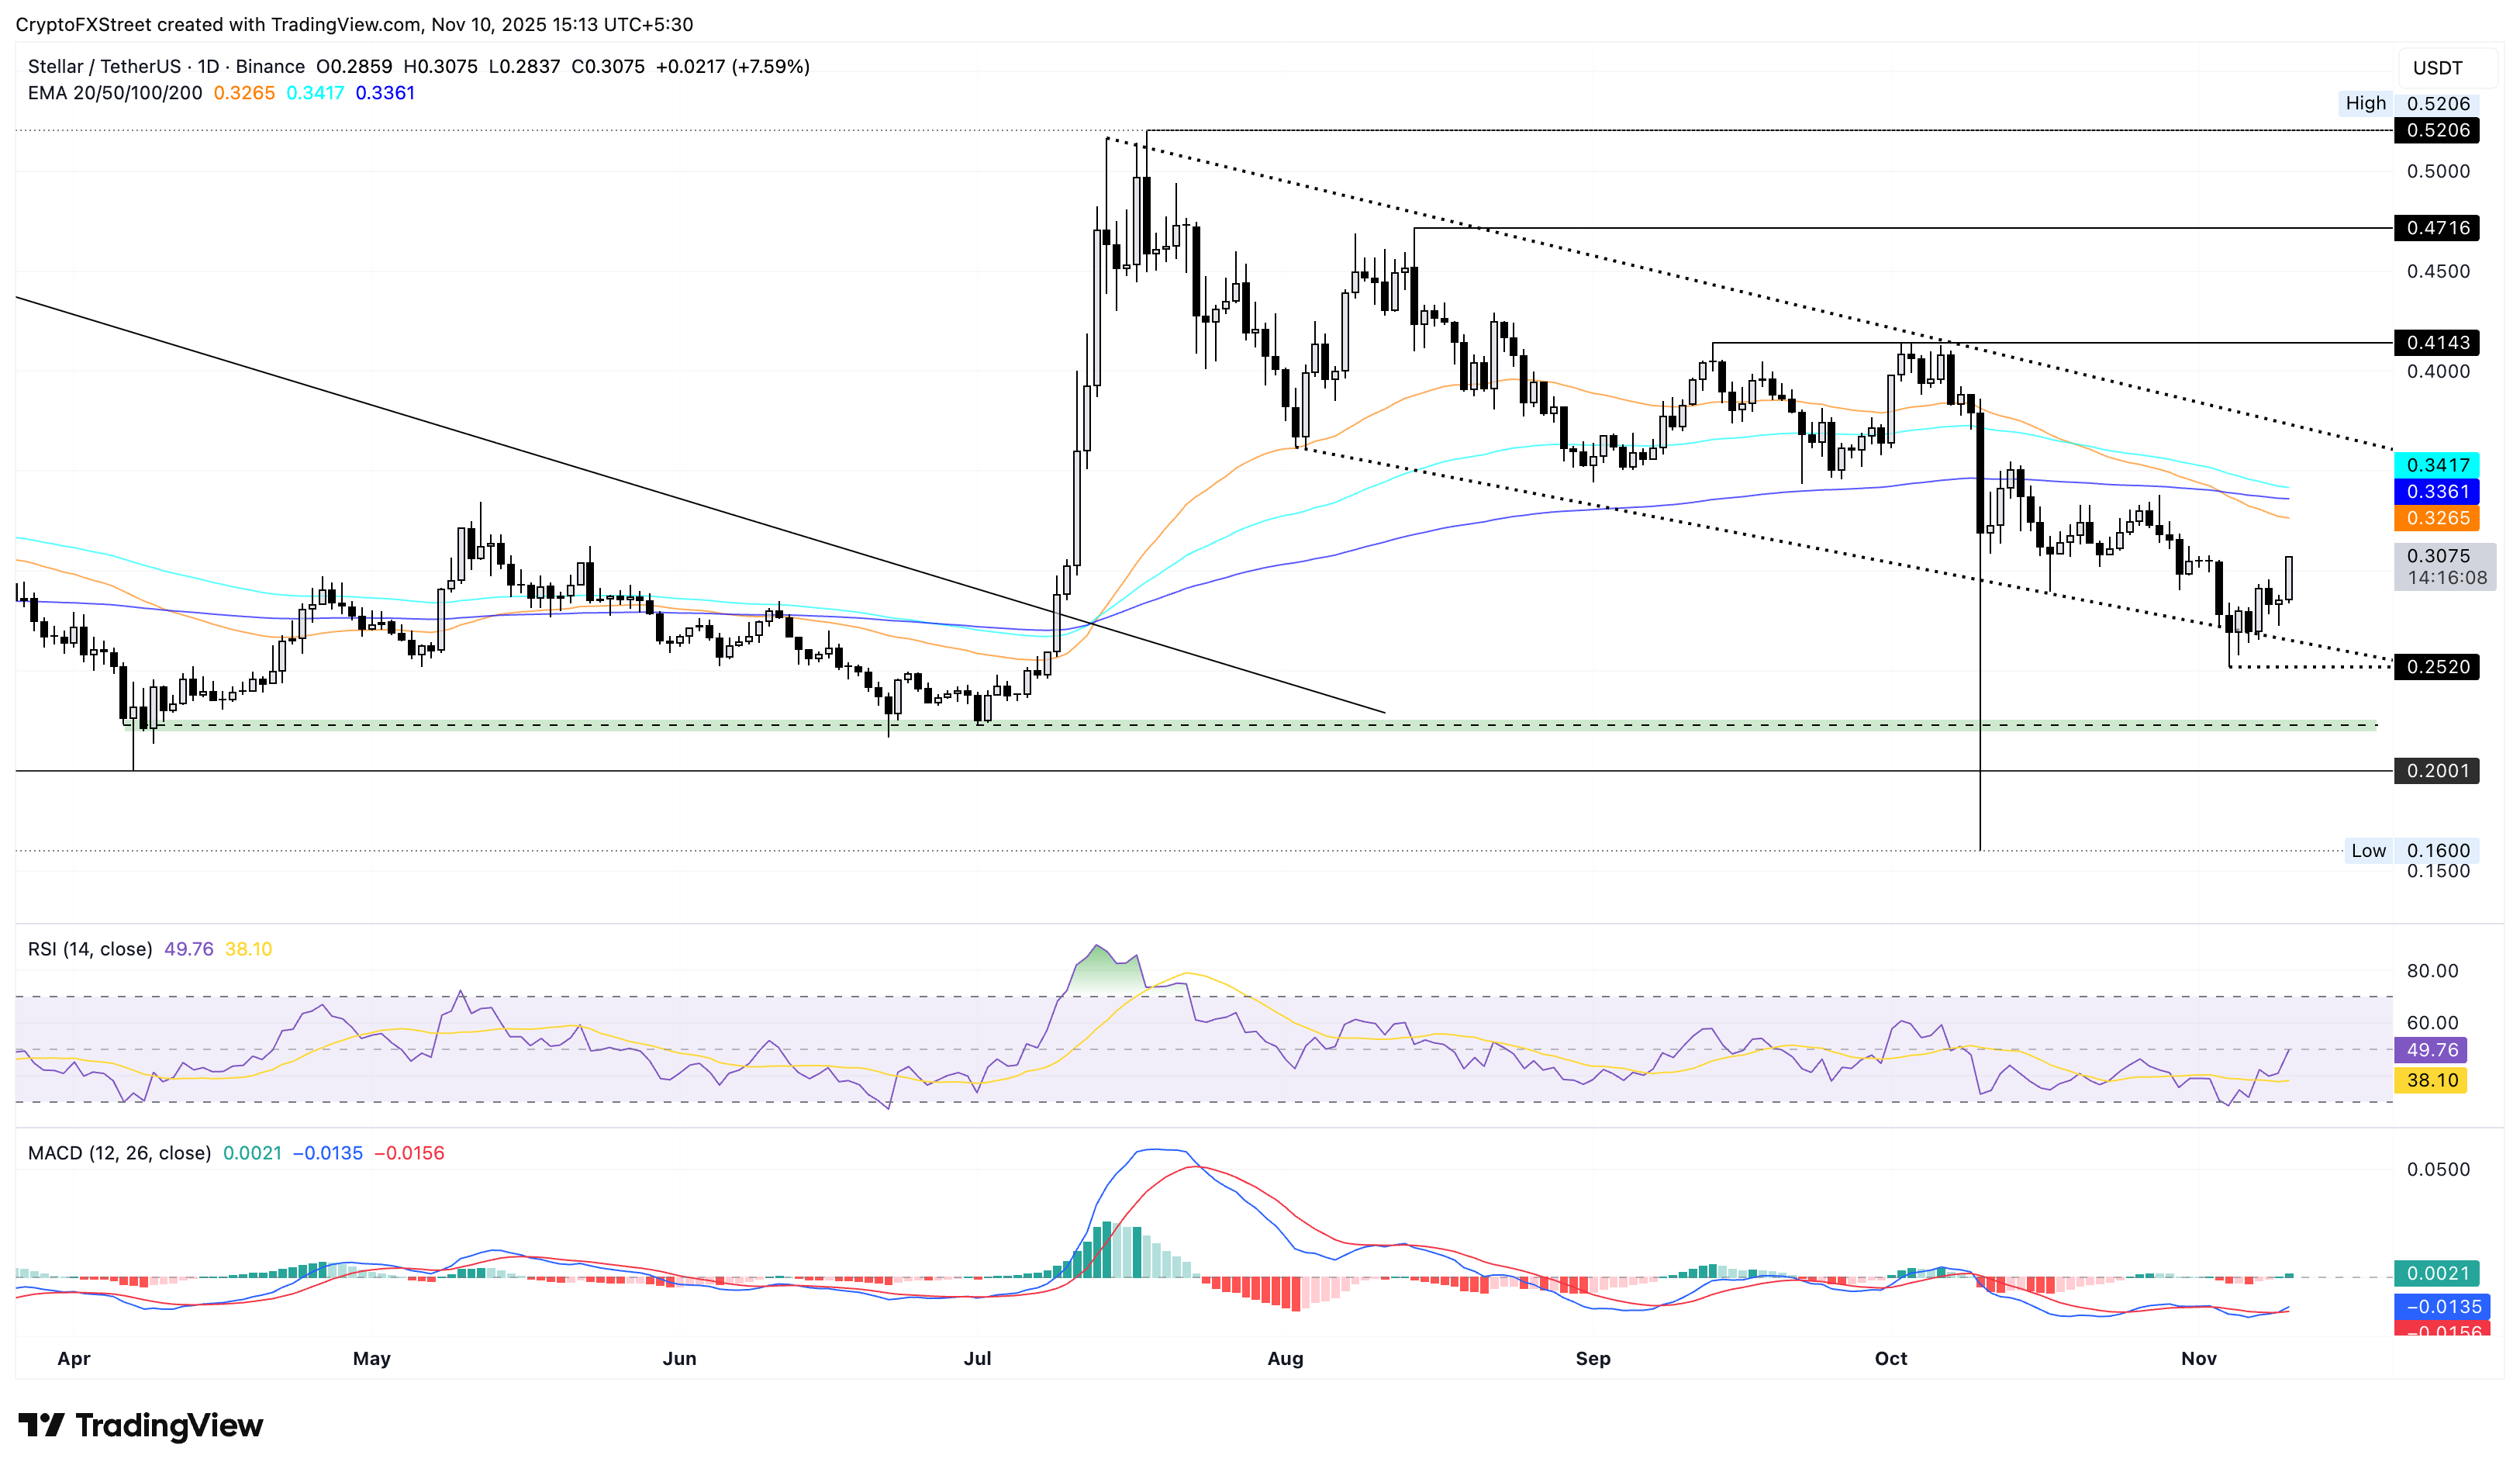
If the short-term recovery fails, a downside turn in XLM could lead to a drop to last week's low at $0.2520. A closing below this level would confirm the bearish breakout of the falling channel.

FXStreet
超過一百萬用戶依賴 FXStreet 獲取即時市場數據、圖表工具、專家洞見與外匯新聞。其全面的經濟日曆與教育網路研討會協助交易者保持資訊領先、做出審慎決策。FXStreet 擁有約 60 人的團隊,分布於巴塞隆納總部及全球各地。
Read More


