
Trade The World
Top 3 Price Prediction: Bitcoin rallies above $92,000 as Ethereum, Ripple show resilience
作者 Vishal Dixit
發布日期: 12 Jan 2026 | 修改日期: 12 Jan 2026


POPULAR ARTICLES

Bitcoin (BTC), Ethereum (ETH), and Ripple (XRP) are trading in green on Monday, fueling a broader cryptocurrency market recovery. Bitcoin and Ethereum extend gains for the second consecutive day, crossing above $92,000 and $3,100, respectively, while XRP stabilizes near $2.00.
- Bitcoin trades beyond $92,000 on Monday, crossing above the 50-day EMA.
- Ethereum rebounds within a symmetrical triangle pattern on the daily chart, mirroring Bitcoin’s recovery.
- Ripple holds at the key support of the 50-day EMA, sustaining above the $2.00 psychological mark.
Bitcoin (BTC), Ethereum (ETH), and Ripple (XRP) are trading in green on Monday, fueling a broader cryptocurrency market recovery. Bitcoin and Ethereum extend gains for the second consecutive day, crossing above $92,000 and $3,100, respectively, while XRP stabilizes near $2.00. Technically, BTC and ETH flash bullish potential while XRP remains at a crossroads.
Bitcoin regains bullish momentum
Bitcoin edges higher by 1% at press time on Monday, extending Sunday’s rebound from near the December 17 high of $90,365. The intraday recovery trades above the 50-day Exponential Moving Average (EMA) at $91,610, aiming for the December 9 high at $94,588.
A decisive close above this level could extend the Bitcoin price toward the November 4 low at $98,944.
The technical indicators on the daily chart suggest a gradual shift in trend momentum toward bullishness. The Relative Strength Index (RSI) is at 57, rising from the halfway line and indicating renewed buying pressure. At the same time, the Moving Average Convergence Divergence (MACD) diverges from the signal line as a green histogram bar spikes from the zero line, signaling fresh bullish momentum.
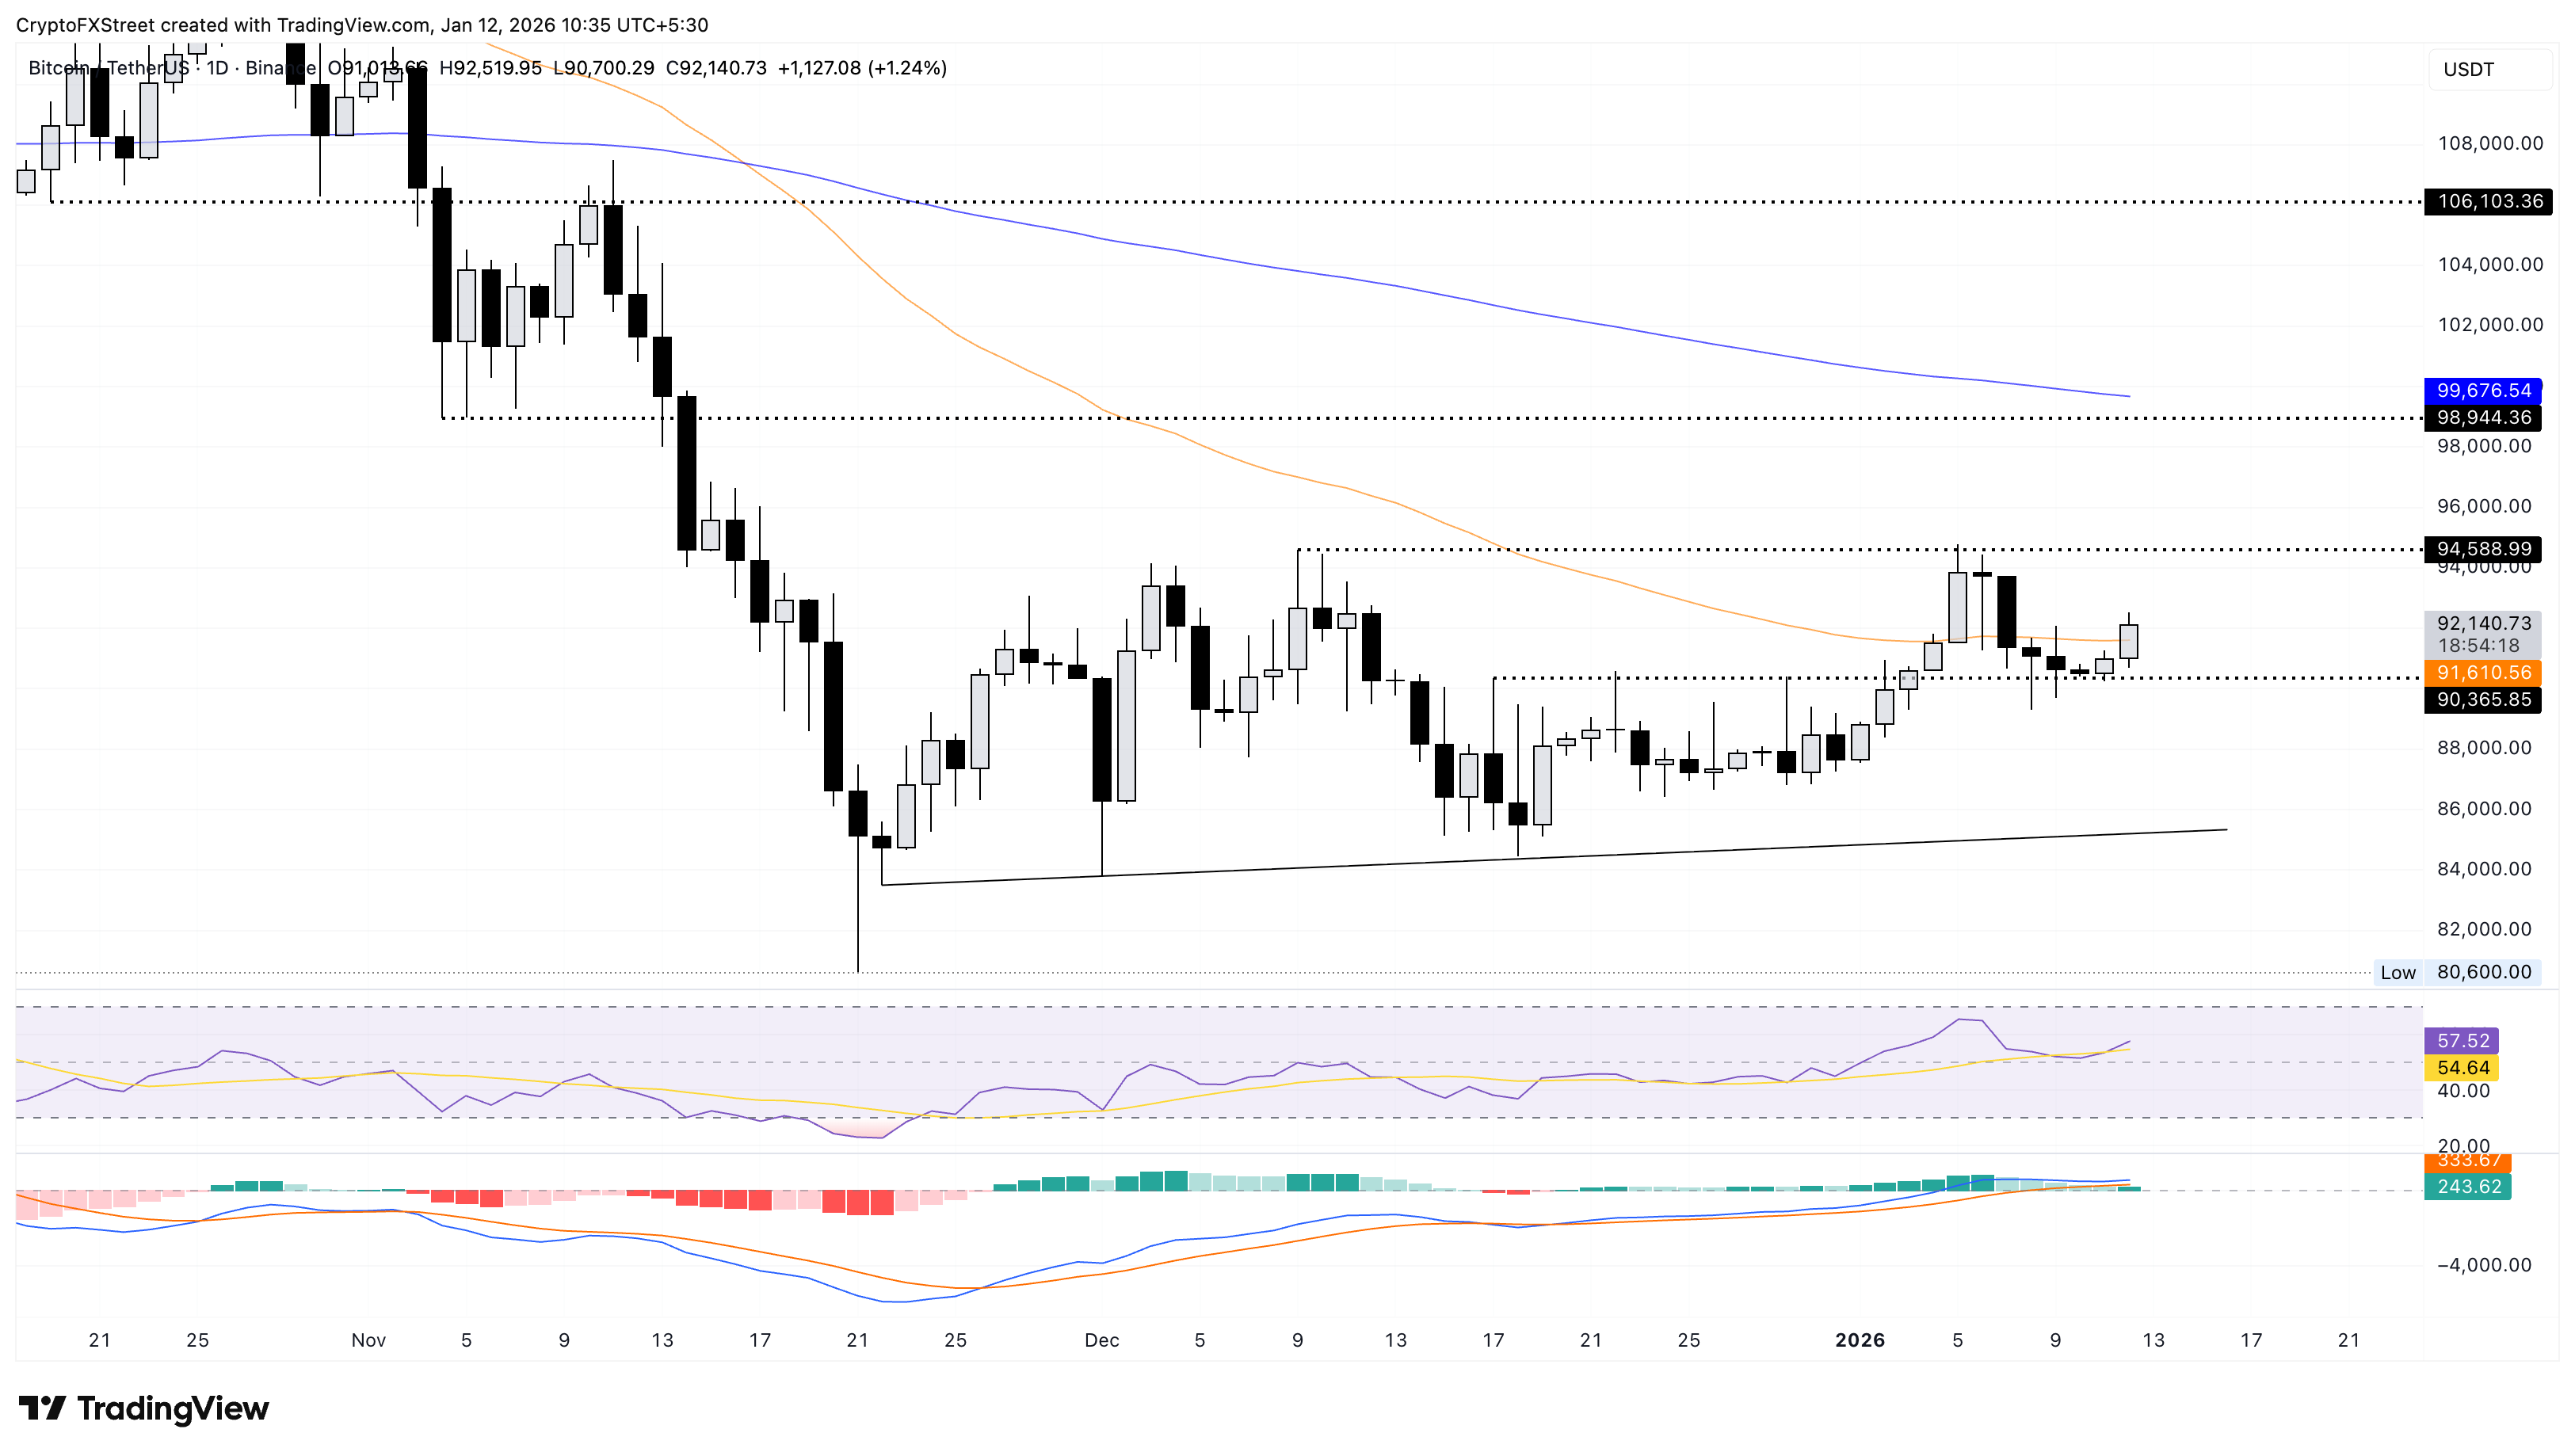
Looking down, if BTC slips below the 50-day EMA at $91,610, it could threaten the $90,000 psychological support.
Ethereum eyes bullish breakout of a triangle pattern
Ethereum trades above $3,100 at the time of writing on Monday, holding above the local support trendline connecting the December 18 and 29 lows.
The reversal in ETH targets the overhead resistance trendline connecting the November 12 and December 10 highs, near $3,260, which forms a symmetrical triangle pattern on the daily chart.
A decisive close above this level could confirm the bullish breakout of the triangle pattern, targeting the 200-day EMA at $3,339, followed by the support-turned-resistance zone near $3,650.
Similar to BTC, a gradual bullish shift in Ethereum’s momentum is visible. The RSI is at 56 on the daily chart, reversing from the halfway line while the MACD and signal line move flat.
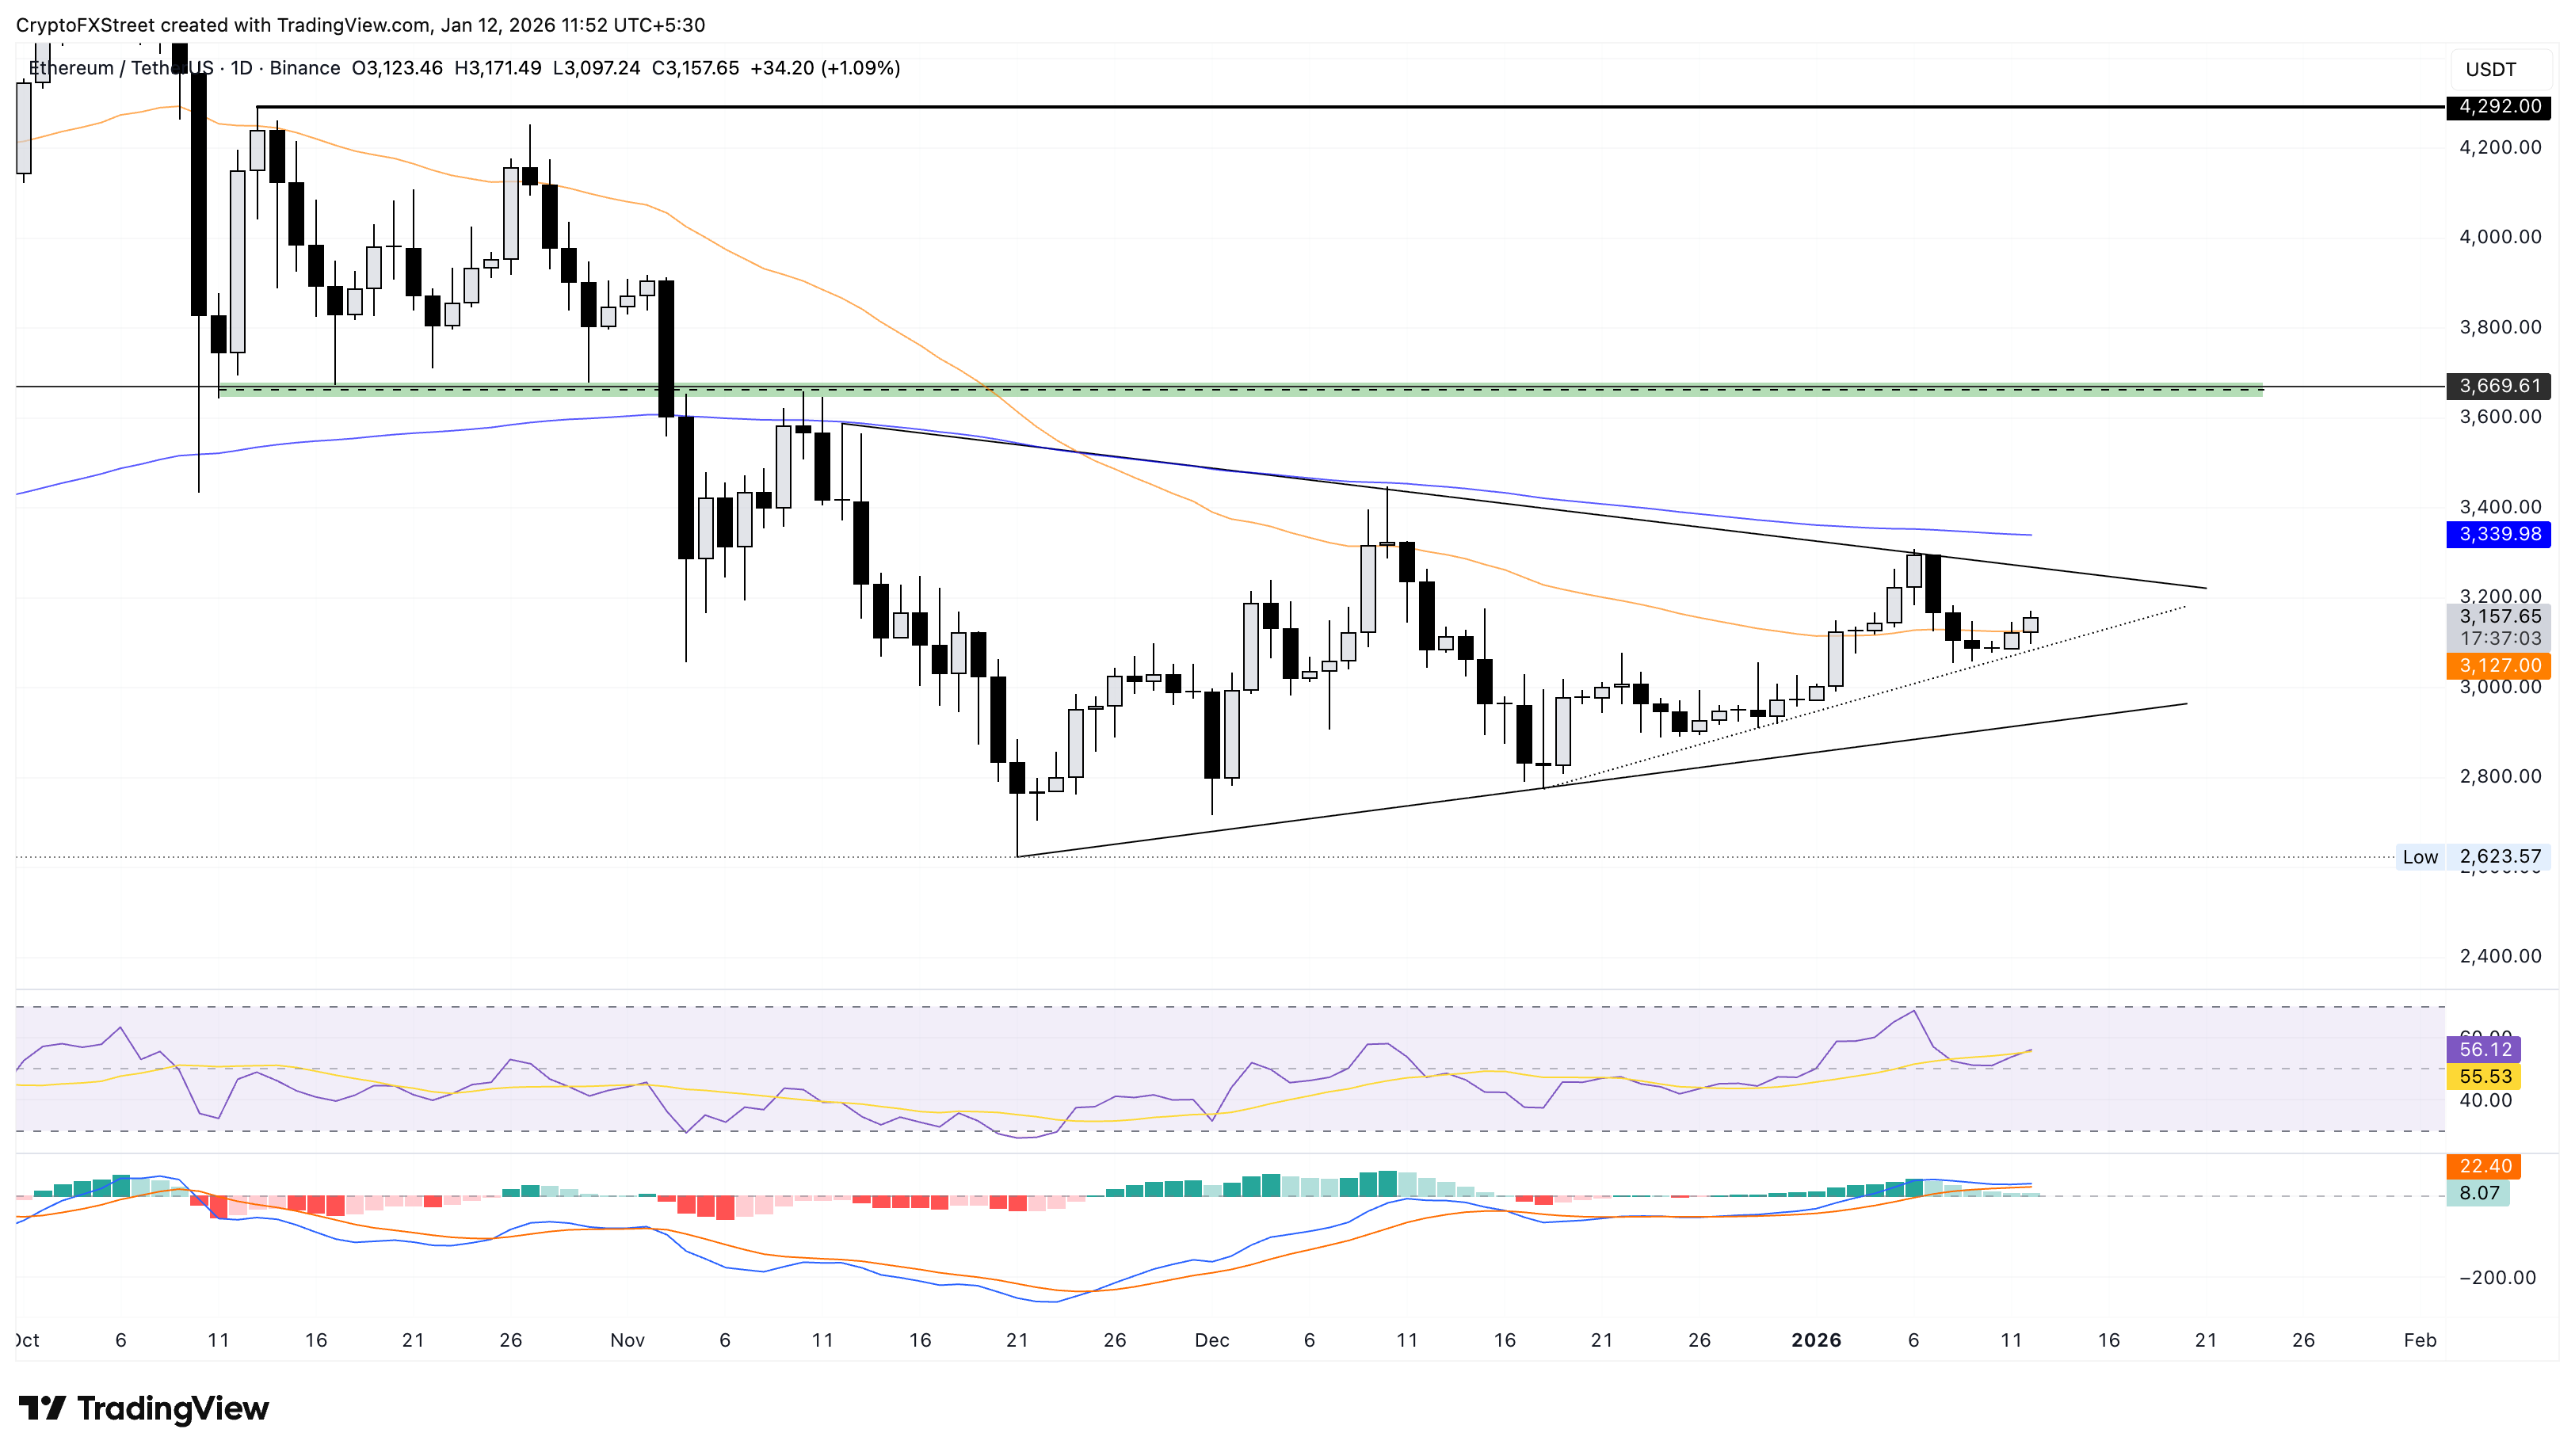
If Ethereum slips below $3,000, it could test a support trendline connecting the November 21 and December 18 lows near $2,920.
Ripple risks a drop below $2.00
Ripple holds above $2.00, with the 50-day EMA at $2.07 providing support. At the time of writing, XRP steadies at the moving average after seven consecutive days of losses.
A potential daily close below $2.00 could extend the XRP decline toward the December 20 high at $1.95.
The RSI at 52 flattens out near the midline as buying pressure declines, while the MACD risks crossing below the signal line, which would confirm a renewed bearish phase.
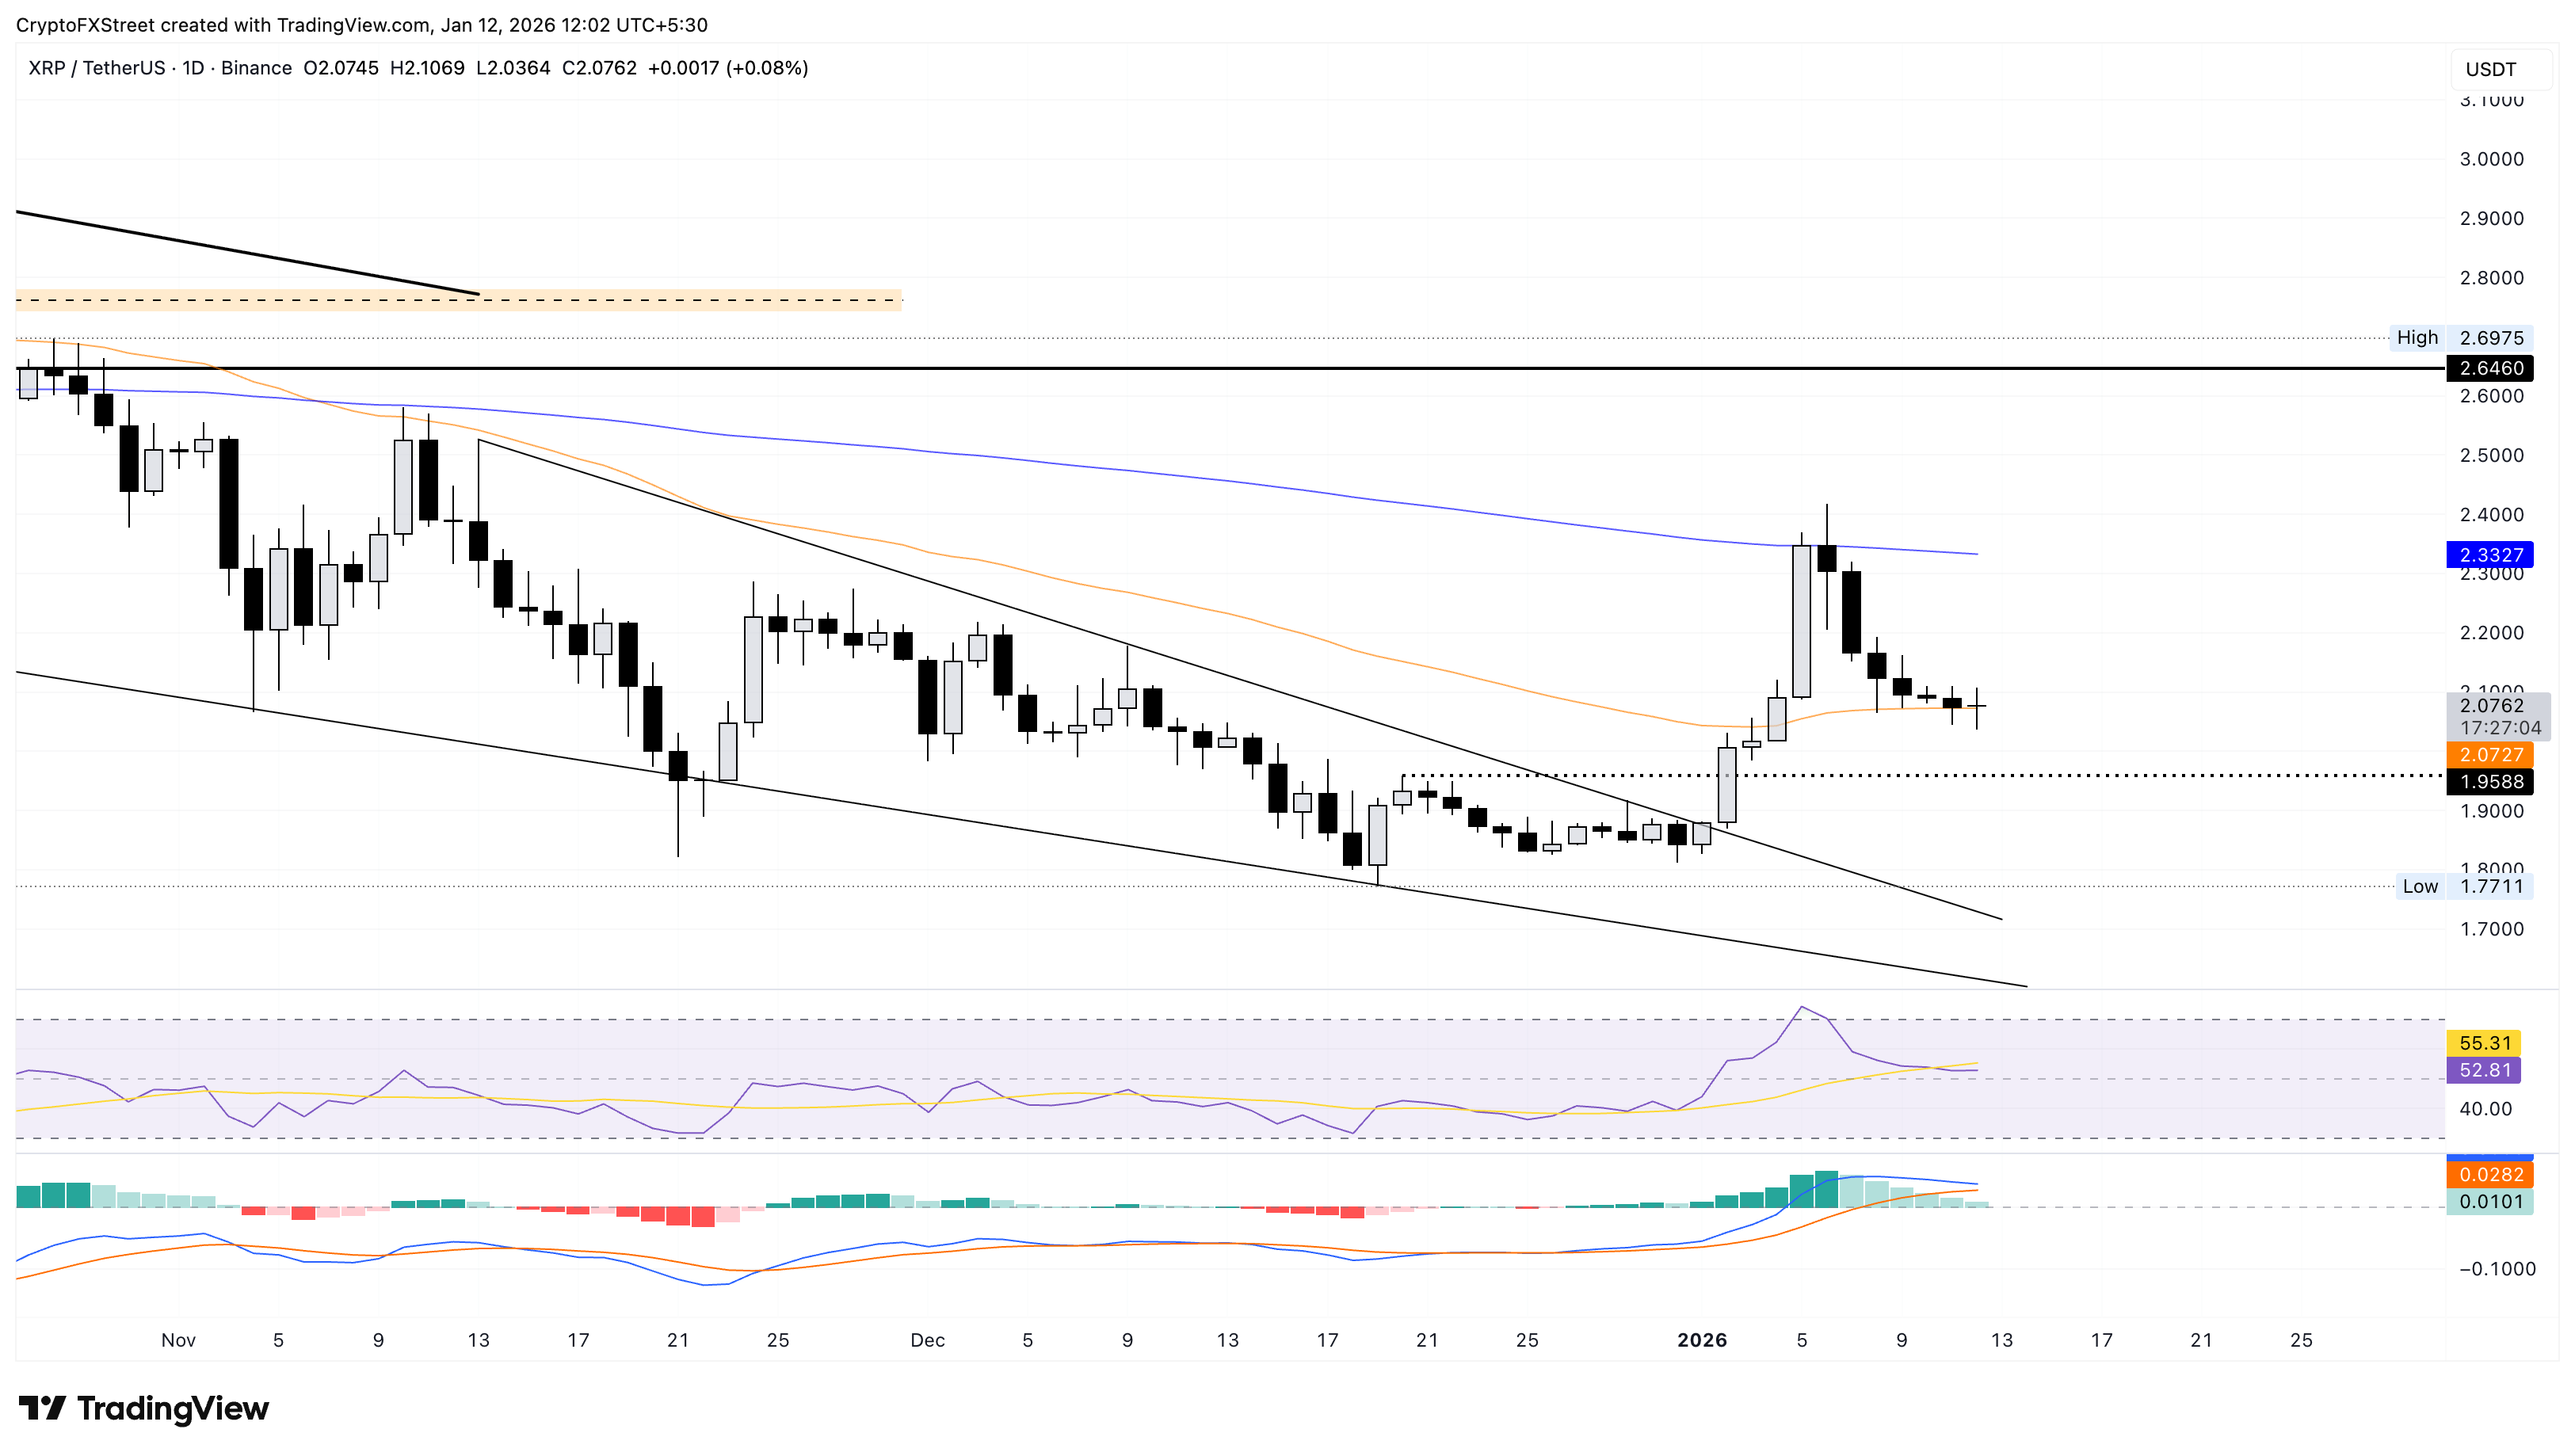
On the upside, a rebound in XRP could target the 200-day EMA at $2.33.
Bitcoin, altcoins, stablecoins FAQs
Bitcoin is the largest cryptocurrency by market capitalization, a virtual currency designed to serve as money. This form of payment cannot be controlled by any one person, group, or entity, which eliminates the need for third-party participation during financial transactions.
Altcoins are any cryptocurrency apart from Bitcoin, but some also regard Ethereum as a non-altcoin because it is from these two cryptocurrencies that forking happens. If this is true, then Litecoin is the first altcoin, forked from the Bitcoin protocol and, therefore, an “improved” version of it.
Stablecoins are cryptocurrencies designed to have a stable price, with their value backed by a reserve of the asset it represents. To achieve this, the value of any one stablecoin is pegged to a commodity or financial instrument, such as the US Dollar (USD), with its supply regulated by an algorithm or demand. The main goal of stablecoins is to provide an on/off-ramp for investors willing to trade and invest in cryptocurrencies. Stablecoins also allow investors to store value since cryptocurrencies, in general, are subject to volatility.
Bitcoin dominance is the ratio of Bitcoin's market capitalization to the total market capitalization of all cryptocurrencies combined. It provides a clear picture of Bitcoin’s interest among investors. A high BTC dominance typically happens before and during a bull run, in which investors resort to investing in relatively stable and high market capitalization cryptocurrency like Bitcoin. A drop in BTC dominance usually means that investors are moving their capital and/or profits to altcoins in a quest for higher returns, which usually triggers an explosion of altcoin rallies.

FXStreet
超過一百萬用戶依賴 FXStreet 獲取即時市場數據、圖表工具、專家洞見與外匯新聞。其全面的經濟日曆與教育網路研討會協助交易者保持資訊領先、做出審慎決策。FXStreet 擁有約 60 人的團隊,分布於巴塞隆納總部及全球各地。
Read More


