

EUR/GBP Price Forecast: Bearish bias persists below 0.8600
- EUR/GBP attempts to stabilize after sliding to a more than one-year low.
- Technical indicators suggest sellers remain in control despite the rebound.
- The break below 0.8600 keeps the near-term technical outlook bearish.
EUR/GBP trades with a positive bias on Tuesday as sellers take a breather following the recent selloff that pushed the cross to a more than one-year low. At the time of writing, EUR/GBP is trading around 0.8550 after rebounding from an intraday low of 0.8533, its lowest level since June 2025.
Selling pressure intensified after EUR/GBP recently broke the key 0.8600 level, a multi-month support zone. Despite the intraday rebound, technical indicators continue to favor sellers, suggesting the near-term bias remains bearish.

The economic calendar is relatively light across Europe this week, leaving traders focused on comments from European Central Bank (ECB) and Bank of England (BoE) officials for fresh policy clues.
ECB Governing Council member Fabio Panetta said on Tuesday that the "outlook remains fragile," adding that "upside inflation and downside growth risks remain."
Attention now turns to BoE policymaker Catherine Mann, who is scheduled to speak later on Tuesday.
Technical Analysis:
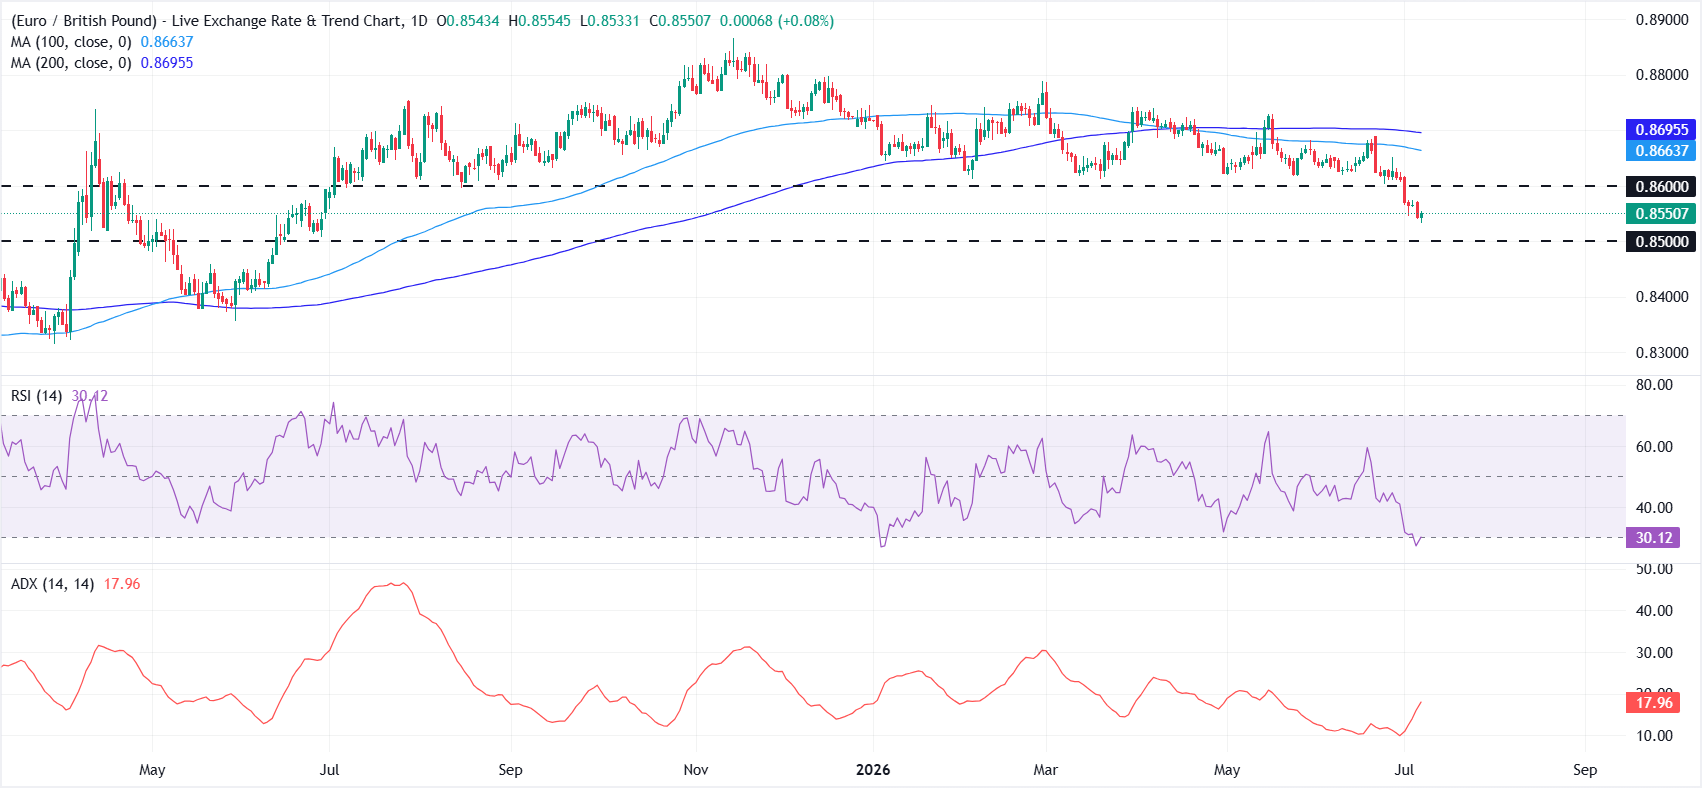
On the daily chart, EUR/GBP keeps a bearish near-term tone as it holds below both the 100-day and 200-day Simple Moving Averages (SMAs) at 0.8664 and 0.8696, respectively.
The pair has recently bounced from oversold territory, with the Relative Strength Index (RSI) recovering toward the 30 zone, while the low Average Directional Index (ADX) around 18 hints at a weak but persistent downtrend rather than an impulsive sell-off.
On the topside, initial resistance emerges at the horizontal barrier near 0.8600, ahead of the 100-day SMA at 0.8664 and the 200-day SMA at 0.8696, which together form a broader cap on recovery attempts.
On the downside, the next meaningful support sits at 0.8500, where a break would likely extend the bearish sequence toward fresh lows despite the tentative improvement in momentum.
(The technical analysis of this story was written with the help of an AI tool. Know more.)
Euro Price Today
The table below shows the percentage change of Euro (EUR) against listed major currencies today. Euro was the strongest against the New Zealand Dollar.
| USD | EUR | GBP | JPY | CAD | AUD | NZD | CHF | |
|---|---|---|---|---|---|---|---|---|
| USD | 0.14% | 0.22% | -0.05% | 0.03% | 0.27% | 0.28% | 0.21% | |
| EUR | -0.14% | 0.06% | -0.20% | -0.12% | 0.14% | 0.17% | 0.07% | |
| GBP | -0.22% | -0.06% | -0.26% | -0.18% | 0.07% | 0.10% | 0.00% | |
| JPY | 0.05% | 0.20% | 0.26% | 0.08% | 0.34% | 0.34% | 0.26% | |
| CAD | -0.03% | 0.12% | 0.18% | -0.08% | 0.23% | 0.29% | 0.19% | |
| AUD | -0.27% | -0.14% | -0.07% | -0.34% | -0.23% | 0.02% | -0.07% | |
| NZD | -0.28% | -0.17% | -0.10% | -0.34% | -0.29% | -0.02% | -0.09% | |
| CHF | -0.21% | -0.07% | -0.01% | -0.26% | -0.19% | 0.07% | 0.09% |
The heat map shows percentage changes of major currencies against each other. The base currency is picked from the left column, while the quote currency is picked from the top row. For example, if you pick the Euro from the left column and move along the horizontal line to the US Dollar, the percentage change displayed in the box will represent EUR (base)/USD (quote).














