

British Pound steadies as weak US data counters Iran risk
- US housing and industrial output miss, pressuring the Dollar.
- UK jobs weakness keeps focus on Wednesday’s inflation report.
- FOMC minutes could reshape Fed rate-path expectations next.
The Pound Sterling steadies on Tuesday as geopolitical tensions rise in the Middle East, while housing data misses estimates and US Industrial Production decelerates. The GBP/USD trades at 1.35846.
GBP/USD steadies as weak US data offsets geopolitical risks
Geopolitics is back in the driver’s seat of the financial markets, as US President Donald Trump stated that there are no talks ongoing with Iran, that the US naval blockade remains in full force, and that the Strait of Hormuz is open and operating.

Meanwhile, Fars reported that an adviser to Iran’s Supreme Leader says Iran remains committed to logic and dialogue but will not equate negotiation with surrender. In addition, Iran’s Foreign Minister said that the US goal from the war is that Iran’s surrender, adding that “America is begging to negotiate with us now,” reported Al Jazeera.
Data-wise, US Housing Starts in July fell 12.4% MoM, from June’s 1.415 million to 1.239 million, due to higher mortgage rates, which have spiked since the beginning of the Middle East conflict, and elevated home prices. At the same time, the Federal Reserve reported that Industrial Production for July dipped from the expected 0.3% to 0.2% MoM.
In the UK, jobs data revealed weakness, with the unemployment rate exceeding estimates at 4.8% and coming in at 4.9% in June. The data didn’t move the needle regarding the path of interest rates set by the Bank of England (BoE), with eyes turning to Wednesday’s Consumer Price Index (CPI) data.
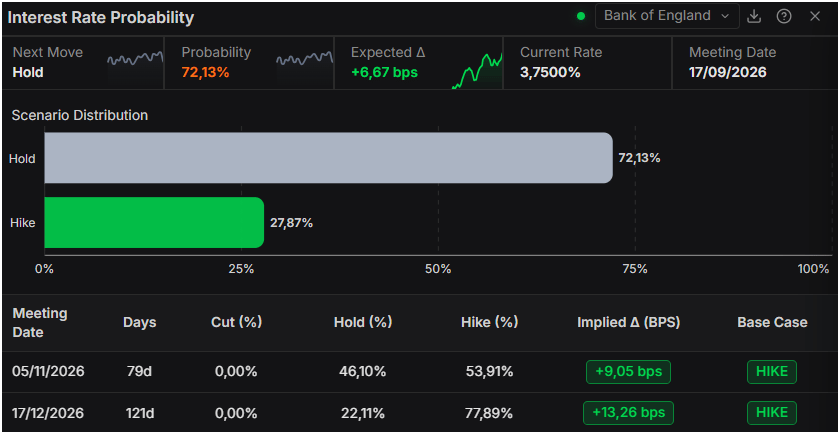
Estimates see UK headline inflation at 2.9% YoY, up from 2.6%, while core CPI is foreseen at 2.5% YoY, down from 2.6%. As of writing, money markets see the BoE holding rates at the September 17 meeting, with odds being at 72%. For December, the chances remain close to 78%, according to Prime Terminal.
In the US, traders await the FOMC's last meeting minutes for clues on the US central bank's interest rate path.
GBP/USD Price Forecast: Technical outlook
In the daily chart, GBP/USD trades at 1.3547, retaining a bullish near-term bias as spot holds above the simple moving average cluster around 1.3381 and a series of reclaimed trend-line levels turned support beneath the market. The Moving Average Triple (simple) sits comfortably below price, while the Relative Strength Index (14) at 63.9 stays in positive territory without yet signaling overbought conditions, hinting that upside momentum remains constructive as long as the pair defends the mid-1.35 region.
On the downside, initial support is seen at the recent trend-line break around 1.3502, followed by the former resistance trend-line break near 1.3414 and the moving average area around 1.3381, before an additional rising trend-line base at 1.3358. On the topside, the next notable resistance comes from the higher upward trend-line break near 1.3603, and a sustained move above this barrier would open the door for a continuation of the advance while keeping pullbacks towards 1.3502–1.3414 as potential buying opportunities.
(The technical analysis of this story was written with the help of an AI tool. Know more.)
Pound Sterling Price Today
The table below shows the percentage change of British Pound (GBP) against listed major currencies today. British Pound was the strongest against the New Zealand Dollar.
| USD | EUR | GBP | JPY | CAD | AUD | NZD | CHF | |
|---|---|---|---|---|---|---|---|---|
| USD | -0.03% | -0.03% | 0.05% | 0.01% | 0.00% | 0.27% | 0.09% | |
| EUR | 0.03% | 0.01% | 0.09% | 0.04% | 0.04% | 0.30% | 0.13% | |
| GBP | 0.03% | -0.01% | 0.06% | 0.04% | 0.03% | 0.30% | 0.12% | |
| JPY | -0.05% | -0.09% | -0.06% | -0.01% | -0.03% | 0.24% | 0.06% | |
| CAD | -0.01% | -0.04% | -0.04% | 0.01% | -0.02% | 0.26% | 0.07% | |
| AUD | -0.00% | -0.04% | -0.03% | 0.03% | 0.02% | 0.27% | 0.09% | |
| NZD | -0.27% | -0.30% | -0.30% | -0.24% | -0.26% | -0.27% | -0.16% | |
| CHF | -0.09% | -0.13% | -0.12% | -0.06% | -0.07% | -0.09% | 0.16% |
The heat map shows percentage changes of major currencies against each other. The base currency is picked from the left column, while the quote currency is picked from the top row. For example, if you pick the British Pound from the left column and move along the horizontal line to the US Dollar, the percentage change displayed in the box will represent GBP (base)/USD (quote).













